Gold (And Stock) Cycles Higher Into Spring


Last week's trading saw gold forming the more bearish pattern of an early-week high into resistance, with the metal hitting a peak of 1598.50, made on a Monday time top. From there, sharply lower prices were seen into mid-week, here dropping down to a Wednesday bottom of 1551.10 - before bouncing off the same into Friday.
Gold's Short-Term Picture
For the near-term action, the strength into the February 3rd was expected to give way to a sharp decline - simply due to the configuration of the 34-day wave:
From last weekend: "there is a smaller 34-day cycle, which has been pointing sideways-to-down off the 1/8/20 peak. In terms of time, this 34-day wave is next due to trough around the first week of February, a move which is anticipated to end up as countertrend. Normally, a cycle will revert back to a moving average of the same length before bottoming, and with that the ideal path would favor a drop back to the 34-day moving average in the coming week or so, setting up the expected countertrend low for this wave."
As noted above, the downward phase of the 34-day cycle was deemed to be in force - and with that we were looking for a fairly sharp decline to play out into the first week or so of February, where this wave is next projected to trough. Here again is that 34-day cycle component:
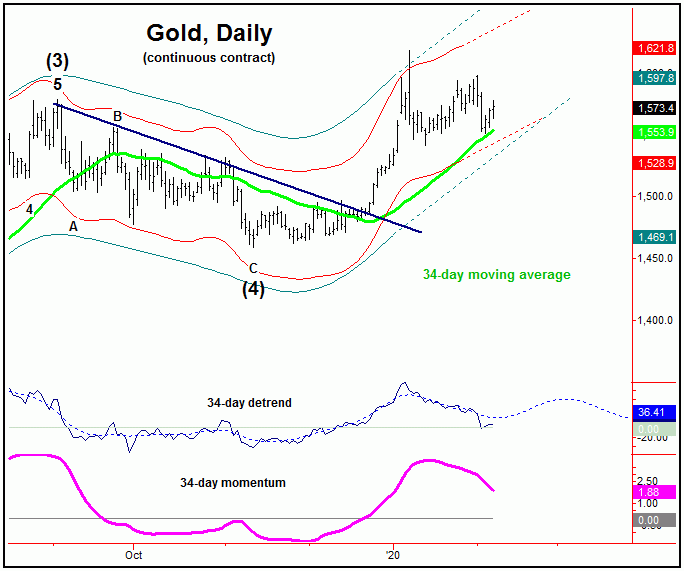
In terms of price, as mentioned a decline back to the 34-day moving average was favored - simply due to my rule in regards to cycles and moving averages. Even said, the decline into late last week has fallen just short of a tag of this key moving average - though just slightly. In terms of patterns, however, the correction phase of this wave has been expected to end up as countertrend - against the prior 34-day trough.
With the above, the near-term action has played out about as expected, and the 34-day cycle may well have troughed with Wednesday's tag of the 1551.10 figure (April, 2020 contract). Having said that, it is too early to actually confirm the same - though we will be tracking this closely for technical/price indications in our Gold Wave Trader market report.
Gold's Mid-Term Rally Phase
From the comments made in prior articles, the gold market is projected higher overall into the late-February timeframe or beyond, due to the configuration of the larger cycles that we track, primarily the 72 and 154-day waves. In terms of price, I originally mentioned the 1630-1660's (April, 2020 contract) as a potential magnet, with that assessment later indicated by the 154-day cycle - which confirmed an upside target to the 1658-1691 region. Take a look at our next chart:
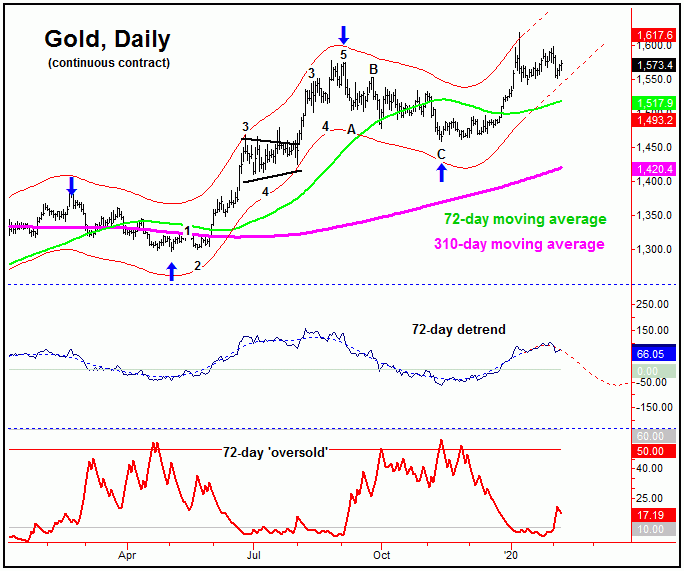
Even with the above said and noted, the expected upside only has a few weeks to play itself out, at best, as the 72-day wave is looking set to peak into the late-February to early-March timeframe. From whatever high that forms with this component, another sharp decline phase is expected to play out into mid-Spring, with more precise details of how that decline will play out noted in our Gold Wave Trader market report.
U.S. Stock Market Update
From the comments made over the prior month, the U.S. stock market (as measured by the SPX) was looking for a sharp decline to play out into the late-January to early-February timeframe, with that decline expected to come from the most dominant cycle we track, the 45-day component, shown again on the chart below:
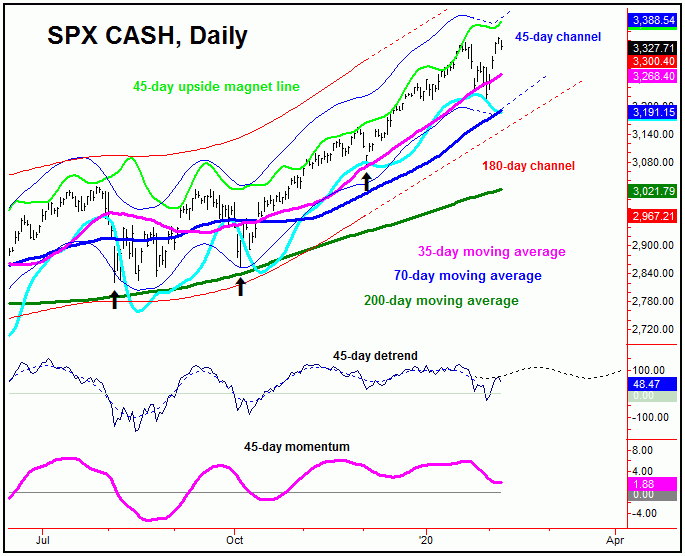
In terms of price with our 45-day cycle, the overall expectation was that a minimum drop back to the 35-day moving average would be seen on the recent decline, an assessment which was easily met with the drop into the late-January bottom.
Going further with the above, with the action into early last week we were able to confirm the low in place for the recent correction, with our expectation calling for a push back to new all-time highs - which we have also seen with the recent strength. That assessment came from the larger 180 and 360-day cycles (i.e., pointing higher into Spring), which projected the downward phase of the smaller 45-day wave to end up as a countertrend affair.
Even with the above said and noted, the ideal path would favor additional strength in the days/weeks ahead, though there should be a sharp correction phase playing out in-between - which we may already be in, and coming from the smallest-tracked cycle for U.S. stocks, the 10-day wave:
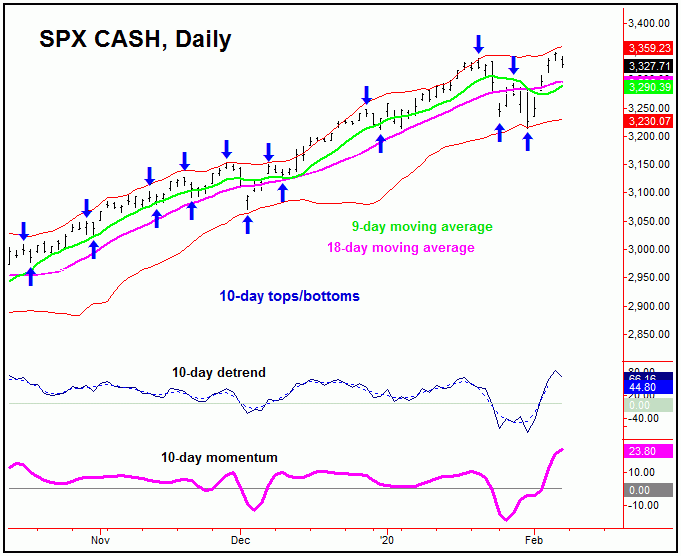
For the short-term, it is too early to suggest that the downward phase of the 10-day wave is in progress - though it may well be. In terms of patterns, we would favor the same to end up as countertrend, to be followed by higher highs on the next swing up - where we will be on the lookout for the next mid-term peak to form. So far, the market is playing out the script outlined in our Market Turns 2020 Forecast issue.
Stepping back, as noted above the mid-term picture has the larger 180 and 360-day cycles pointing higher into early-Spring:
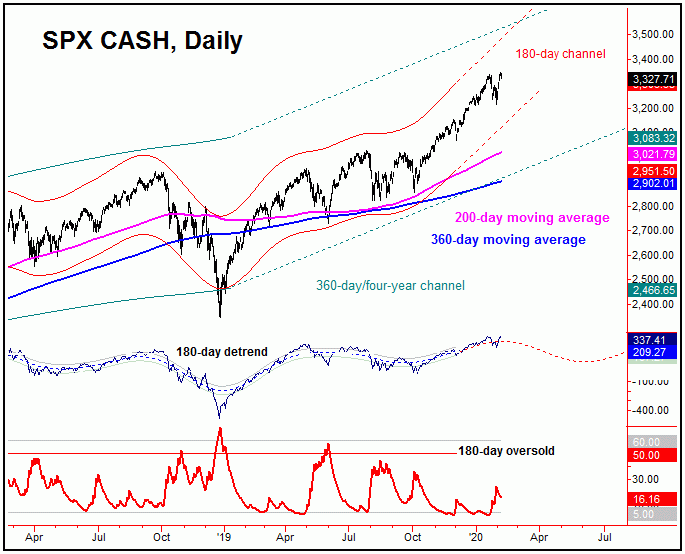
The chart above shows the smaller of the two waves, the 180-day cycle. In our Market Turns report - which covers the U.S. stock market - we have identified an ideal time and price range for the next mid-term peak to form, from which the largest percentage decline of the year is expected to unfold. That decline is likely to see the 200 and 360-day moving averages acting as magnets.
For the bigger picture, however, until proven otherwise the decline into the next mid-term trough is favored to end up as a larger countertrend affair - holding well above the prior 180-day trough. If correct, then the probabilities will favor the strongest rally of the year playing out, one which is likely to be a blockbuster affair - and which is expected to take U.S. stocks into a long-term peak - as a recessionary phase starts to play out in the U.S. economy into next year. Stay tuned.
Jim Curry
The Gold Wave Trader
http://goldwavetrader.com/
http://cyclewave.homestead.com/
More from Gold-Eagle


