Gold And U.S. Stock Cycle Update


Last week's trading saw gold forming its high in Wednesday's session, here doing so with the spike up to the 1962.50 figure. From there, a sharp decline was seen into Friday's session, with the metal dropping all the way down to a low of 1827.80 - before bouncing slightly off the same to end the week.
Gold's Bigger Picture View
With the action seen in recent days, it pays to take a 'stepped-back' look at the cyclical position of the gold market. With that, the upward phase of the larger four-year cycle is still seen as intact, and is looking for an eventual push up to the 2212.00 - 2340.56 region in the coming months, which is our open upside target with this component:
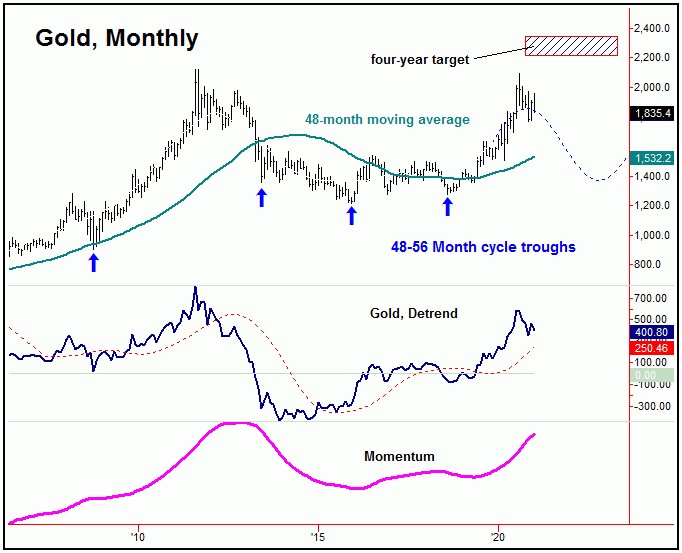
As mentioned in past articles, our cyclic targets have an 85% probability of being met, and with that the overall assumption is that gold will see an eventual push up to this open target in the coming months. Precisely when this target will be hit is always less clear, though our analysis favors it to be met on or before late-Summer of this year.
Gold's Mid-Term Picture
As mentioned in past articles, the next larger rally phase is expected to play out as a result of the smaller 154-day wave, which is shown again on the chart below:
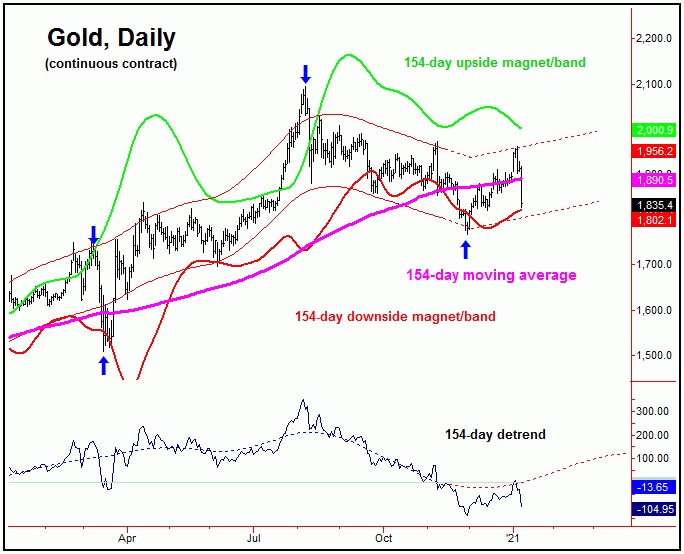
With the reversal above the 1912.00 figure into early last week, we have our best indication that this 154-day cycle bottomed back in late-November - and with that is headed higher into late-February or early-March. If correct, then the current spike down should end up as a countertrend affair, holding above the 1767.00 figure.
Having said the above, in our analysis we noted that gold had one more low to deal with later this month, with more exact details mentioned in our Gold Wave Trader market report. Having said that, a key level to the downside looks to be the 1800 figure, plus or minus, which is the bottom of our newly-extrapolated 154-day cycle channel - which turned up on the recent break above the 1912.00 figure.
Stepping back, however, gold won't be out of the woods completely, until the low for our next larger wave - the 310-day cycle - is set in place. Here again is that 310-day component:
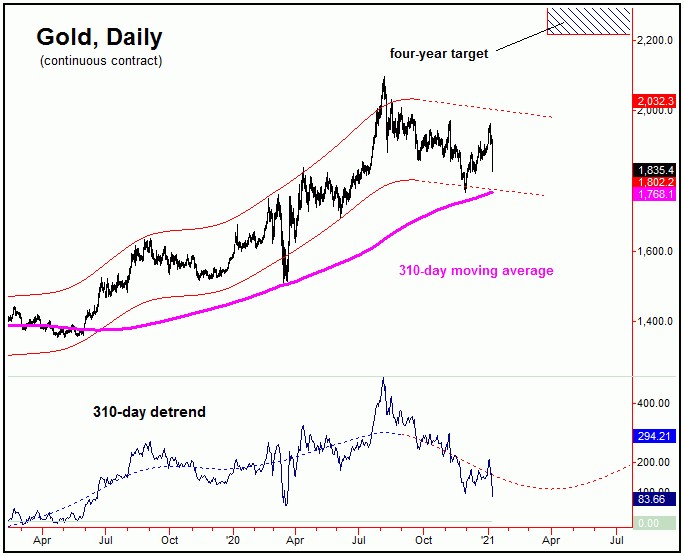
As mentioned last weekend, this 310-day cycle is next set to trough around the month of April, though with a good plus or minus variance in either direction. In terms of price, with a cycle of any length having a good tendency (i.e., 85% or-better odds) of reverting back to a moving average of the same length, the 310-day moving average will act as an eventual downside magnet going forward. Note that our 310-day moving average is now at or near the late-November price trough.
The bottom line for gold is that - while we will likely see the recent weakness giving way to another rally into the late-February timeframe, we would expect that rally to give way to weakness again into the month of April, for a more definable bottom with the 310-day wave. From there, the largest percentage rally of 2021 is expected to materialize, coming as a result the combination of 310-day and four-year waves.
S&P 500 Index
From the comments made in past articles, the U.S stocks are pushing higher well into the year 2022 or later, due to the configuration of the larger 4, 9 and 18-year cycles. For the mid-term picture, all the way back in the Summer of last year, we suggested a push up to the 3600's for the SPX into late last year - which was obviously met with the action that followed.
Having said that, also back in the Summer of last year we triggered an upside target with the larger 360-day cycle, to the 3812.56 - 3960.44 SPX CASH region:
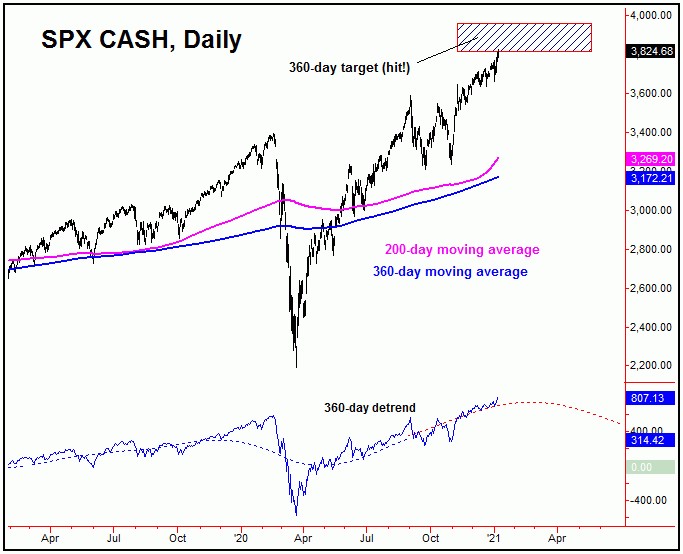
With the action seen into last week, our 360-day cycle target has now been met. As mentioned earlier, our targets have an 85% reliability of being hit, once triggered.
Having said the above, due to the projected path with our 360-day detrend, there is still plenty of time left before our 360-day cycle is expected to roll over. With that, the probabilities favor even higher prices still out there for this wave, before giving way to the largest-percentage decline of 2021 into later this year.
Technical Action
With the new highs in price into last week, we want to take a look at the accompanying action from technicals, to give us an expanded view of the U.S. stock market. Take a look at the following chart:
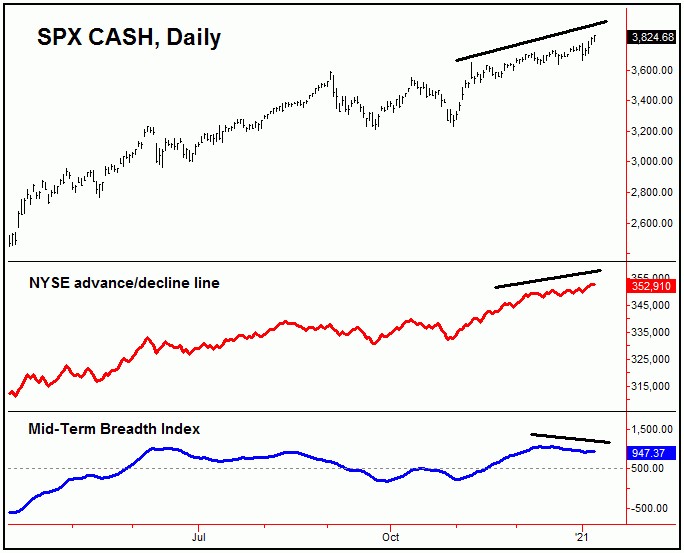
The chart above shows the NYSE advance/decline line in red, which continues to push to higher highs along with price - and with that is seen as a strong bullish signal for the SPX. That is, the advance/decline line has a strong tendency to diverge from price by anywhere from 4-11 months at major tops, and with that we have to assume that any larger-degree price peak is at least that much into the future.
On the flip side, however, we have our Mid-Term Breadth index (lowest pane, in blue) diverging from price action. This can be a technical warning signal - though only if key levels are violated, which to us means the low-end 3600's on the SPX.
Should this divergence in Mid-Term Breadth continue to materialize in the days/weeks ahead, it will become more bearish, however, with the last major divergence with this indicator seen prior to the February, 2020 price peak - which was followed by a whopping decline of 35% in the next 6 weeks.
We have just recently released our 2021 Forecast issue for the U.S. stock market, which includes a detailed analysis of seasonality, the ‘presidential cycle’ and decennial patterns, the Bradley indicator for 2021 - as well as our major Time Cycle Forecast's projected path. These go into more detail on how we expect the U.S. stock market to play out for the year as a whole - which is setting up to be one for the record books, but with the usual twists and turns in-between. Stay tuned.
Jim Curry
The Gold Wave Trader
http://goldwavetrader.com/
http://cyclewave.homestead.com/


