Gold Cycle Update Exclusive
 share
share
 share
share
 share
share
 share
share
 share
share
 Gold's Short-Term View
For the very short-term, the downward phase of the 10 and 20-day cycles is deemed to be back in force with the recent action. In terms of time, the 10-day wave is 7 trading days along, with the larger 20-day component now 23 days along - with the overall combination of these waves at or into bottoming territory.
The chart below again shows the smaller 10-day wave:
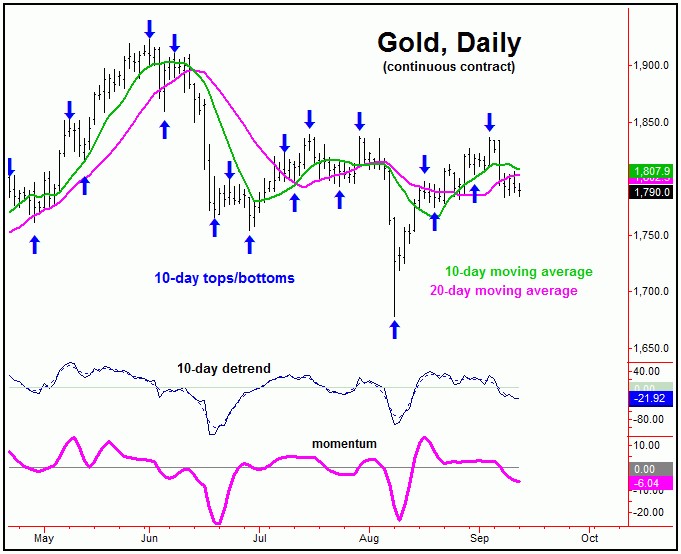
In terms of price, it is too early to confirm an upside ‘reversal point’ for these 10 and 20-day cycles, though one should ideally materialize in the coming days - with the latest numbers always posted in our Gold Wave Trader report.
Support to the current correction phase looks to be at or into the 1738-1776 region, which encompasses the 38-61% retracement of the prior swing up, but with a key focus on the 1757-1776 level inside this range. In terms of time, the next key date range of focus is the September 15-16 reversal date area, which - if lower lows are seen into the same - may be primed to bottom the smaller swing down.
In terms of patterns, the overall assumption is that the current correction phase of the 10 and 20-day cycles will end up as a countertrend affair - which, ideally, means that the metal will try to remain above the 1756.00 figure (December, 2021 contract) on a daily close. Once the 10 and 20-day cycles do bottom out, a minimum rally back to the 10-day moving average or higher should be expected to materialize.
Gold's 3-6 Week Outlook
Stepping back, with the daily close back above the 1829.40 figure (seen on 9/3/21), the same was our best confirmation of a 'momentum reversal' to the upside with the larger 72-day wave, which is shown again on the chart below:
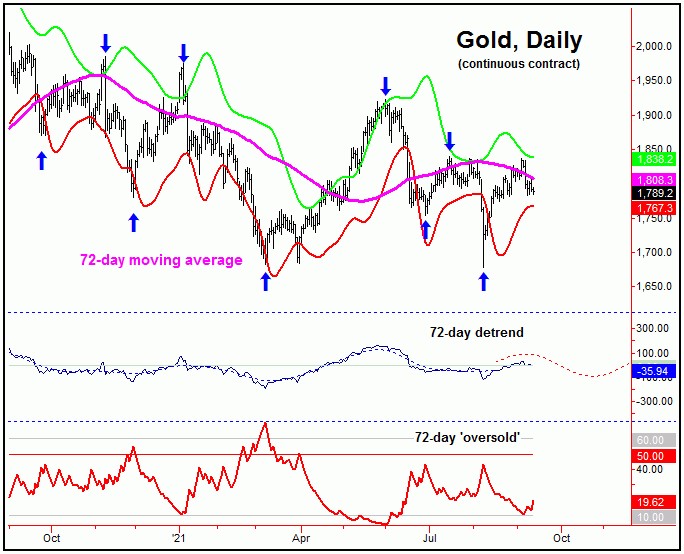
With the above said and noted, the ideal path going forward would be for Gold to see another try at our upper 72-day cycle band. From there, the probabilities will favor another peak to form, giving way to a sharp decline into what looks to be the late-October timeframe, plus or minus. That range is where this 72-day cycle is next projected to trough. It is also where a low for the larger 154-day component is due, with this particular wave shown again on the chart below:
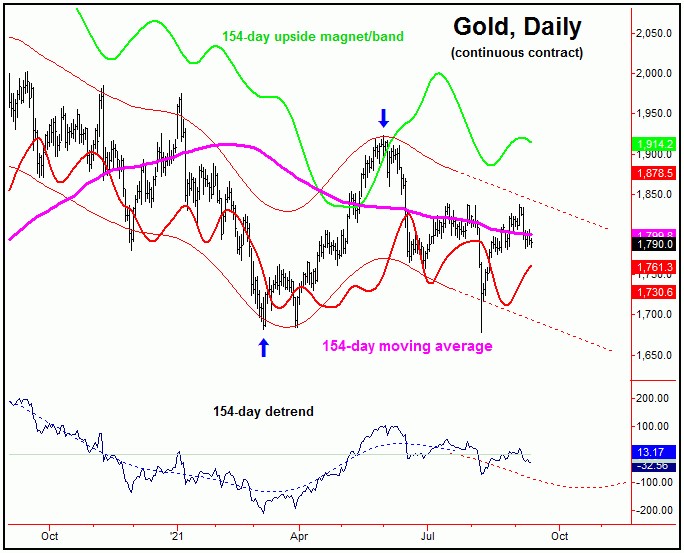
For the mid-term picture, from whatever low that does form with the 72 and 154-day waves into late-October (but with a wide plus or minus variance in either direction), Gold should see a nice rally playing out in the months to follow. In terms of price, that rally should be somewhere in the range of 20% or more off of whatever bottom that is seen with the 72 and 154-day cycles, which is the statistical average rally for the larger 154-day component.
All said, the short-term path is seen as bottoming, but with the larger 72 and 154-day waves viewed as pointing south into late-October or later, where the next bottom of significance should materialize. From there, a sharp rally should play out in the months to follow, a move which may or may not end up as countertrend, against the June peak from this year. Stay tuned.
Jim Curry
The Gold Wave Trader
http://goldwavetrader.com/
http://cyclewave.homestead.com/
********
share
share
share
share
share


