Gold Erased Its April Rally – What’s Next?


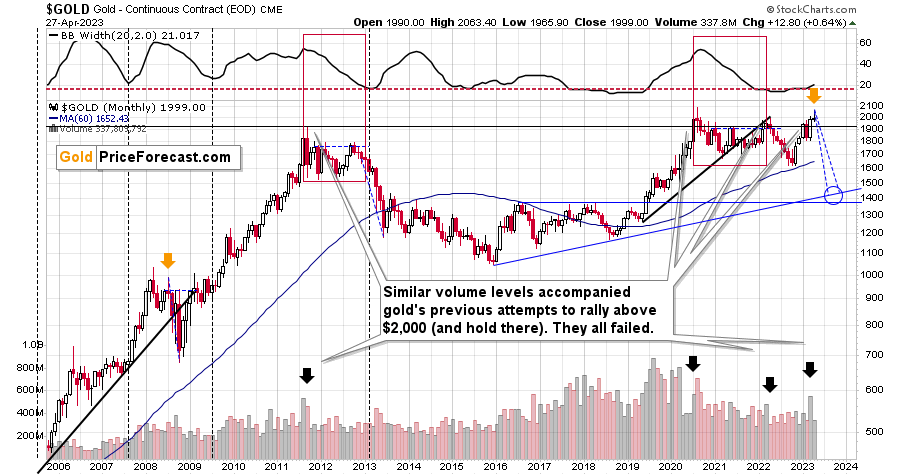
April had started with gold at $1,990, then gold moved as high as $2,063.40, and yesterday, it closed at $1,999. At the moment of writing these words, gold futures (because that’s what you see on the above chart) are trading at $1,993.
Monthly Reversal Candlestick
This means that gold formed a huge monthly reversal candlestick. Since the opening and closing (assuming that the current price will be the final price for the end of April) prices are almost identical, this candlestick is called a “gravestone doji”.
If gold moved a bit higher from here, it would create a “shotting star” candlestick based on its April price movement.
And if it moved a bit lower from here, it would… Also create a “shooting star” candlestick, just a different one.
What would the difference be?
None, because all those candlesticks are reversal patterns. In other words, the implications are almost certainly going to be bearish after today’s session, regardless of what fancy name we use to call this month’s price movement.
The only thing that could make this month’s candlestick bullish would be a rally of at least $30, which would have to happen today. And based on the analysis of gold’s pre-market decline, it’s highly unlikely that we’ll see something like that.
I wrote on numerous occasions about how important weekly gold price changes are, but monthly price changes take it to yet another level. A full month is enough time for any price noise to average-out and disappear. What ultimately happened?
This month in gold, ultimately, nothing happened except gold’s failure to break above $2,000.
The monthly reversal is a very powerful, bearish indication that points to lower gold prices in the following months.
Historical Comparison to 2008
How can things get any more bearish based on the above chart alone?
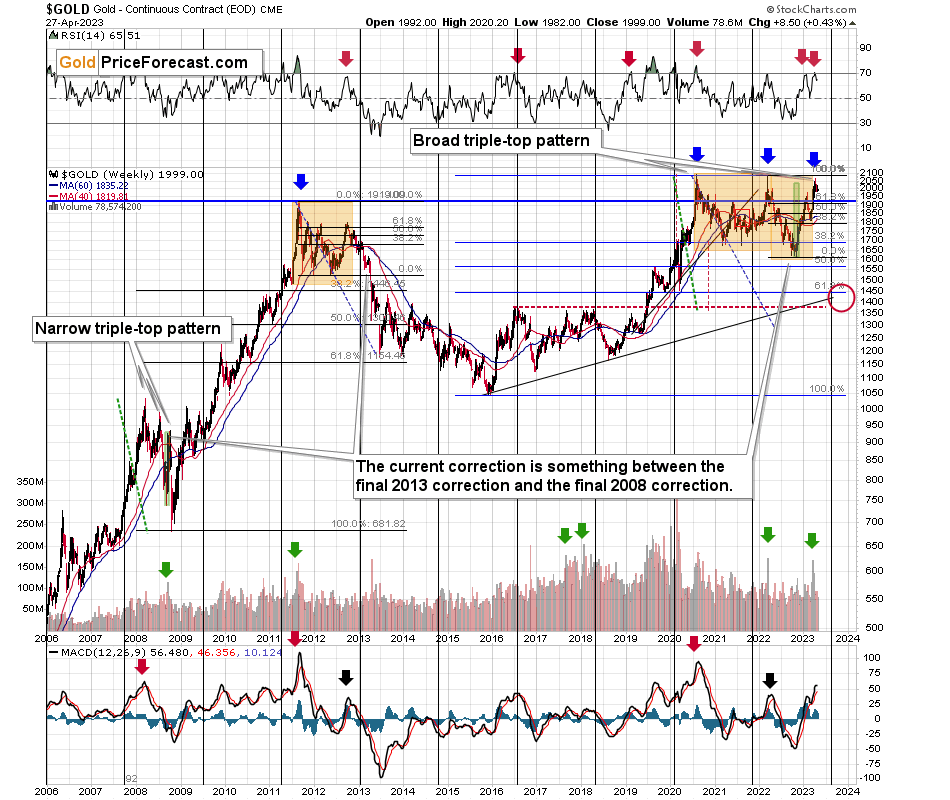
They actually can – please look at how gold started its sharpest decline of the past decades. That’s right, I mean the 2008 one.
Gold started it right after a monthly reversal! I marked the previous monthly reversal and the current one with orange arrows. The history tends to rhyme, so the implications here are very bearish.
There’s one additional thing about 2008 that I would like to emphasize here.
Namely, if you look at the size of the pre-slide corrective upswing we saw in 2008, you’ll notice that it’s practically identical to what we saw recently.
Sure, gold didn’t rally as sharply now as it did back then, but the overall size (percentage-wise) of the rallies is very similar. That’s what I marked with green rectangles.
So, yes, even though the recent rally seemed like a game-changer to many, it’s all within the self-similar pattern that ended with a massive decline.
********
 Przemyslaw Radomski, CFA, is the founder, owner and the main editor of SunshineProfits.com. You can reach Przemyslaw at: http://www.sunshineprofits.com/help/contact-us/.


