Gold Forecast And U.S. Stock Market Update


Last week's trading saw gold forming its high in early-week trading, here doing so with Tuesday's tag of the 1815.20 figure. From there, a sharp decline was seen into late-week, with the metal dropping all the way down to a Friday low of 1714.90 - before bouncing slightly off the same into the weekly close.
Gold's Readying for Another Short-Term Rally
For the near-term action, as mentioned in past weeks one of our most dominant short-term cycles was the 34-day wave, which was seen as pointing south off the late- January peak, and is the cycle that should give us the next decent swing low:
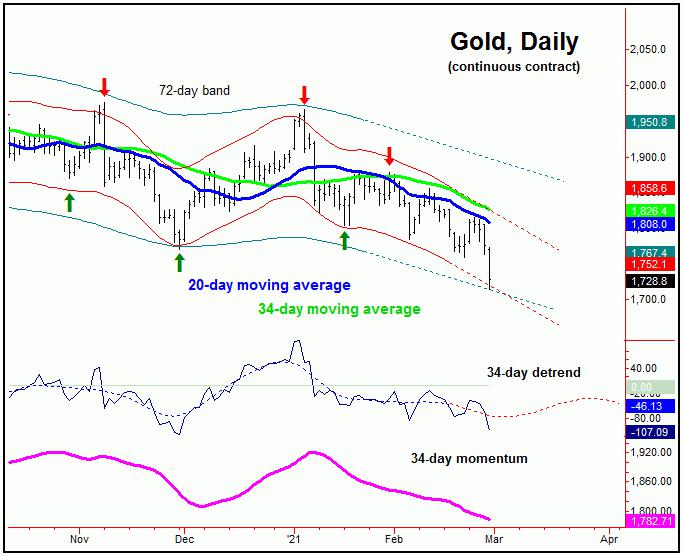
In terms of time, this 34-day component is currently 29 trading days along, and, in Friday's session, is in the early-end of its normal bottoming range. With that, the next good short-term rally should come from this cycle, with the minimum rally phase of this wave favored to take the metal back to or above its declining 34-day moving average - which is over 100 points from current price levels.
Having said the above, there is the decent potential for additional strength on through the 34-day moving average on the next upward phase of this wave, with the upper (72-day) cycle band also acting as a magnet - and as key resistance for the downward phase of the larger 310-day cycle.
Below is the table, which shows the approximate positions of some of the various cycles that we track:
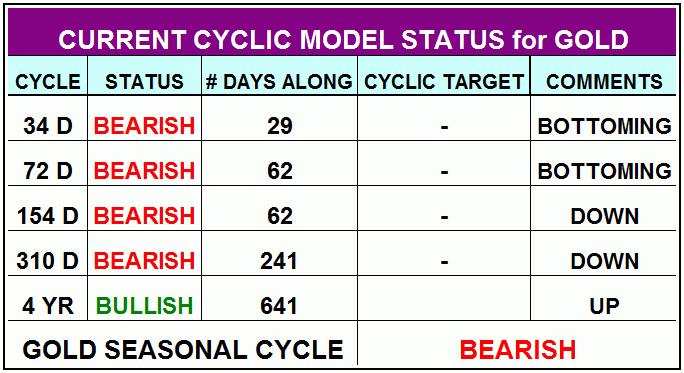
Of particular note is that most of the cycles on the table above are seen as bearish, with only the largest tracked wave - the four-year cycle - viewed as being in a bullish position. With that, the next mid-term low is expected to come from the next wave down, the 310-day component, which is projected to trough later this Spring:
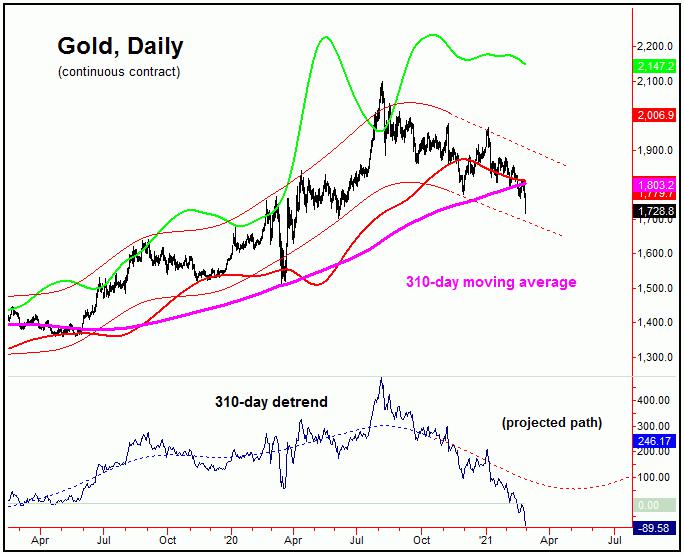
Until a lower price level materializes, gold (April, 2021 contract) would currently require a reversal back above the 1970.30 figure to confirm the next trough for our 310-day wave to be set in place, though we do expect this number to drop sharply going forward, depending on the action seen in-between.
For the bigger picture, once the next 310-day cycle trough is set in place, the largest rally of the year is expected to play out in the months to follow, with the upper 310-day cycle band acting as the magnet - though with a still-outstanding upside target from the larger four-year wave to the 2212.00 - 2340.56 region being ideal. That move should eventually form our next four-year cycle top, before turning sharply lower again into next year.
U.S. Stocks Back into Correction Territory
With the action seen in recent weeks, we have seen the SPX pushing back to a marginal new high for the larger swing up, peaking with the February 16th tag of the 3950.43 SPX CASH figure. Having said that, we noted in our daily Market Turns report (which focuses on the U.S. stock market) that a reversal below the 3883.61 SPX CASH figure would trigger in another correction phase to be back in force.
With the above said and noted, our ideal path is looking for a drop back to the 70-day moving average or lower into March, though with the potential for additional weakness through the same. Take a look at the chart below:
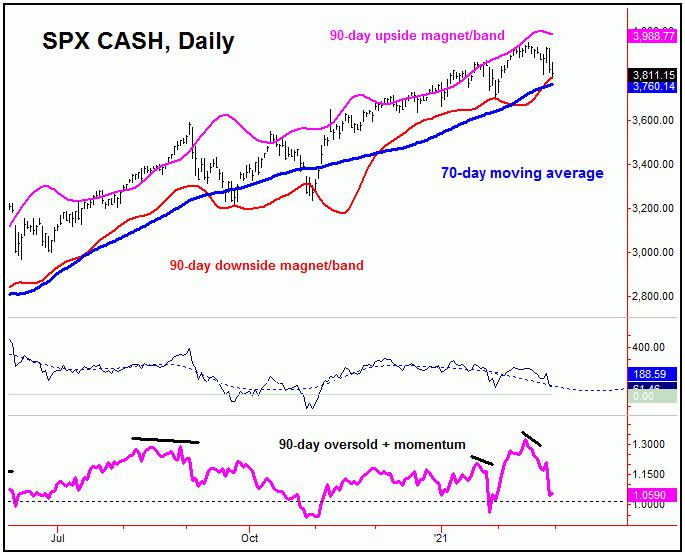
The chart above shows the 90-day cycle in U.S. stocks, which is currently averaging closer to 72 trading days from trough-to-trough. In terms of time, we were looking for a correction into the late-January timeframe, which we did see - but which fell short of our expected tag of the 70-day moving average.
Having said that, the new highs into mid-February were not confirmed by the action of technicals - such as our Mid-Term Breadth index for stocks, which is shown below:
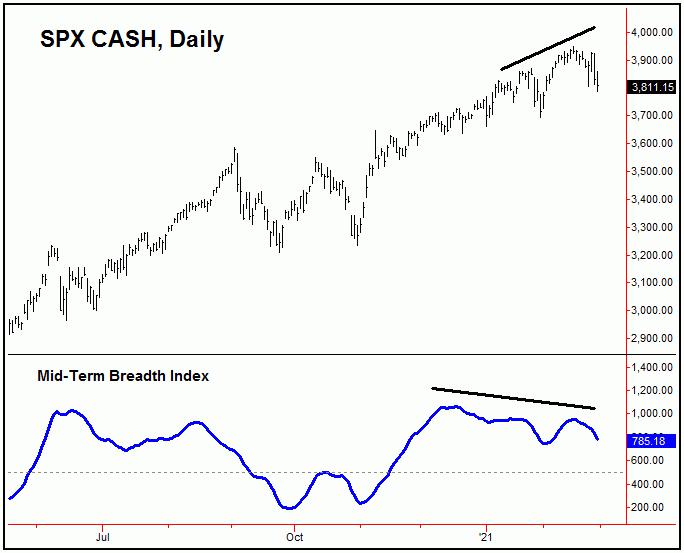
With the spike to new highs into mid-February, our Mid-Term Breadth index was still showing a divergence, and with that is viewed as a near-term bearish indication for the market. With that, a correction back to the 70-day moving average would be ideal in the coming weeks, before setting up the next corrective low.
U.S. Stocks, Bigger Picture
Even with a short-term correction phase deemed to be in force, the larger uptrend remains intact for the U.S. stock market, due to the configuration of the larger 310-day and four-year cycles, with the smaller 310-day component shown below:
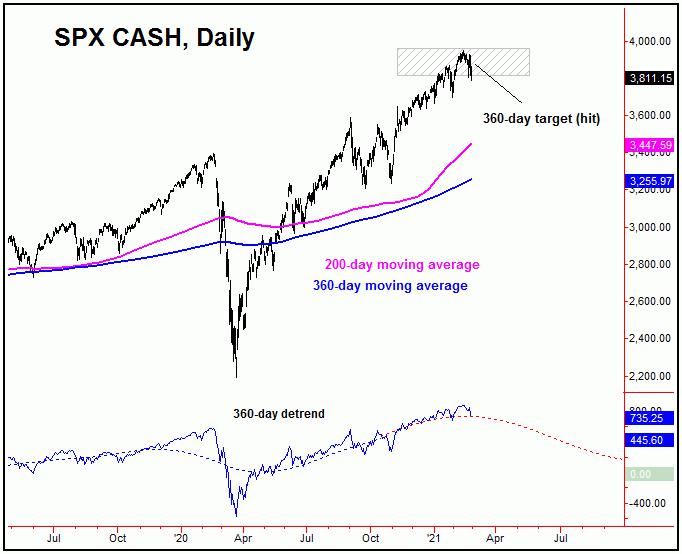
In terms of price, all the way back in the Summer of last year we confirmed an upside target with this 310-day component, which had an 85% probability of being hit before the cycle topped. This target was to the 3812.56 - 3960.44 SPX CASH region, which has obviously been met with the action seen into early this year.
Having said that, there is still more time before this wave is expected to peak, which favors the current correction phase in U.S. stocks to end up as a countertrend affair - though it could have further to run, before completing. Once finished, however, the overall assumption is that a push back to new all-time highs will be seen into the late- Spring, before a much more significant peak attempts to form. Stay tuned.
Jim Curry
The Gold Wave Trader
http://goldwavetrader.com/
http://cyclewave.homestead.com/
More from Gold-Eagle


