Gold Forecast: Gold Bottoming Short-Term


 Recapping Last week
Gold saw its high for last week made in Monday/Tuesday, here doing so with the tag of the 1815.20 figure. From there, a sharp decline was seen into late-week, with the metal dropping all the way down to a Friday low of 1726.00 - before bouncing off the same into daily/weekly close.
Gold Market, Short-Term Picture
For the very near-term, the downward phase of the 10-day cycle is still deemed to be in force, with the same now at 18 trading days along from its last labeled low - and with that is into extended territory. Here again is our 10-day cycle:
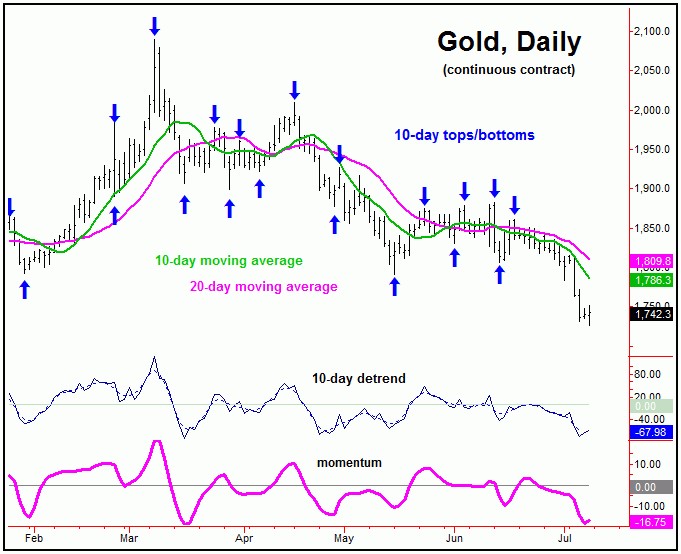
When the downward phase of one cycle moves into extended territory - which means making lower lows well past the normal average range (here, 8-12 trading days for the 10-day cycle) - we have found the very strong tendency for the next low to also mark the bottom of a cycle of 1-2 degrees higher than the one that is extending.
With the above said and noted, the cycles next up from the 10-day wave are the 20 and 34-day cycles for the Gold market. With that, the current downward phase of the 10-day cycle seems primed to bottom the larger two waves, from which a significant short-term rally could follow. The chart below shows the 34-day cycle for Gold:
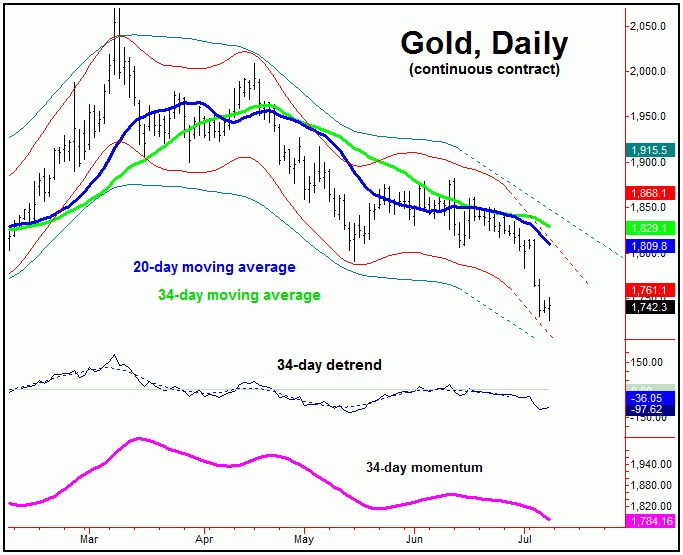
Once the next 10, 20 and 34-day combination low is in place, then, as mentioned, probabilities should favor a very nice rally in the days/weeks to follow. In terms of price, Gold has a very strong tendency (i.e., 85% odds) to revert back to a moving averages which is in line with the cycle length(s). With that, the upside potential for the next rally is back to the 20 and 34-day moving averages - with highest (34-day) average nearly 85-90 points above current price levels.
Thus, the upside potential is greater than the downside risk - at least short-term - even if the mid-term trend is to remain pointing lower into early-Autumn, which is the overall assessment. In terms of time, we have a key date of focus to mark the low for the current short-term correction, with precise details noted in our Gold Wave Trader market report.
Gold's Bigger Picture
Stepping back, as noted in recent months, the last larger rally phase came from the 72-day cycle, which bottomed out with the mid-May tag of the 1791.20 figure - and topped with the June 13th tag of the 1882.50 figure. Here again is that 72-day wave:
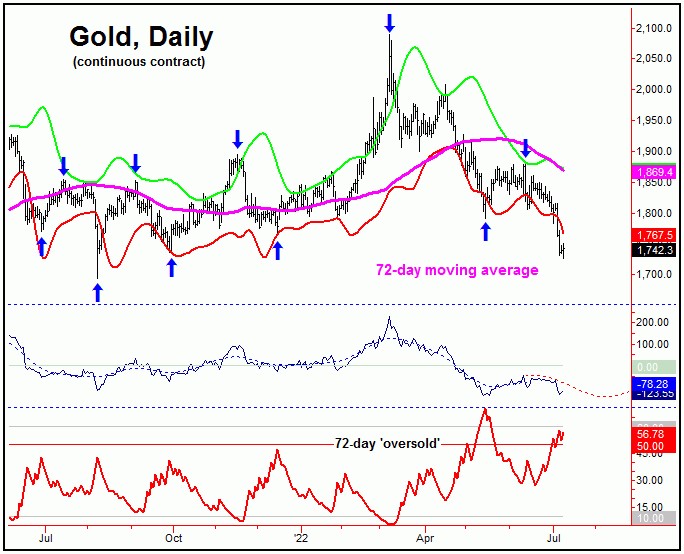
As mentioned last weekend, with the break back below the May trough of 1791.20 for Gold, our 72-day cycle had to have topped out in mid-June, and with that is heading lower into the month of August.
In terms of patterns, due to the configuration of this 72-day cycle (and the larger 310-day wave above it), the probabilities will favor the next upward phase of the smaller 10, 20 and 34-day cycles to end up as a countertrend affair - though the next rally could be very sharp, as noted earlier.
In other words, we should expect the coming rally phase with the smaller-degree cycles to hold well below the 1882.50 swing top, and with resistance to the same around 34-day moving average, plus or minus. If correct, the next short-term downward phase would be favored to take Gold back to lower lows into mid-to-late August, where the next 72-day trough is projected to form.
From a mid-to-late August bottom, the probabilities will favor another decent rally playing out into the mid-September timeframe, plus or minus, as the next upward phase of the 72-day wave unfolds.
In terms of price, that rally could see a 50-61% retracement of the larger swing down being met, before topping this wave again for a final drop into mid-to-late October, where the larger 310-day cycle is next projected to bottom-out:
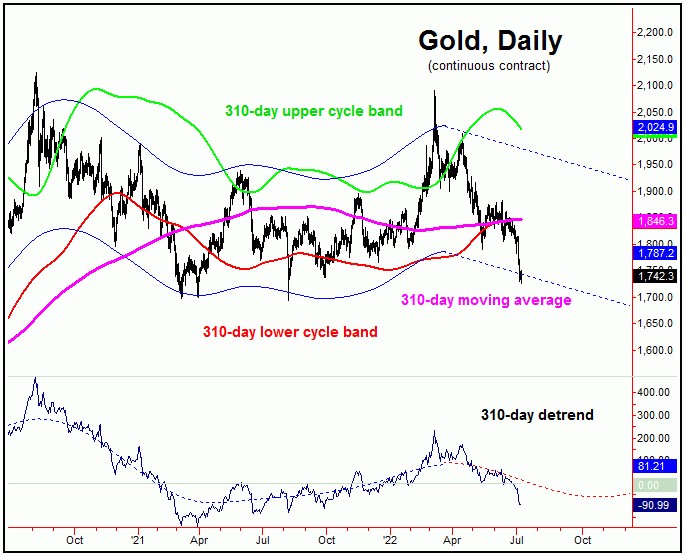
As mentioned above, a 72-day cycle bottom in August should give way to a nice (countertrend) rally into September, before turning south again into what looks to be mid-to-late October of this year. From there, the odds will start to favor a rally of some 20-25% or more off the bottom playing out in the months to follow, as the next upward phase of the 310-day cycle plays out into late-Spring of 2023.
Jim Curry
The Gold Wave Trader
http://goldwavetrader.com/
http://cyclewave.homestead.com/
********


