Gold Forecast: Gold Cycles, Conflicting Forces At Work


Last week's trading saw gold forming its high in Wednesday's session, here doing so with the tag of the 1983.80 figure. From there, a decent decline was seen into Thursday, with the metal dropping down to a bottom of 1938.20 - before bouncing off the same into the weekly close.
Gold's Short-Term, Push-Pull Action
For the mid-term picture, the larger uptrend remains intact for the gold market, and with that favors an eventual push back to new all-time highs in the coming months. In-between. However, we could be in for more push-pull action in the shorter-term, due to the configuration of the smaller-degree cycles that we track. Take a look:
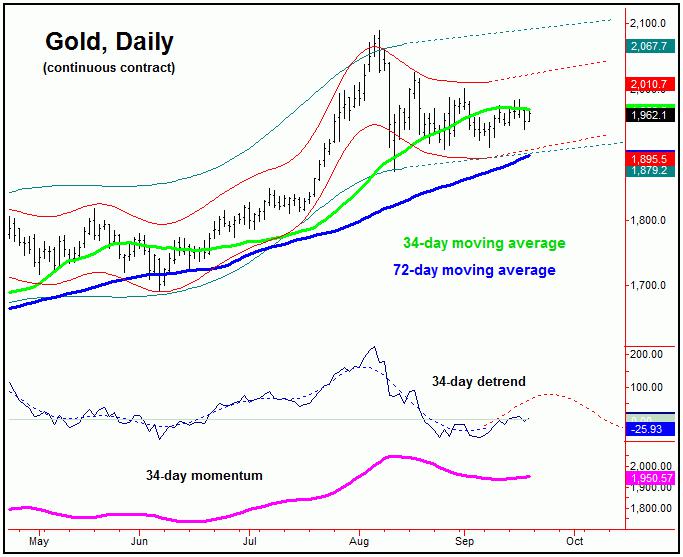
The chart above shows one of the most dominant cycles that we track, the 34-day wave. In terms of time, this cycle recently projected a low around the early-September timeframe, plus or minus, with a secondary low for this component registered back on September 8th. In recent days, the channels that track this cycle - as well as the momentum measure that tracks this wave - have begun to turn higher.
Going further with the above, the detrend that tracks this 34-day cycle has been projecting higher into the late-September region, where this wave will then turn south again into mid-October, plus or minus. Take a look at our next chart:
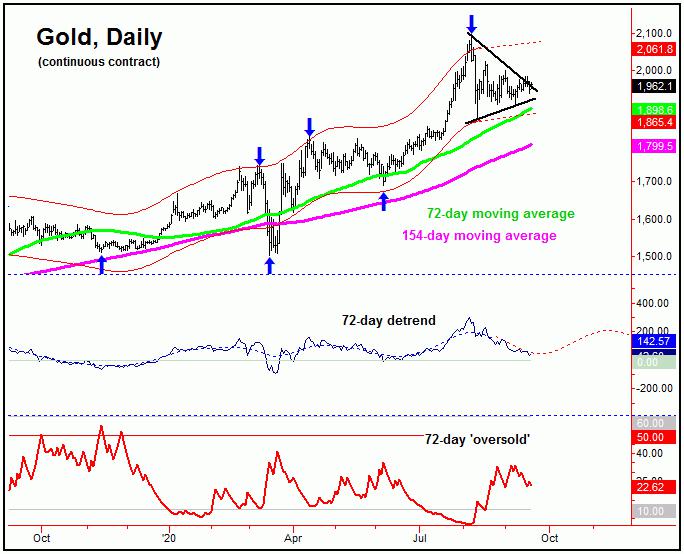
In conflict with the smaller 34-day cycle is the larger 72-day component. As mentioned in prior articles, this 72-day wave is seen as pushing down at the present time, with its low having been projected for the late-September region. Thus, we have a smaller 34-day upward phase in force - against a larger 72-day cycle downward phase - and thus the overall conflict for the gold market near-term, at least until these key cycles come back into alignment.
In terms of price with the above, while there is the short-term potential for additional chop to the upside, we would like to see a drop back to the 72-day moving average or lower in the coming days/weeks, before the next low of significance attempts to form. This is due to the fact that the 72-day cycle will revert back to a 72-day moving average approximately 85% of the time, on or before the cycle bottoms out.
The Good News
The good news for the gold bulls is that the overall correction phase that began back in August is expected to end up as a countertrend affair, due to the position of the larger-degree waves that we track. Take a look at the next chart:
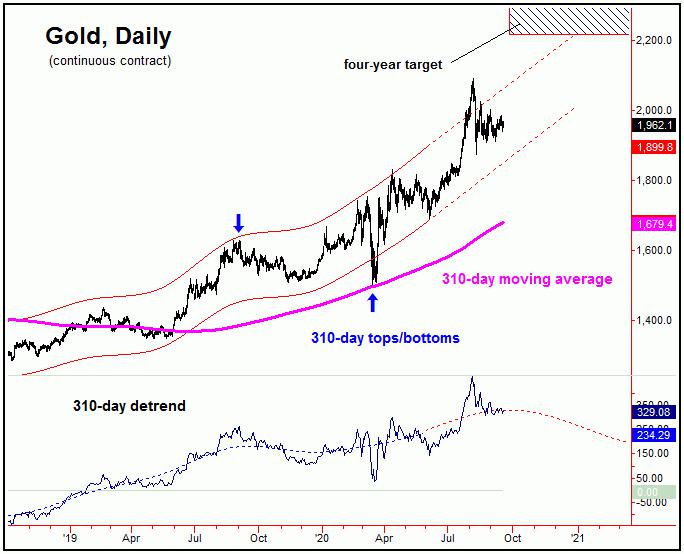
The chart above once again shows our 310-day component, which is seen as heading higher into later this year. In terms of price, as mentioned in past months, there is an open upside target for an even larger four-year wave, to the 2212.00 - 2340.56 region for gold, which we expect to be met at some point in the months ahead.
Adding to the notes above, the 'ideal' buy point going forward would be at or near the lower 310-day channel, which is currently around the 1860's and rising. In terms of Elliott-wave, Gold is currently deemed to be in a wave '4' consolidation - which is supported by the short-term cycle work. Once complete, a push to new highs for the larger swing should materialize in wave '5', ideally completing our next 310-day cycle top later this year - with the aforementioned four-year target zone in mind.
The Bottom Line
The bottom line with the above is that conflicting cycles in the gold market suggest continued choppy action in the coming weeks, though the corrective move down is expected to end up as countertrend - against the larger bullish uptrend. If correct, the metal should give way to an eventual push back to new all-time highs into later this year, where we expect the next mid-term peak to form. From there, we expect a much larger percentage decline to play out into the Spring of next year, with exact details noted in our Gold Wave Trader report. More on all as we continue to move forward.
Jim Curry
The Gold Wave Trader
http://goldwavetrader.com/
http://cyclewave.homestead.com/
More from Gold-Eagle


