Gold Forecast: Gold Cycles Pushing Higher into 2023


As mentioned in past articles, the last mid-term low for Gold was expected to come from our 72 and 310-day cycles - and was due to materialize around the mid-to-late October timeframe, but with a decent plus or minus variance in either direction. That low came and went with the tag of the 1633.10 figure back in early-November, and was confirmed by the subsequent reversal above the 1682.00 figure.
Gold, Short-Term
For the near-term picture, the downward phase of the 10 and 20-day cycles has been in force off the 1838.80 swing top, with price seeing a drop back to the 10 and 20-day moving averages - a normal expectation with these cycles. Shown below is the smaller of these two waves, the 10-day component:
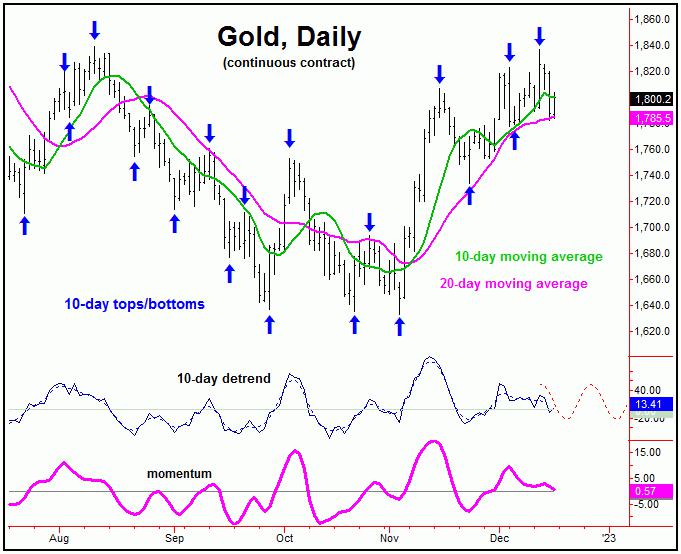
While Gold could see some additional weakness in the short-term - as the downward phase of these 10 and 20-day cycles plays itself out - the ideal path is looking for the decline to remain above the 1733.80 prior swing low from back in November. If correct, a push back to higher highs would be expected to play out into early-January, 2023 - before peaking our larger 72-day cycle (more on this in a bit).
Key support to watch in the coming days - should it be tested - is the 1760 level for Gold (February, 2023 contract) - which is also near the 38% retracement of the entire swing up from the November bottom to the 1838.10 swing top. This level (plus or minus) is near the lower 72-day cycle channel, which can be seen more clearly on our 34-day cycle chart, shown below:
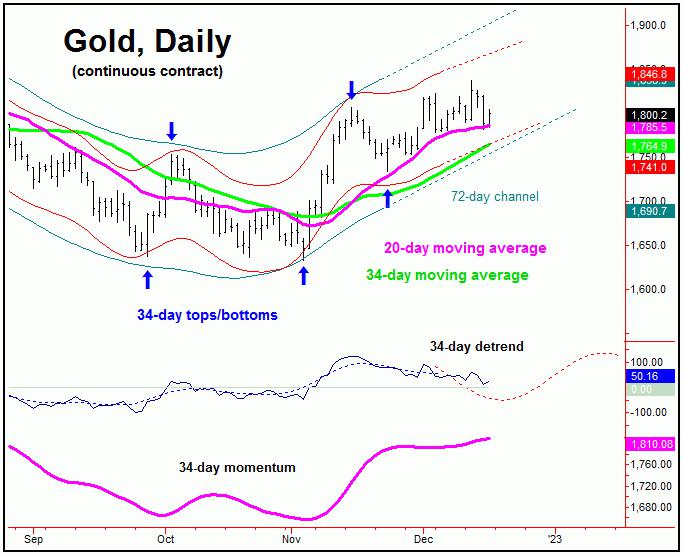
In other words, if the upward phase of our bigger 72-day cycle is going to remain in force into early next year, the in-between corrective action would need to remain above the lower 72-day channel. If correct, then the probabilities will favor a push back to higher highs into early-January, something which is also being suggested by our 34-day detrend indicator's projected path.
Mid-Term View for Gold
As mentioned in my last article back in mid-November, the upward phase of the 72-day cycle is favored to be pushing higher at the present time, most likely into early-January of 2023. Here again is that 72-day cycle component:
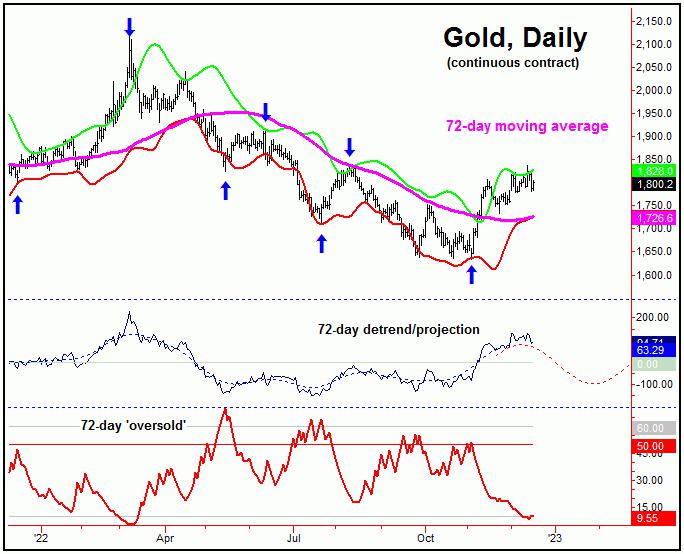
Having said the above, of particular technical note is that - with the push to higher highs for the swing into early last week - our 72-day 'oversold' indicator (which moves inversely to price action) has managed to spike back below its lower reference line - something seen closer to tops with this particular wave.
With the above said and noted, there is at least some potential that our 72-day cycle has already topped out with the 1838.10 peak from last Tuesday. However, in order to actually confirm that particular assessment, a reversal below the 1733.80 figure would be required. This number could/should continue to rise going forward, with the latest numbers always posted in our thrice-weekly Gold Wave Trader report.
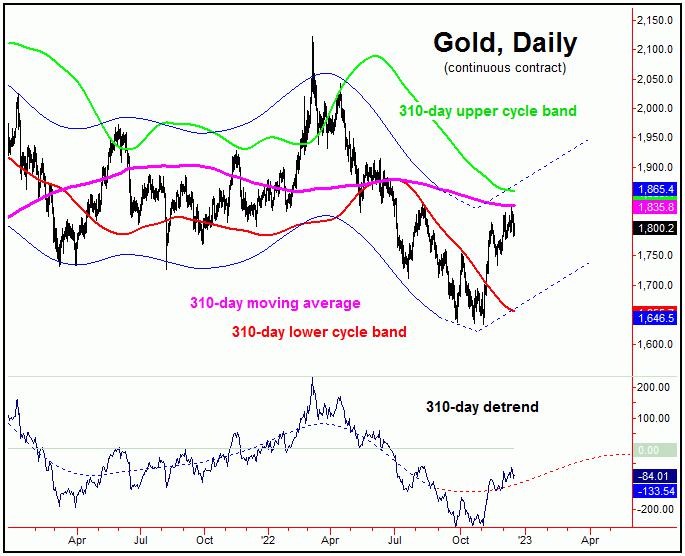
For the mid-term picture, the best 'look' would be for a higher high with the 72-day cycle into early-January, before correcting back to the 72-day moving average into late- January, where this 72-day wave is next projected to trough. That decline would be expected to end up as countertrend, giving way to higher highs on the next swing up into February - April, before topping the bigger 310-day cycle, shown below:
Bigger Picture
From the comments made in past articles, with the upward phase of the 310-day cycle deemed to be in force, the ideal path has been looking for additional strength, with the upper 310-day cycle band acting as the eventual magnet - currently around the 1860 area for Gold.
Going further with the above, the normal upward phases with this 310-day wave have seen price rallies of 20% or more off the bottom. In other words, if seen on the current rotation of this wave, then the inference would be the potential for an eventual move up to the 1950's or better before this 310-day cycle tops out.
With the above said and noted, following a correction with the smaller 72-day cycle into late-January, the ideal path favors a push back to higher highs into February - March or later, then to be on the lookout for technical signs of the next mid-term peak forming. That peak should come from our larger 310-day component, giving way to another larger-percentage decline into later next year. Stay tuned.
Jim Curry
The Gold Wave Trader
http://goldwavetrader.com/
http://cyclewave.homestead.com/
*********


