Gold Forecast: Gold & U.S. Stock Market Update


 Recapping Last week
Last week's trading saw Gold holding weaker into mid-week, here dropping down to a Wednesday low of 1830.20. From there, however, a sharp rally was seen into late-week, with the metal hitting an early-Friday high of 1878.60 - before backing off the same to end the week.
Gold's Cyclical Picture
For the short-term picture for Gold, the last smaller-degree correction came from the 10-day cycle, dropping into last Thursday's low of 1830.20 - before turning back to make higher highs for the swing into early-Friday. Here again is our 10-day wave:
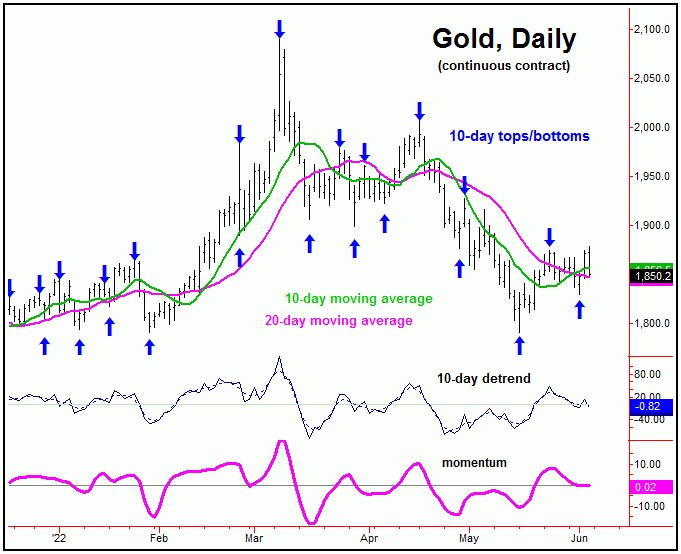
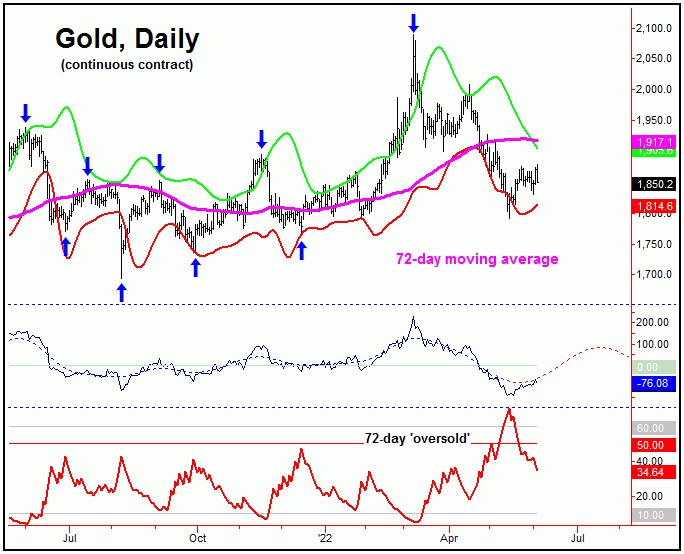
Stepping back, the bigger rally phase is coming from the 72-day cycle in Gold, which we see as heading higher in the coming weeks - then to form either a countertrend top, or else could muster a marginally higher high, above the early-March peak.
Here again is our 72-day cycle component:
In terms of patterns, the probabilities favored the recent correction phase of the 10-day wave to end up as a countertrend affair, due to the configuration of the bigger 72-day cycle. In terms of time, the overall path is looking for continued strength in the coming weeks, coming from the upward phase of this 72-day component.
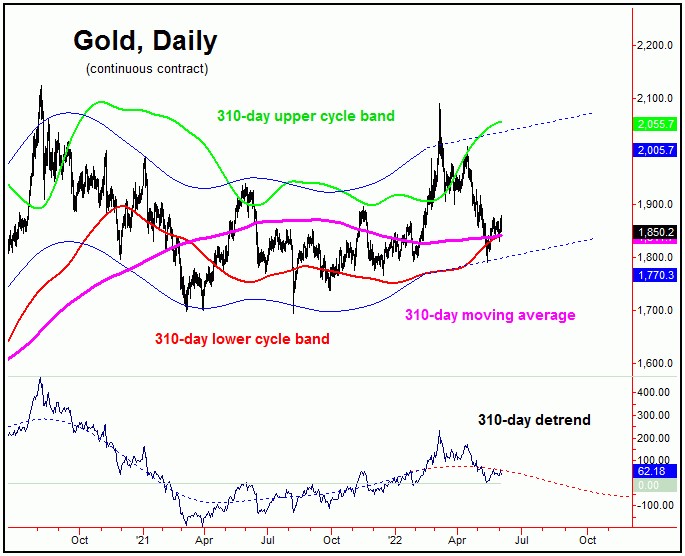
In terms of time, the overall assumption is that the upward phase of the 72-day cycle is looking for strength into the early-July timeframe or later, before turning sharply lower into late-Summer to early-Autumn, where an even-larger low will be coming due, with a bigger 310-day component:
With the above said and noted, the current upward phase of the 72-day cycle should form what now looks to be a countertrend peak in the days/weeks ahead, before turning sharply lower into the August - November timeframe.
That move down into August - November will eventually trough the larger 310-day cycle component, for what would be expected to be a much larger rally - something in the range of 25% off the lows, and lasting into the Spring of 2023 or later.
U.S. Stock Market Update
In looking at U.S. stocks - as measured by the S&P 500 index (or 'SPX') - the short-term picture is being dominated by the 45-day cycle, which is shown on the chart below:

This 45-day cycle is seen as pointing higher off a late-May price trough on the SPX. In terms of time, the average rally phases with this wave - when coming off the pattern of a ‘lower-low’ - have lasted around 25 trading days before peaking. If seen here, then the inference is that its current upward phase will hold up into mid-to-late June, before its next peak forms.
In terms of price, the 70-day moving average is looking to be an ideal upside magnet in the coming weeks, before topping this 45-day cycle in what is anticipated to be a countertrend affair. If correct, another sizeable decline will likely follow on its next downward phase, one that will either take the SPX to a marginal new low for the bigger swing - or else some hard secondary/re-test low.
Mid-Term View for U.S. Stocks
The last larger-degree peak for the SPX was the early-January peak of 4818.62, which was the last high for the combination of 180 and 360-day cycles. The smaller 180-day component is shown on the chart below:
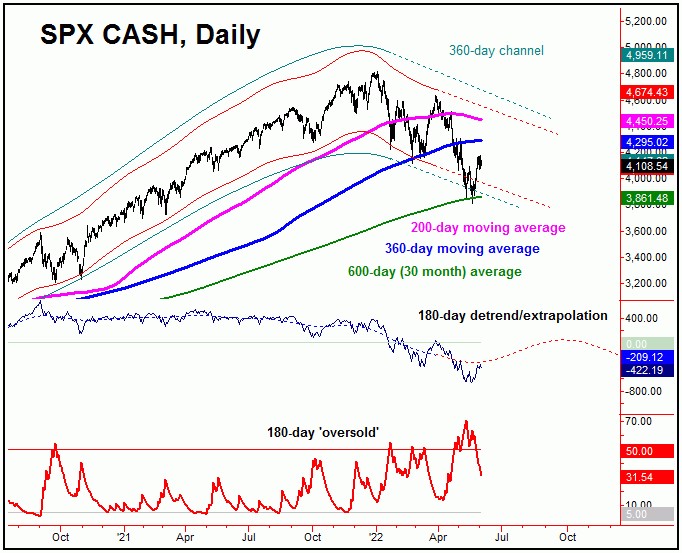
The next mid-term low for U.S. stocks is expected to come from the combination of 180 and 360-day cycles. Until proven otherwise, the overall assumption is that the current upward phase with the smaller 45-day cycle will end up as a countertrend affair, giving way to lower lows - before bottoming the larger two waves.
If the above is correct, then we will see the current swing higher holding below the late-March peak of 4637.30 SPX CASH, and with key resistance around the 70 and then 200-day moving averages. From there, a drop back to new lows would be ideal on the next swing down with the 45-day component, which - if seen - would be the odds-on favorite to trough the larger 180/360-day cycles.
The chart below shows the next larger wave, the 360-day cycle component:
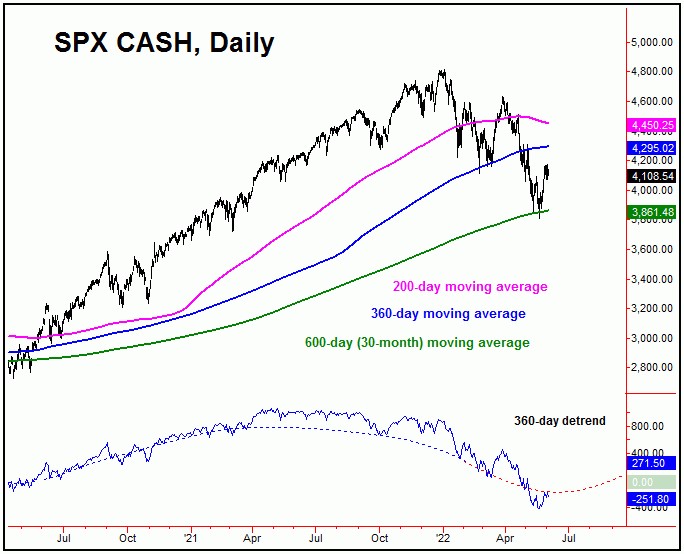
For the bigger picture, the current downward phase of the aforementioned 180 and 360-day cycles should also end up as the bottom for the 'mid-term' year pattern (inside the presidential cycle), one that has a strong history of recording major price lows for the SPX. Once the 180 and 360-day cycles do bottom out, a rally of 33-38% or more would be expected to materialize in the months to follow, ideally lasting well into next year - before an even larger-degree peak attempts to form.
Jim Curry
The Gold Wave Trader
http://goldwavetrader.com/
http://cyclewave.homestead.com/
********
More from Gold-Eagle


