Gold Forecast: Gold's Larger Upward Phase Remains Intact


Last week's trading saw gold forming its low in Tuesday's session, here doing so with the tag of the 1911.70 figure. From there, decent rally was seen into late-week, with the metal pushing all the way up to a Thursday high of 1975.20 - before backing off the same into the weekly close.
Gold, Mid-Term
As pointed out in past months, the larger-degree cycles have been seen as pointing higher into later this year, before forming the next mid-term price peak. The largest cycle that we track is the four-year wave, which is shown again on the chart below:
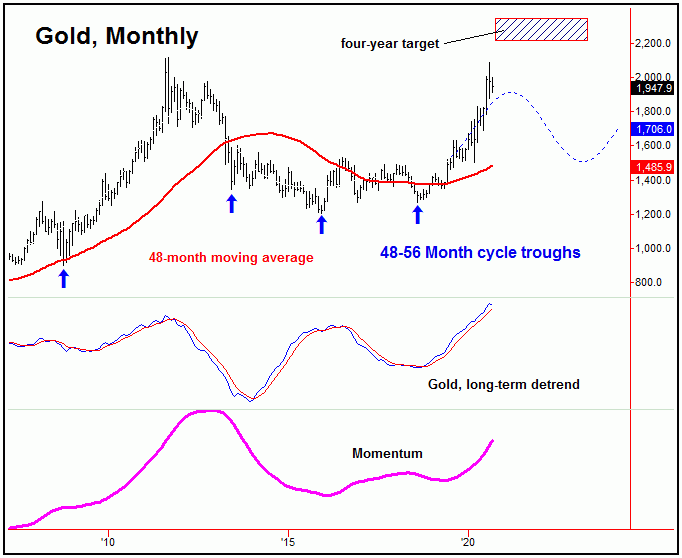
In terms of time, the upward phase of our larger four-year wave is projected to remain intact into next year. As mentioned in prior articles, in bullishly-trending markets price will normally peak on or well past the detrend's projected path. If correct, then the current upward phase of this four-year cycle won't top prior to the Spring of next year - though it seems more likely to be held off into the late-2021 timeframe.
In terms of price, as mentioned in past months, there is an open upside target for this four-year wave to the 2212.00 - 2340.56 region, which we expect to be hit in the coming months - likely into later this year. Our four-year target zone should ideally be met with the upward phase of the smaller 310-day cycle, which is shown below:
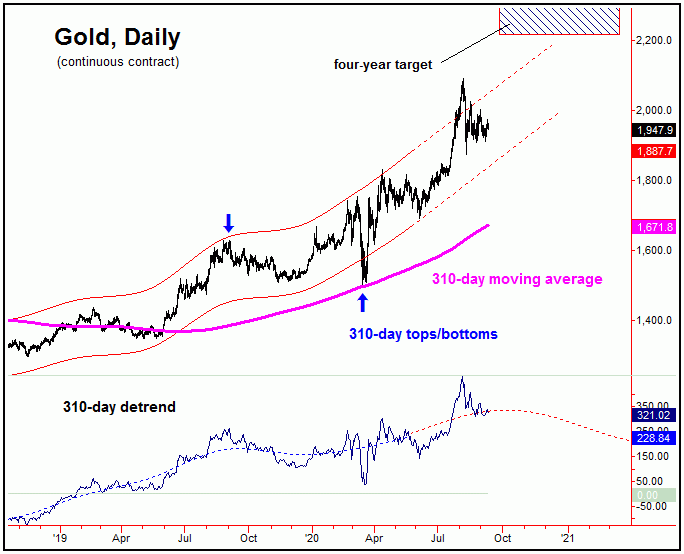
As noted, the upward phase of the smaller 310-day cycle is expected to remain intact into at least the Autumn of this year. In order to keep this upward phase intact, gold should remain above lower (and extrapolated) channel support, which we can see is currently around the 1850 level - but which is also rising daily.
Even with the mid-term upward phase still deemed to be in force, a series of smaller-degree corrections was expected to play out in-between, the first of which has been in progress off the 2089.20 swing top. This correction has come from the 34 and 72-day cycles, with the larger 72-day wave shown below:
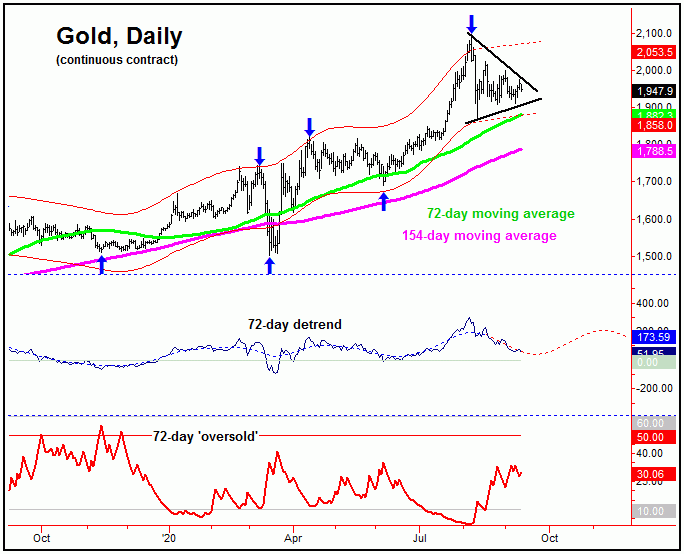
On the chart above, our 72-day detrend is projecting lower, and with that there is the potential for additional weakness into later this month. Should our 72-day 'oversold' indicator manage to spike above its upper reference line at any point in the coming weeks, it would be viewed as a buy signal - in the anticipation of an eventual spike up to our open four-year target zone of 2212.00 - 2340.56 in the weeks/months to follow.
In terms of patterns, gold is currently locked inside a triangle consolidation, which is normally seen during an Elliott wave '4'. If correct, the next move up with the 72-day cycle should take the metal sharply higher in wave '5' of the pattern - one which should eventually complete our next mid-term top, coming from the aforementioned 310-day cycle. From that high, we expect a fairly sharp, multi-month correction to play out into the Spring of 2021, with more precise details noted in our Gold Wave Trader market report.
U.S. Stock Market Update
With the selling seen since early-September, the downward phase of our 45-day cycle is seen as in firm force. Back in August we noted that the next decent correction phase would come from this cycle, which is shown on the chart below:
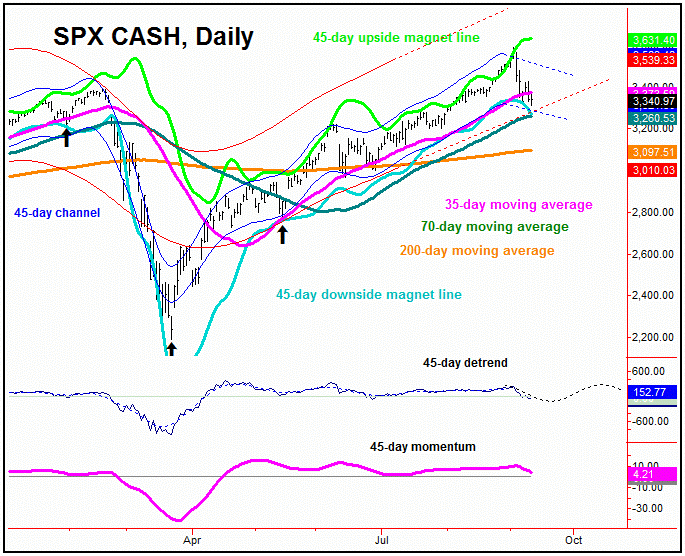
In terms of time, the upward phase of this 45-day cycle was well into extended territory back in early-September, with its peak later confirmed to be set in place at the 3588.11 swing top. In terms of time, this wave is next projected to trough later this month, a move which is expected to end up as countertrend - against the upward phasing of the larger-degree 360-day cycle, which is shown on the next chart:
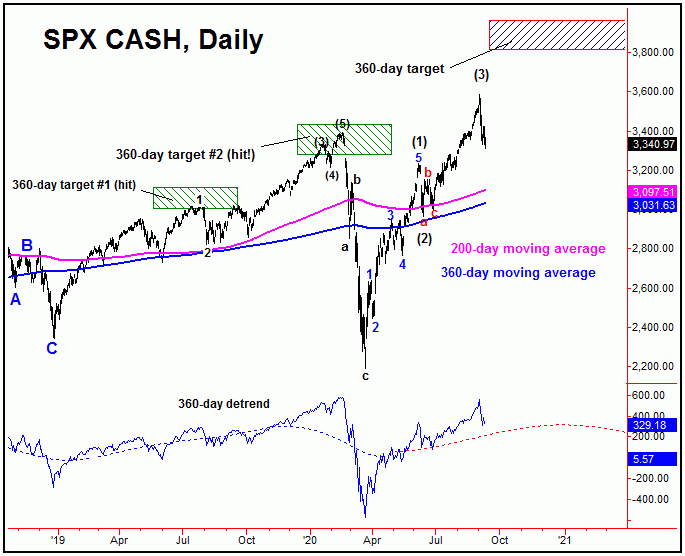
In terms of time, our 360-day wave is projected higher into at least the late-2020 timeframe, though is more likely to remain in force well into the Spring/Summer of next year. In terms of price, there is an open upside target from this 360-day component to the 3812.56 - 3960.44 SPX CASH region, a target that has an 85% probability of being met going forward.
With the above said and noted, we expect the current correction phase of the smaller 45-day cycle to end up as a countertrend affair, and with that should give way to higher highs on the next swing up into later this year - before working on the next peak of significance.
Market Sentiment
Though we keep track of several market breadth and momentum indicators, one key indicator that we also follow is our sentiment index in U.S. stocks, which we began publishing back in 2012 - and which is shown on the chart below:
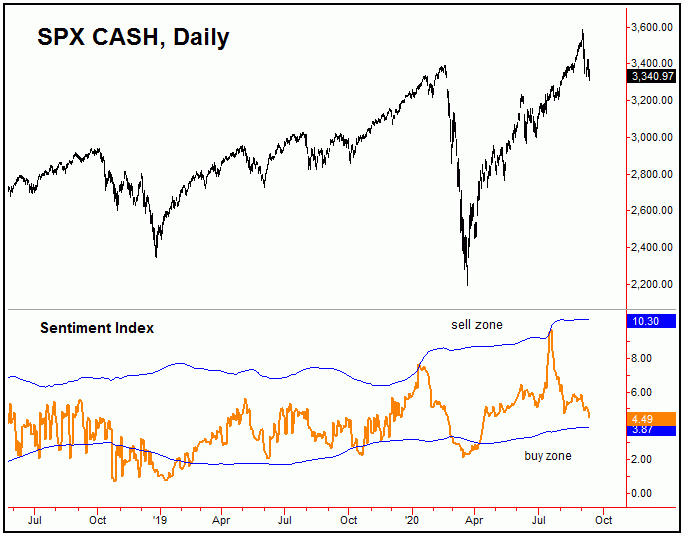
In looking at the above chart, moves above the upper band are sell signals, while moves below the lower band are buy signals. Though the signals tend to be on the early side, simply buying below the lower band and selling above the upper band has decisively beaten the market since inception, and is up over 18.8% for the current year (in 3 signals) - vs. a net gain of around 3.4% for the SPX as a whole.
Having said the above, of particular note this weekend is that our sentiment index - which is posted in our Weekly Market Turns report (and which covers U.S. stocks) - is inching its way down towards its lower 'buy' zone - and with that is supportive of the idea of a countertrend correction in force. In other words, the implication is that any additional downside with price is likely to move our sentiment index back into its lower buy zone - and with that is something we will obviously want to keep a close eye on in the days/weeks ahead, should it materialize.
The Bottom Line
The overall bottom line is that the recent correction phase in both gold and U.S. stocks is seen as being a countertrend affair, inside larger uptrends. If correct, gold is favored to see the next good upward phase pushing up to the low-end 2200's or better, with the SPX ideally looking for a test of the 3800's in the coming months. On or after these figures are reached, we will need to be on the lookout for hard technical evidence of mid-term tops with each of the gold and the U.S. stock markets. Stay tuned.
Jim Curry
The Gold Wave Trader
http://goldwavetrader.com/
http://cyclewave.homestead.com/
More from Gold-Eagle


