Gold Forecast: Technical Alarm Bells Ringing for Gold?


 From the comments made in past articles, the last key low for Gold came back in late- February, which was in the range for our expected bottom with the 72-day time cycle. In terms of patterns, the decline into that trough was expected to form the pattern of a 'higher-low' - against the November, 2022 bottom.
Here again is our 72-day time cycle for Gold:
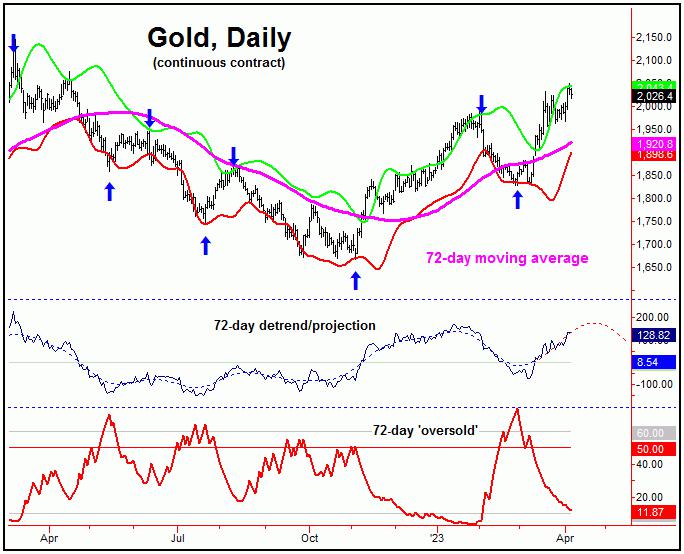
In terms of price, it was the 3/10/23 reversal back above the 1866.00 figure which best confirmed our 72-day cycle trough - with the overall assessment looking for higher highs into this Spring, some of which we have obviously seen. Having said that, there was the potential for additional follow-through above the prior peak.
From my 3/26/23 article: "the average rally phases with our 72-day cycle - when coming off a 'higher-low' - have been around 14% off the bottom, thus suggesting the potential for an eventual push up to the 2060's or better before this wave next tops."
As mentioned, the average rallies with our 72-day cycle - when coming off a 'higher-low' - have, historically, been in the range of 14% off the bottom, which suggested the potential for a push up to the 2060's or better before peaking this wave.
Going further, the 2060 figure was actually based on the April, 2023 contract - and we have now moved to the June, 2023 contract for our numbers. With that, in taking the 1827 (June, 2023 contract) bottom from late-February, there is the potential for a spike up to the 2080's before this 72-day wave tops out.
Technical Alarm Bells
As per the title of this article, there are some technical issues with the current rally. The first of these comes from our Gold Timing Index, which is a combination sentiment and momentum measure for the Gold market, and is shown on the chart below:
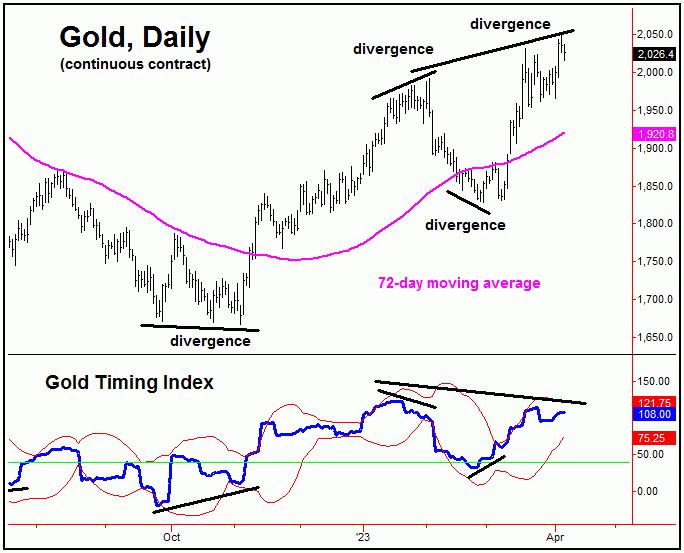
As pointed out in some prior articles, the Gold Timing Index is a key timing indicator for our work; more especially, when it registers a divergence against a lower low (or a higher high) for the bigger swing. This indicator registered a divergence prior to the November, 2022 low for Gold - which gave way to the 20%+ rally that we have seen since that bottom.
Going further with the above, in January of this year, our Gold Timing Index also alerted us to a 72-day cycle top that was forming, which obviously gave way to the decline seen into the late-February low.
With the recent push to a higher price high, of note is that our Gold Timing Index is still showing a minor divergence from price - which is seen at least a mild technical negative. However, this indicator could negate this divergence in the coming days, by rising to a new high for the swing; we will obviously see.
The Dollar's Falling Wedge
In looking at other technical indications, of key secondary note is the 'falling wedge' pattern seen in the U.S. dollar index, which is shown on the chart below:
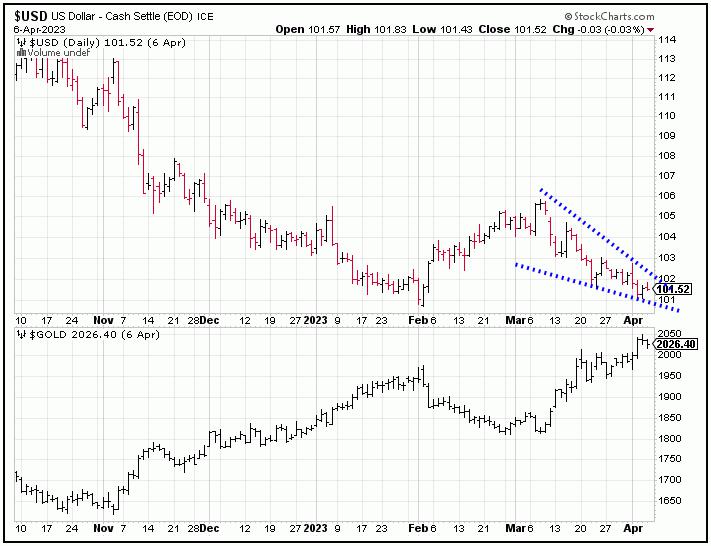
In terms of patterns, 'falling wedges' are bullish patterns - and are usually followed by a break to the upside. Going further, since we know that the dollar and Gold have a strong inverse correlation, a break to the upside in the Dollar's falling wedge would likely put pressure on the Gold market, and is something to watch for in the days ahead, should this wedge/breakout materialize.
Mid-Term View
For the mid-term picture, our larger 310-day cycle last bottomed back in November of 2022, and with that - once confirmed - was projected higher into this Spring. In terms of price, the comments made in prior articles late last year suggested an eventual rally of 20% off the bottom - which is the average statistical rally with this wave. This action has obviously been met into the recent swing high.
Here again is our 310-day cycle component:
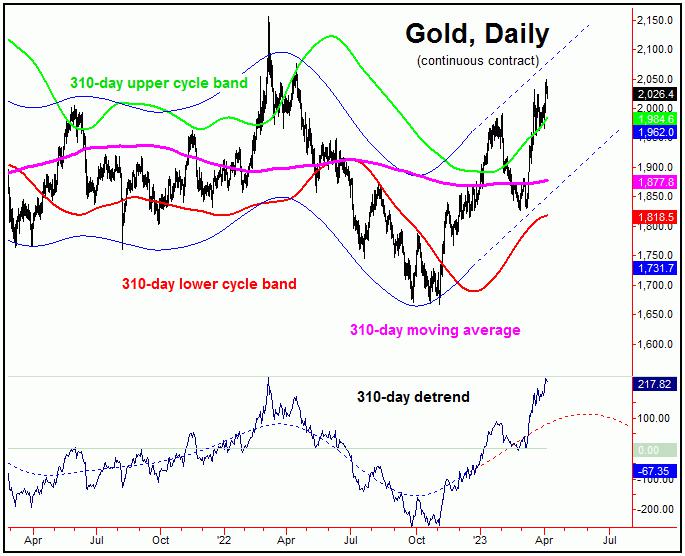
With the above said and noted, our next mid-term peak should come from the combination of 72 and 310-day cycles, which can actually form at anytime - though the preferred path would be for it to come from higher numbers than already seen.
Stepping back, from whatever high that is seen with the 310-day wave, the odds will favor the largest percentage decline of this year to play out in the months to follow - a decline which could be something in the range of 20% or more - before bottoming this cycle once again, for another sharp rally into next year.
Adding to the notes above, the 310-day moving average will provide the minimum magnet to the next downward phase of this 310-day cycle, with the lower 310-day cycle band (currently 1818 and rising) also acting as an attractor.
With the above said and noted, we will be looking for additional technical evidence of the next mid-term peak forming for the Gold market, several of which have been mentioned in this article - with the most up-to-date information always posted in our Gold Wave Trader report.
Jim Curry
The Gold Wave Trader
http://goldwavetrader.com/
http://cyclewave.homestead.com/
********
More from Gold-Eagle


