Gold Forecast: Terminal Point to Current Decline
 share
share
 share
share
 share
share
 share
share
 share
share
 Since my last article posted back in late-May, Gold has seen an in-between bounce - which has given way to the expected lower lows for the bigger swing down. With that action, we are now in the range for the next key bottom to form.
Gold's Medium-Term View
For the mid-term picture, the 72 and 310-day cycles are still deemed to be pointing south, though with the smaller 72-day wave looking for the next key (in-between) bottom. Here again is that 72-day component:
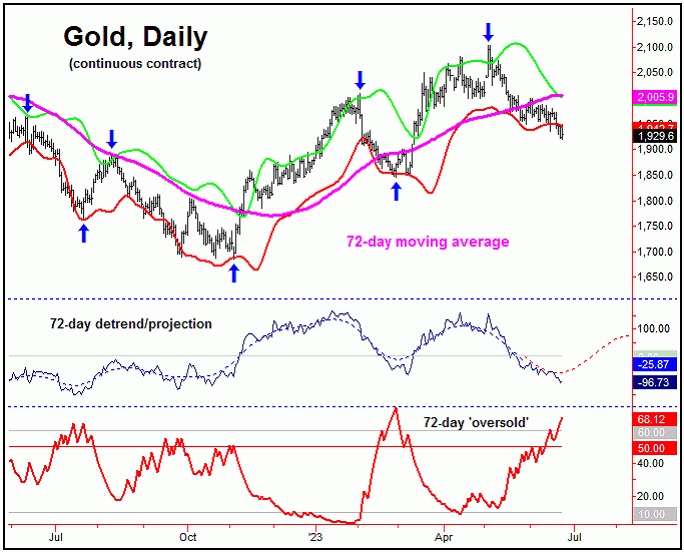
From my May 24th article: "In terms of price, our downside 'reversal point' was broken below, thus triggering in the downward phase of this 72-day cycle - as well as the larger 310-day component. With that, the smaller 72-day wave is pushing south into the mid-June timeframe, plus or minus, where it should bottom out - for the next multi-week rally phase."
As mentioned back in May, our downside 'reversal point' for this 72-day wave had been taken out, thus triggering in its most recent downward phase. Going further, our detrend analysis with this wave suggested that it would be headed lower into mid-June or later, where its next low should try to form.
Adding to the notes above, our 72-day 'oversold' indicator (lowest pane, in red) has recent spiked above its upper reference line, which is something we would expect to see on or before this wave bottoms out. With that, we have at least one technical suggestion that this wave is trying to trough.
Gold, Short-Term
As mentioned back in my May 24th article, even though the 72-day wave was deemed to be pointing lower into mid-June, Gold was at or nearing a smaller-degree low - coming from our 20-day cycle, which is shown below:
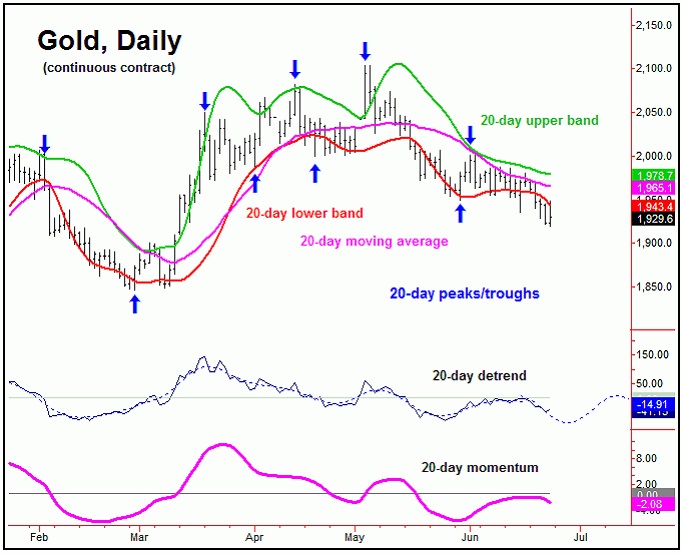
From my May 24th article: "following my rule that a cycle will normally (i.e., 85% of the time) revert back to a moving average of the same length, the potential upside is back to the 20-day moving average, and/or the upper 20-day cycle band - each around the low-end 2000's for Gold. In other words, the potential upside for the near-term is back to the 20-day moving average or better, though - due to the position of the larger 72-day component - that rally would be favored to end up as a countertrend affair."
Gold did manage an in-between rally with our 20-day cycle, with the metal spiking back up to a high of 2000.50 (August, 2023 contract). Due to the position of our larger 72-day wave, however, that move was expected to end up as a countertrend affair - before giving way to lower lows into mid-June.
With the above said and noted, our 20-day detrend is projecting a low to form with this wave in the coming days, which seems favored to end up as the bottom for our larger 72-day cycle. Once that rally is complete, a decent rally is expected to play out into July, but a move which is favored to end up as another countertrend affair - holding below the 2104.00 swing top (the last 72-day top).
Technical Problems
Even with the 20 and 72-day cycles into bottoming territory, there is a glaring technical issue at the present time. That comes from our Gold Timing Index, which is shown on the following chart:
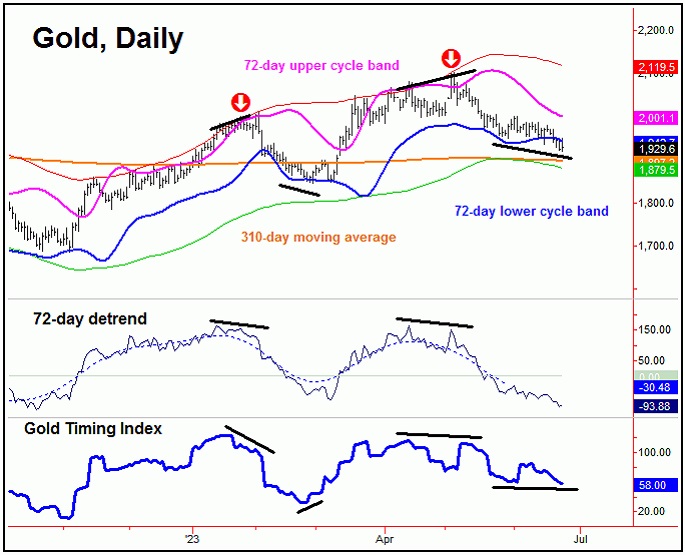
The technical negative is that our Gold Timing Index has recently dropped to lower lows - along with price action. In other words, the best long signals will come, when this indicator is holding a divergence against price, where price makes a lower low for the swing, but the indicator fails to drop to lower lows.
Even with the above, our Gold Timing Index does not have to show a divergence at a 72-day cycle; it simply is seen as supportive of a key low forming.

Just as important going forward is whether the metal will be able to take out our next upside 'reversal point'. With that, we are now awaiting confirmation of 72-day low having formed - by taking out a key price figure to the upside - with the exact details always posted in our thrice-weekly Gold Wave Trader report.
Jim Curry
The Gold Wave Trader
http://goldwavetrader.com/
http://cyclewave.homestead.com/
********
share
share
share
share
share


