Gold Forecast – When Gold Breaks Above $2000, it May Never Look Back


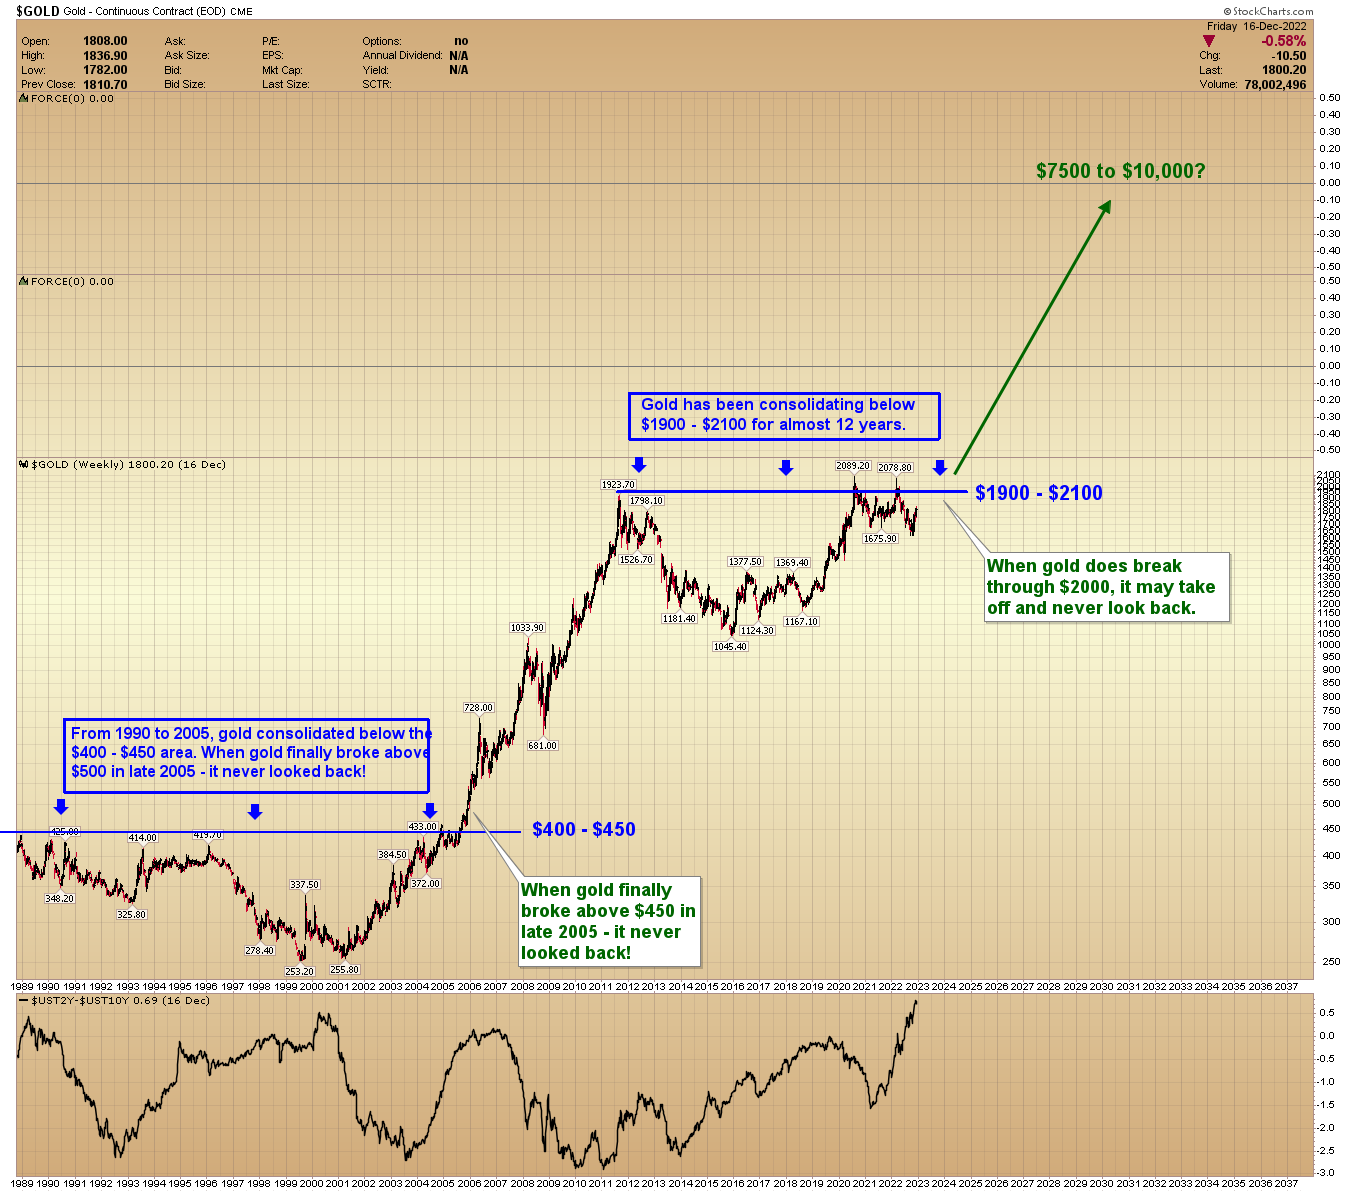
 When gold broke above $450 in 2005, prices never looked back. I see a similar outcome as possible when gold prices break above $2000, once and for all.
Before we get into the charts, let’s take a quick look at interest rates and macro.
- January inflation came in above expectations suggesting the Fed may have to hike further.
- The repricing of short-term interest rates is putting temporary downward pressure on gold.
- Gold could trade sideways to lower for a few weeks as interest rates adjust.
- The next rally in gold could break above the $2000 level.
Consumer Price Index
The CPI for January increased by 0.5% versus the anticipated 0.4%, printing an annual rate of 6.4%. Inflation is headed in the right direction, just slower than the Fed wants.
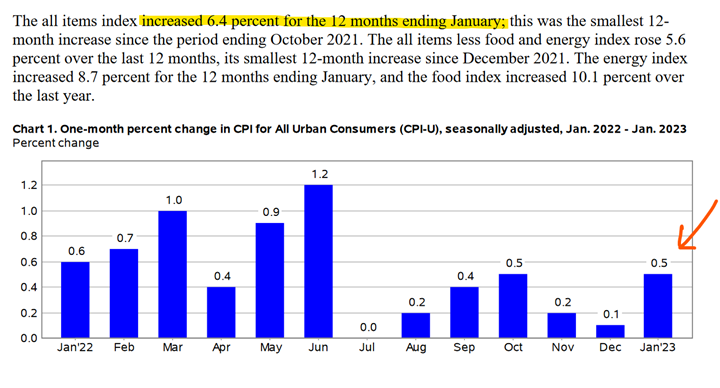
Source: https://www.bls.gov/news.release/pdf/cpi.pdf
Fed Watch Tool
The recent inflation surprise is pushing short-term rates higher. Now the market is forecasting a 48.6% chance Fed funds will reach 5.25% to 5.50% by June. A month ago, those odds were just 6.2%.
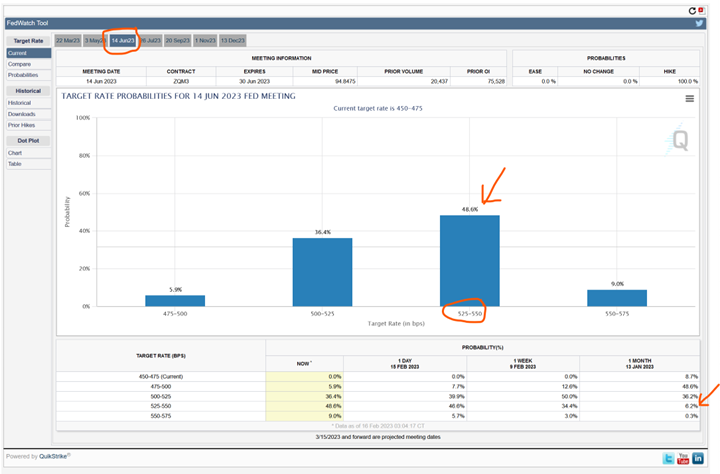
Source: https://www.cmegroup.com/markets/interest-rates/cme-fedwatch-tool.html?r...
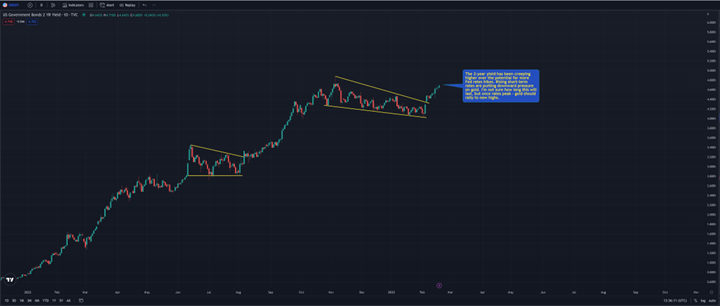
2-Year Treasury Yield
The 2-year yield has been creeping higher over the potential for more Fed rate hikes. Rising short-term rates are putting downward pressure on gold. I'm not sure how long this will last, but gold should rally to new highs once rates peak.
Gold Forecast
I expect gold to trend with an upward bias in 2023, but I see the potential for a multi-month pullback once we enter recession.
I'm still looking for a sustained breakout in gold above $2000 within the next 12 months; I'm not sure if it will come in the first or second half.
When gold does break officially above $2000, it might do so with such force that it could leave the $2000 area in the dust.
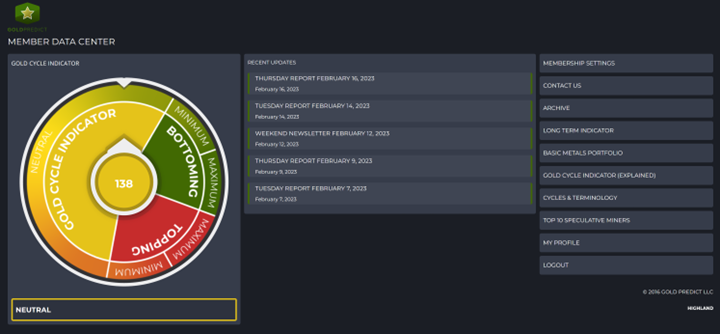
Our Gold Cycle Indicator is at 138 and could dip back into the bottoming zone.
GOLD WEEKLY CHART: From 1990 to 2005, gold consolidated below the $400 - $450 area. When gold finally broke above $450 in late 2005 - it never looked back!
Current Setup: Gold has been consolidating below $2000 for almost 12 years. It's possible that when gold does break through $2000, it could take off and never look back.
Disclaimer: I own gold, silver, and miners, and I'm very bullish.
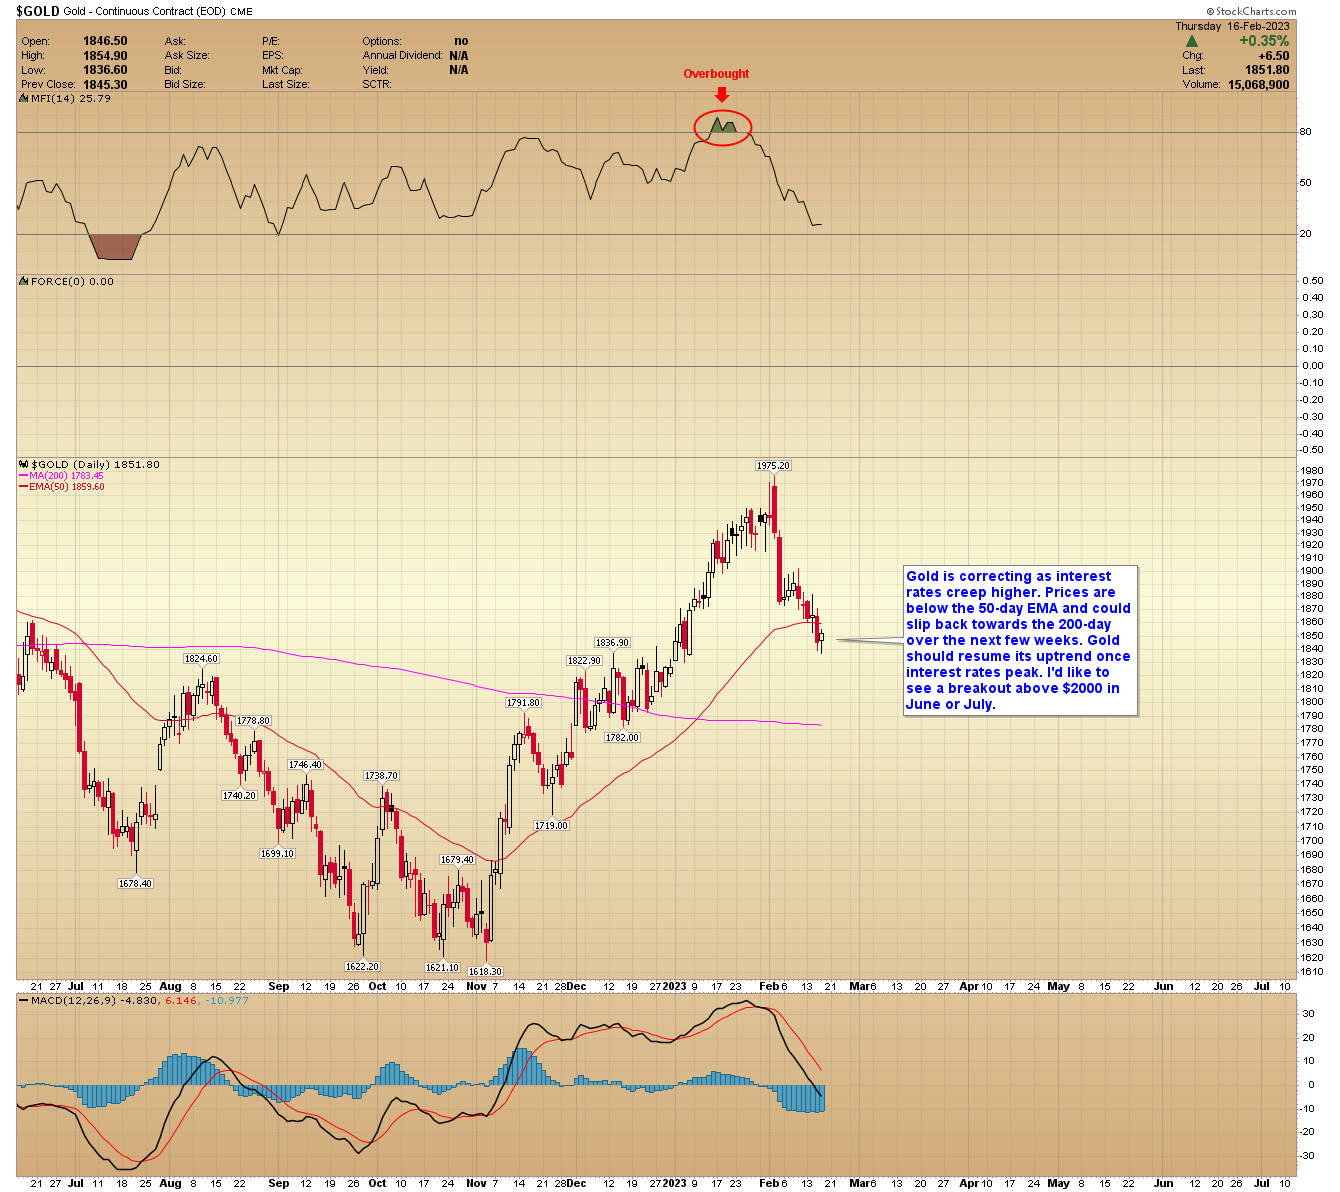
GOLD DAILY CHART: Gold is correcting as interest rates creep higher. Prices are below the 50-day EMA and could slip back towards the 200-day over the next few weeks. Gold should resume its uptrend once interest rates peak. I'd like to see a breakout above $2000 in June or July.
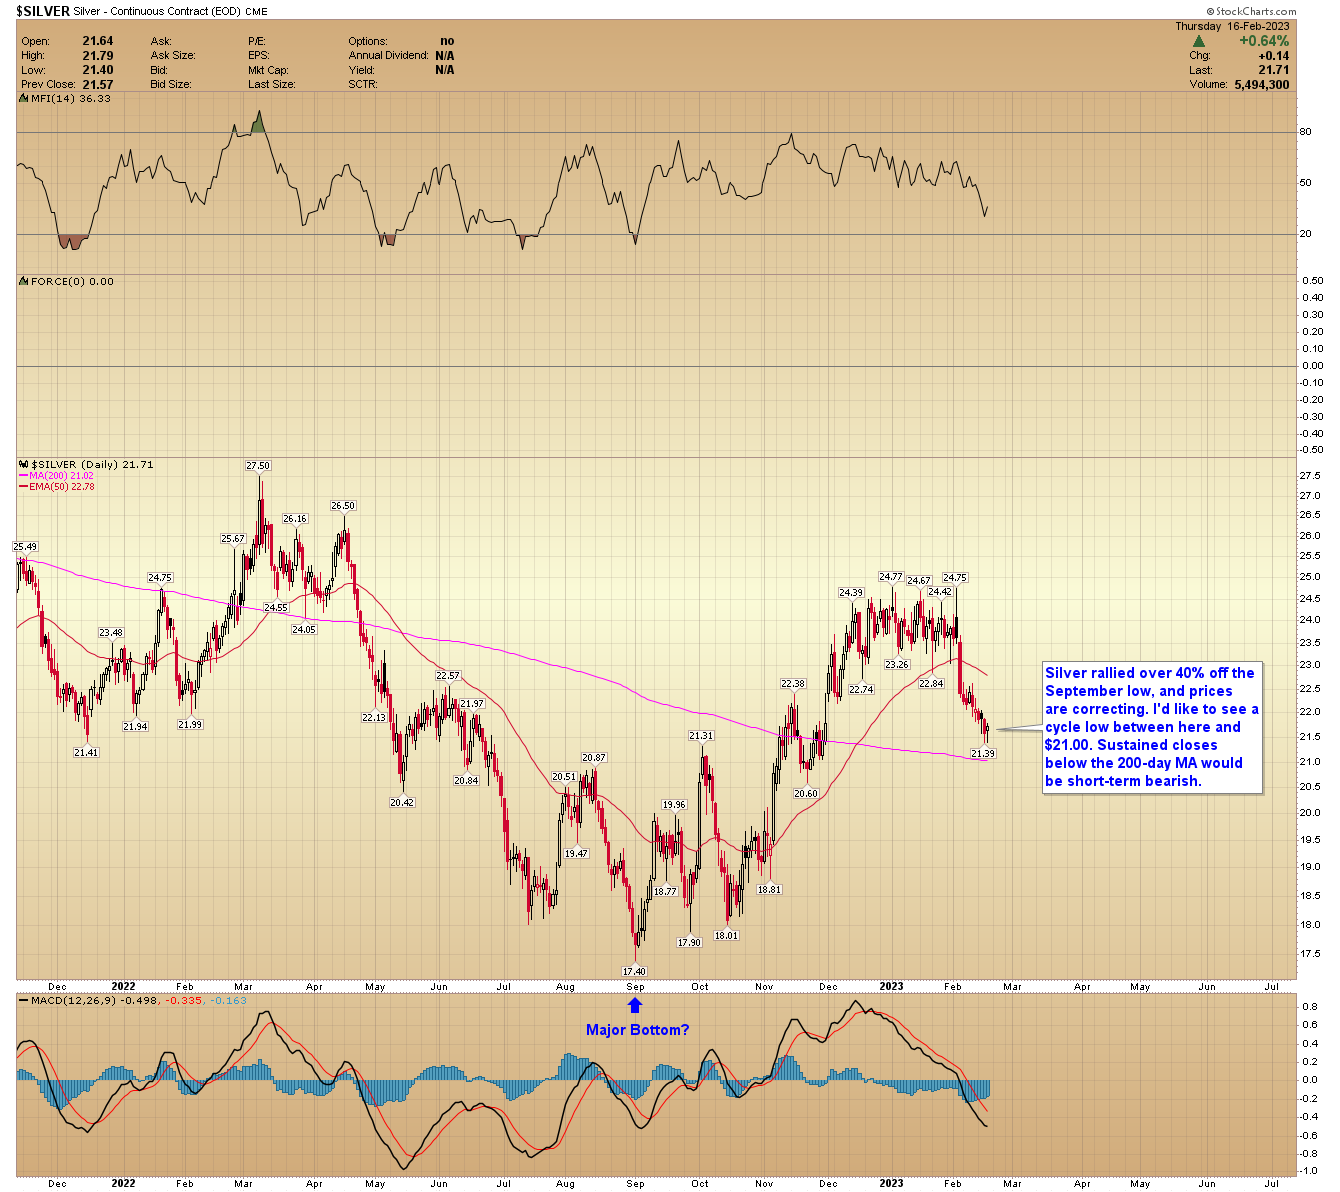
SILVER DAILY CHART: Silver rallied over 40% off the September low, and prices are correcting. I'd like to see a cycle low between here and $21.00. Sustained closes below the 200-day MA would be short-term bearish.
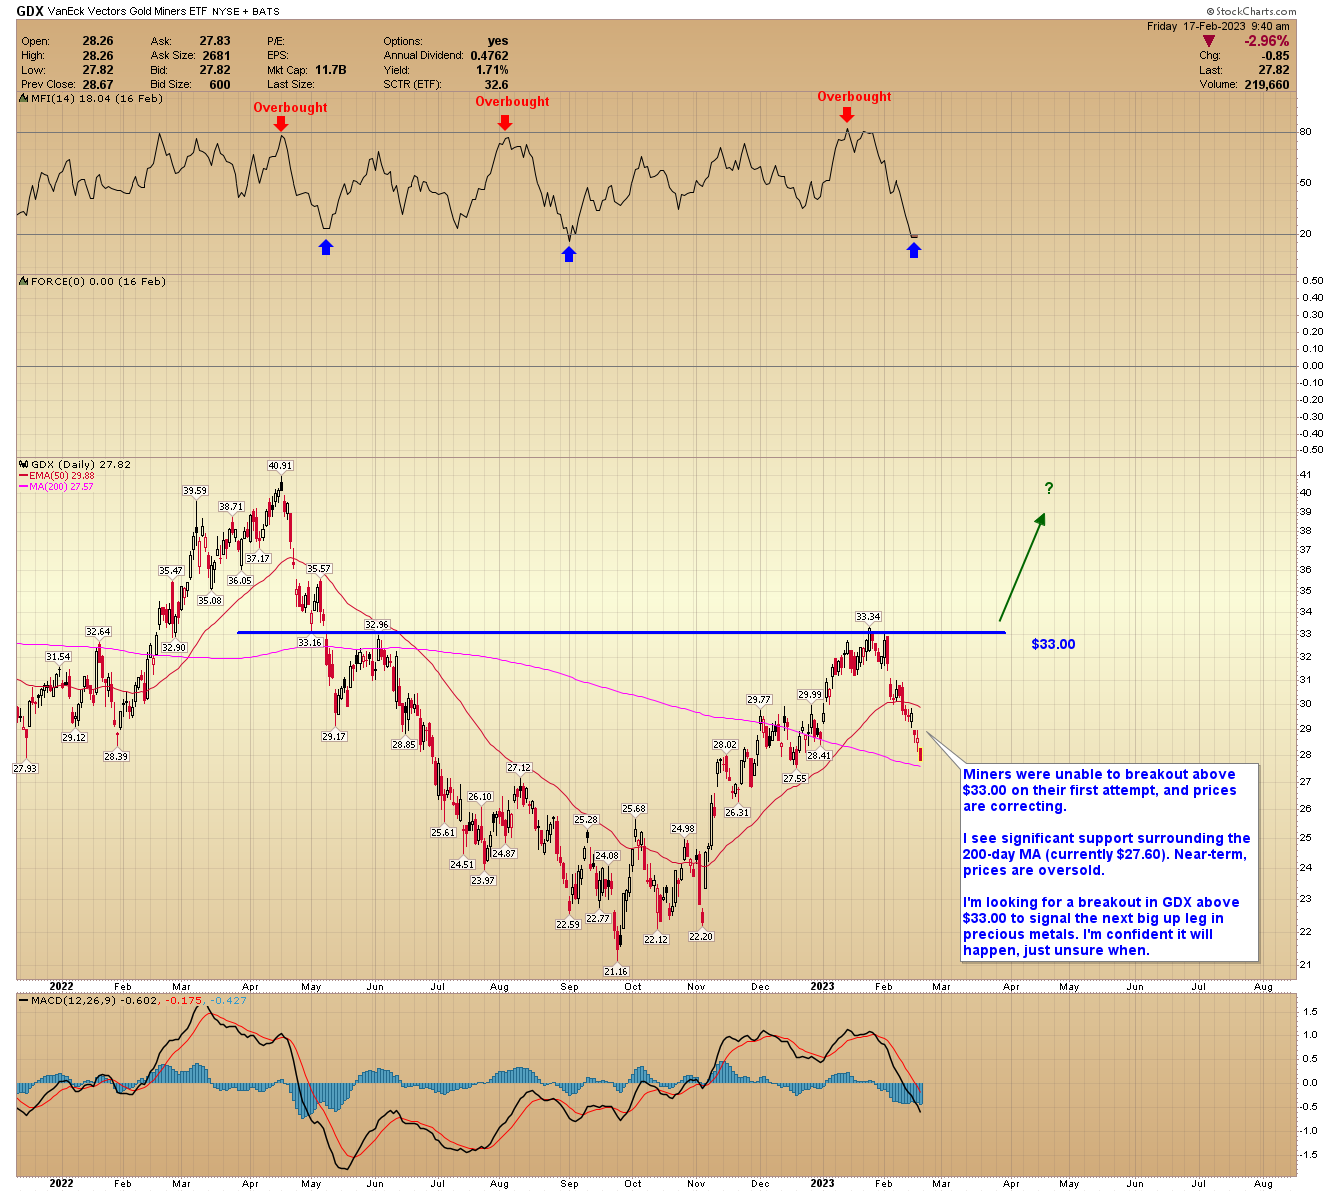
GDX DAILY CHART: Miners were unable to breakout above $33.00 on their first attempt, and prices are correcting.
I see significant support surrounding the 200-day MA (currently $27.60). Near-term, prices are oversold.
I'm looking for a breakout in GDX above $33.00 to signal the next big up leg in precious metals. I'm confident it will happen; just unsure when.
Conclusion
With interest rates repricing a higher terminal rate, it now looks like the correction/paus in precious metals could last a bit longer – maybe March or April. Once rates peak, gold should rally and perhaps breakout above $2000. The next major move in gold will come when interest rates are falling.
AG Thorson is a registered CMT and an expert in technical analysis. He believes we are in the final stages of a global debt super-cycle. For more charts and regular updates, please visit here.
*********


