Gold Manipulation…Get Over It


The idea that gold is being manipulated by the US Government, by central banks and other nefarious creatures has been around as long as I can remember. It was prevalent in the mid-1960s when I first got interested in the markets and it is still prevalent now, some 50 years later. Prices go up, prices go down, but manipulation is forever.
Writing in the May 28, 2016 edition of the Financial Post, Mr. Peter Hodson (www.5iresearch.ca) had this to say:
“Conspiracy Theories still haven’t panned out. Gold attracts all sorts of crazies, who expect governments to implode and gold to be the new medium of exchange. Sure, there is a possibility of this, but there was also a possibility 30 years ago. How long are you willing to wait for it to occur? Conspiracy theorists claim that governments and central banks are manipulating gold. Suppose that were true, though: Would you not want to be on the side of the conspirators, who have unlimited time and resources? Why would you want to bet against them?”
Although I write about gold bullion, I believe that the profits are really in speculating in the shares of gold (and silver) stocks. However, one should always keep their eyes open on the trend in gold bullion as that is what, in the end, propels most of the gold stocks with the exception of the exploration ones. These are propelled by hopes and dreams of a fabulous strike regardless of the trend in gold itself.
Currencies (governments) do not collapse overnight. It happens progressively. No one can predict the timing of any collapse but the markets give one a good warning ahead of time. So, how would one play the gold game if one were of the mind that the US Government (and that is who we are talking about) were about to collapse?
In my view one would play the gold game as one always plays the gold game. You speculate for profits (my preference is to look at the intermediate term but let the profits run). At some point the markets start to warn you of a serious collapse. At that point one can then sell off any gold stocks and convert the cash into gold bullion at that time. I know, you might think by that time the cash you get for the stocks (in US Dollars) has diminished in value and gold increases in value so you end up losing. But that’s not the way it works. Let me give you a very simple example of what happens. I must emphasize that this is a very simple example but it serves the purpose of highlighting the speculative philosophy expounded on above.
My gold and Merv’s Gold & Silver 100 Index data goes back to before the recent great bull market.
Gold bottomed in 1999 at $252.50 and reached its high point in 2011 at $1923.70 for a 662% advance.
My Merv’s Gold & Silver 100 Index was at its low in 1998 at 10.0 and reached its peak in 2011 at 559.7 for a 5497% advance.
If you bought one ounce of gold in 1999 at $252.50 you still have one ounce of gold in 2011 but now worth $1923.70 in devaluated dollars.
If you bought the Merv’s Index with the $252.50 you would have bought 25.25 Index shares. These share would be worth $14,132.43 in 2011. You now sell the Index shares and buy gold at the now higher price of $1923.70. You now have 7.35 ounces of gold instead of the one ounce with the buy and hold for dear life method.
Just something to really think about if you are considering buying gold and holding for dear life.
That’s enough for the lesson of the day. Now, what is gold up to?
Long-Term
The long-term picture is slowly starting to weaken but nothing serious yet. The price of gold is still well above its positive sloping moving average line. Weakness is being shown in the momentum indicator. Although the indicator is still comfortably in its positive zone it is heading lower and has crossed below its trigger line. This is usually the first sign of trouble ahead but most often is just a precaution during a rest period. So, the rating remains BULLISH at the Friday close. As for the 100 stocks in the Merv’s Gold & Silver 100 Index, these also have weakened further but still not a worry. The POS/NEG rating stands at 90% positive and 7% negative. Still a very strong bull rating.
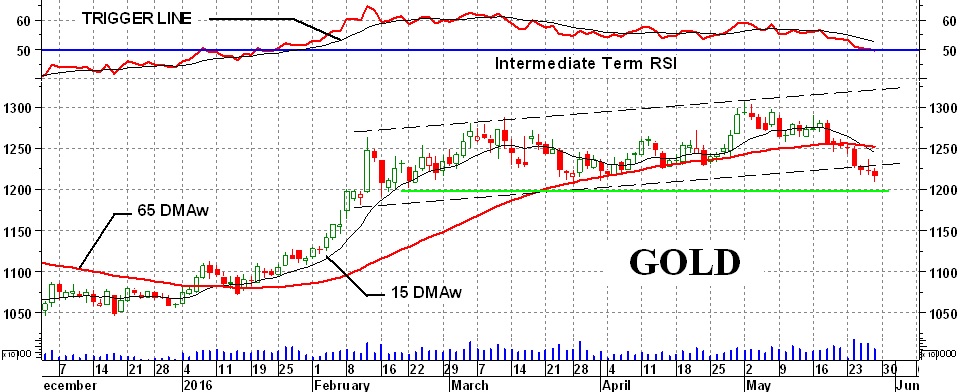
Intermediate-Term
First, let’s get the basics out of the way. The price of gold is moving ever lower, below its negative sloping moving average line. The momentum indicator has been tracking below its trigger line for a few weeks and although it is not that obvious, the indicator has just moved very slightly below its neutral line into the negative zone. Unfortunately, the intermediate term rating is now BEARISH at the Friday close. In addition, the short-term moving average line has moved below the intermediate-term line for further confirmation of the bear.
So what else is there in this intermediate-term chart? Well for one, the action this past week broke below the previous support from that up trending “box” pattern (dash lines). We are now watching the support at the $1200 level. This support is important from both the bar chart perspective -- and from my intermediate-term point and figure chart perspective. Should the price break (https://www.gold-eagle.com/rate/price-of-gold/ ) below the $1200 support, especially if it hit $1175, then a move back to the lows of last December is highly likely.
One can easily see the warnings that the intermediate-term momentum indicator was giving with its negative divergence versus the highs of the gold price in early March and again in late April. Although they may not always foretell the future one should never cast aside these warnings, at least not until the warnings have been nullified by subsequent action.
As for the 100 stocks, they have also now gone negative. The POS/NEG rating has fallen to 36% positive and 53% negative (versus 75% positive and 21% negative last week).
Short-Term
This is easy, the price is well below its negative sloping moving average line and the momentum indicator is below its trigger line, inside its negative zone. The rating at the Friday close remains BEARISH. As for the 100 Merv’s stocks, they are now way, way down in negative territory. The POS/NEG rating now stands at 5% positive and 92% negative, ready for some sort of rally from about here. During the week we had 88 stocks declining and only 9 stocks advancing at week’s end.
Finally
Readers are invited to view my Facebook page at https://facebook.com/merv.burak where I will be slowly posting commentaries explaining in more detail my various indicators and techniques. I also present from time to time some individual stocks that look as if they may be good speculations. I’m getting lazy in my old age so posting on the Facebook may not be as rapid as I would hope. However, nothing I post is meant to be a recommendation to buy or sell. One should check with their broker or investment advisor before acting.
 Merv is a retired Aerospace Engineering consultant. He is also a retired market technician with over 40 years of market experience and research. Merv received his certification as a Chartered Market Technician (CMT) in 1992. Developer of many technical techniques and programs which he has been using in his previous Technically Speaking with Wil-Arm and Technically Precious with Merv commentaries posted throughout the globe. Developer of several gold and silver Indices, Merv continues to update his Merv’s Gold & Silver 100 Index and Merv’s Penny Arcade 50 Index and reviews them during his periodic on-going Technically Precious commentaries.


