Gold Market Update


Two of our three requirements for a major uptrend developing across the Precious Metals sector that were set out in the last Gold and Silver Market updates have now been met - first silver has broken out to clear new highs, then gold broke out above the top line of its potential bearish Rising Wedge - the only condition remaining to be fulfilled is a breakout by the stocks indices - and that may be imminent. The important complication is that both gold and silver are now critically overbought as a result of being in unbroken uptrends for many weeks and we will come to the implications of that shortly.
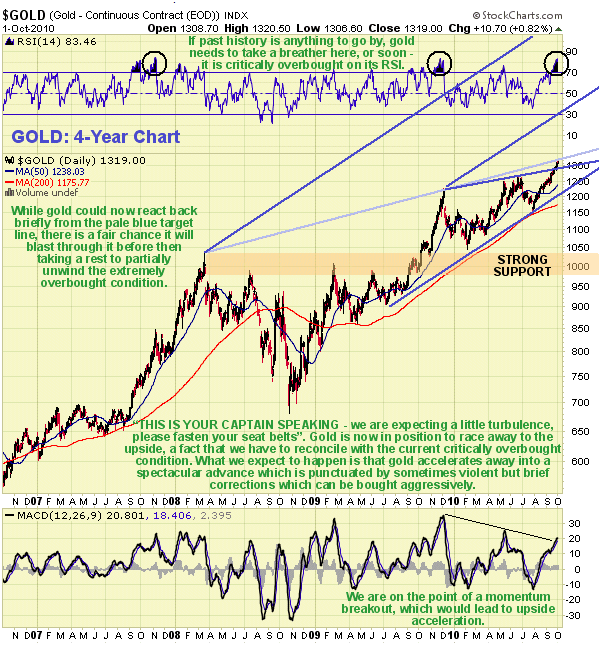
On its 4-year chart we can see how gold has broken above the top line of the potential Wedge drawn across the highs from last December. The pale blue trendline shown, drawn from the early 2008 highs, does not mark the top boundary of a true Wedge, but is believed to have some significance and MAY trigger a temporary reaction, which the current critically overbought condition certainly makes very possible. Gold is deep into critically overbought territory on its RSI indicator shown at the top of the chart, but still has substantial upside leeway on its MACD indicator shown at the bottom of the chart, which it should be noted can get overbought and stay overbought for a long time as the price continues to ascend.
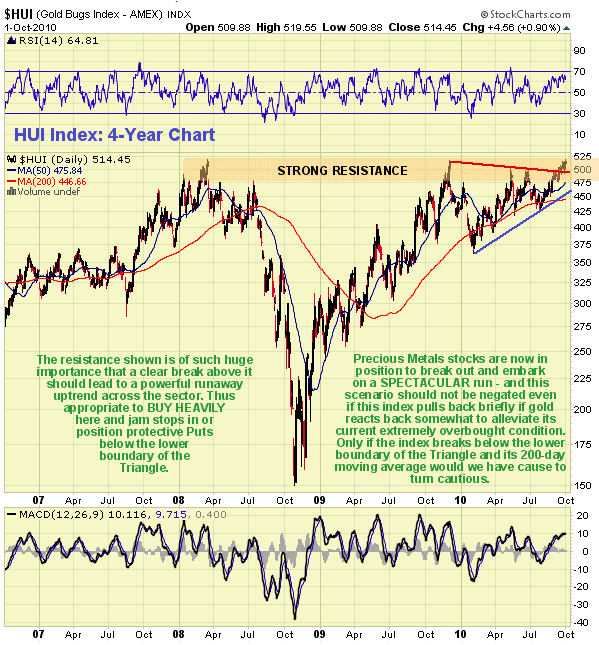
So, we have a situation where gold is in position to accelerate away to the upside, but is at the same time critically overbought on various short-term indicators, but is nowhere near so overbought on intermediate indicators. What are we to make of this? The probable scenario here is that now gold has broken out above the resistance at the top return line of the Wedge, as described, it accelerates away to the upside, the advance being punctuated by brief "air pocket" reactions that could be increasingly violent. The current critically overbought state makes such a reaction likely either immediately or very soon. These reactions may be deeply unsettling for those long, but if the reason for them is known in advance and they expected, they can be used by traders to pyramid positions at better prices. The MINIMUM target for this advance is the lower parallel return line shown, which is currently in the $1500 - $1600 area, which is Jim Sinclair's long-standing target that looks not just easily achievable but actually quite modest - our upper parallel return line gives a MUCH higher target. Small wonder then that PM stocks look so attractive here, as despite their gains of recent weeks, they haven't even collectively broken out yet!. Many big weighty gold stocks look set to make their biggest gains in a long time and their gains can be leveraged by means of options, and the better juniors and mid-caps look set to go ballistic - we haven't been able to write them up fast enough on clivemaund.com
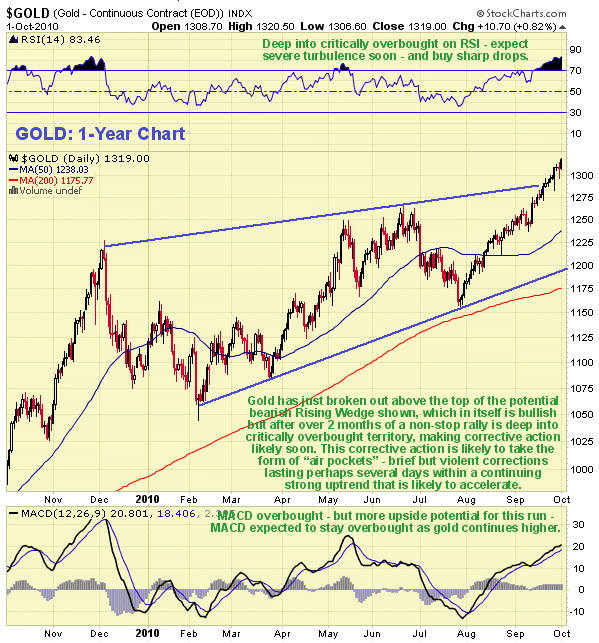
The 1-year chart for gold shows recent action in more detail. On this chart we can see that although the RSI is showing a critically overbought extreme calling for consolidation or reaction soon, the uptrend to date has been steady and considerably less steep than that of last Fall or the big 2007 - 2008 rally shown on the 4-year chart , circumstances which we interpret as allowing for acceleration of the uptrend, despite a probable "air pocket" reaction soon. Thus the advance is likely to steepen considerably, with occasional scary but brief reactions along the way. It is thought that it will be a good strategy to buy aggressively on any such sharp down days, as gold is likely to turn on a dime and go roaring up again.
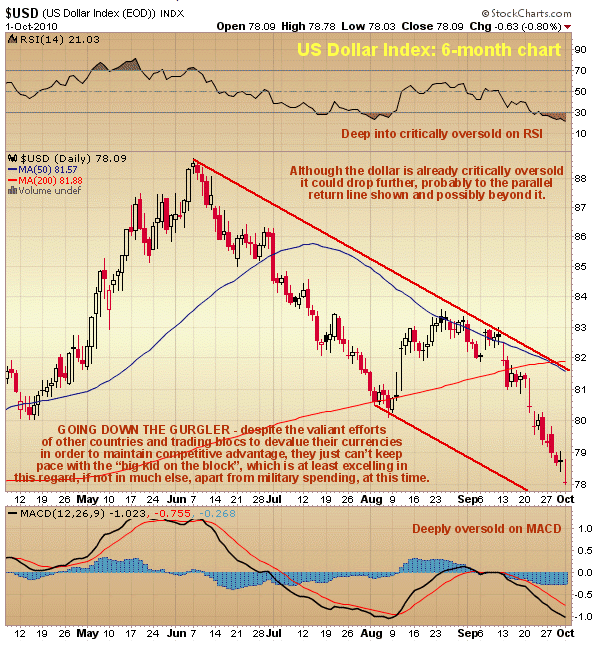
With the Precious Metals so strong in recent weeks, it is hardly surprising to observe on our 6-month for the US dollar index that it has been in ragged retreat. The US has always had a reputation for doing things in style, and when it comes to currency debasement no one is going to steal a march on them - while other countries are frantically trying to keep up with their own competitive devaluations and can be expected to increasingly follow the US example and indulge in a little QE (Quantitative Easing) of their own, compared to what the US is doing this is "lemonade stand" stuff - for as we can see on the US dollar index chart, the dollar is definitely winning the "race to the bottom" at this time. The US has every incentive to win this race, as it has racked up astronomic debts and obligations that are best dealt with by devaluing the currency. An outright headline grabbing Sovereign Default by the US would certainly not be what one associates with Triple A ratings and might result in the country being "put in the doghouse" economically, not to mention getting the Tea Party mob stirred up, so it's far better to engage in a creeping default by simply creating more and more money. With most other countries aiming to follow suit it's small wonder that the outlook for gold and silver is now so rosy. It's kind of sad really for the naive, trusting overseas holders of US Treasuries. The deflation dragon, which had been lurking menacingly in the background earlier this year, is being suffocated in a sea of newly created cash. Hyperinflation? - "We'll deal with that problem when we come to it". When the United States is completely bankrupted the surplus holding Asian Tiger economies will ride to the rescue, buying up corporations and vast tracts of Real Estate at pennies on the dollar - and put America to work again - for new masters OUTSIDE the country, albeit at decidedly competitive rates of pay. See? - no big military required.
![]()
Two of our three requirements for a major uptrend developing across the Precious Metals sector that were set out in the last Gold and Silver Market updates have now been met - first silver has broken out to clear new highs, then gold broke out above the top line of its potential bearish Rising Wedge - the only condition remaining to be fulfilled is a breakout by the stocks indices - and that may be imminent. The important complication is that both gold and silver are now critically overbought as a result of being in unbroken uptrends for many weeks and we will come to the implications of that shortly.
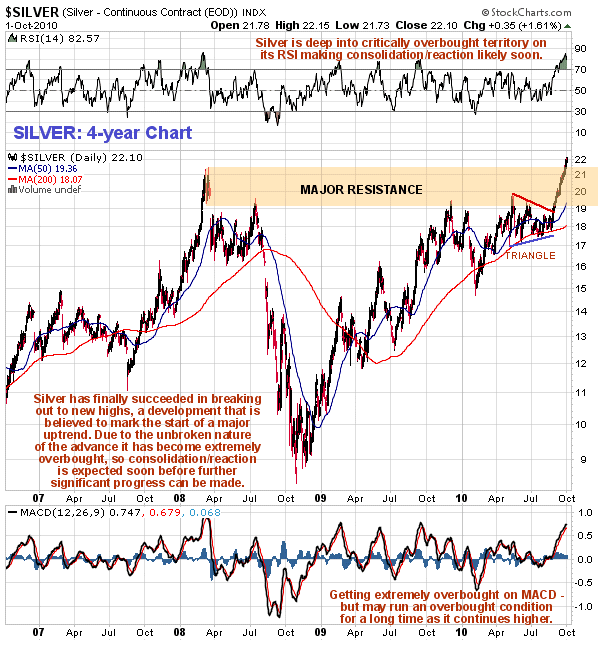
On its 4-year chart we can see how silver has made a clear breakout to new highs this past week. This is an IMPORTANT BULLISH DEVELOPMENT that is believed to mark the start of a major uptrend in silver. However, the latest gains came at the cost of driving silver deep into critically overbought territory making consolidation/reaction very probable soon. This is evident from the RSI indicator at the top of the chart. Thus we have a situation where a major new intermediate uptrend has been signalled but where further short-term potential is limited by the extremely overbought condition. What we should therefore look for is consolidation/reaction soon to alleviate this overbought condition somewhat and restore upside potential. The current gap between the price and the 200-day moving average is about $4, but early in 2008 this gap widened to $7 which gives some idea of the medium-term potential for silver, and there is nothing to say that this gap cannot be wider. While the short-term overbought condition clearly needs to moderate, we should note that silver will be expected to maintain a generally overbought condition for weeks and possibly for months as it continues to climb.
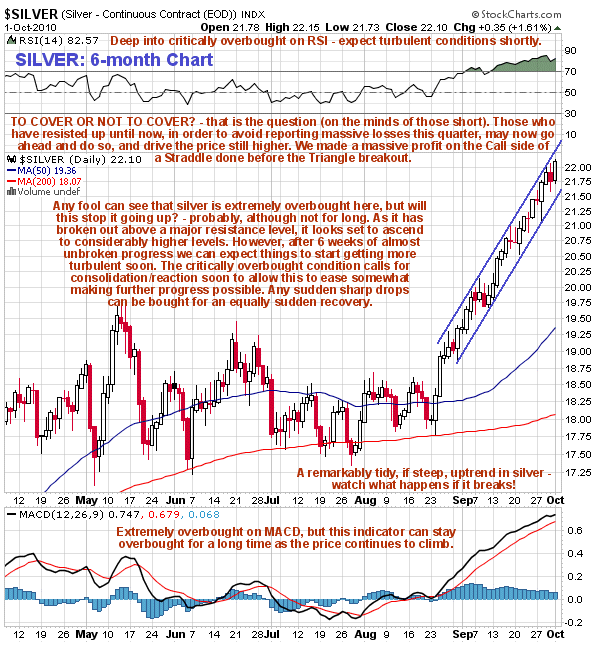
The shorter-term 6-month chart shows that silver has been in a remarkably tidy, if steep, uptrend since it broke out of its Triangle in August. On account of its now being deep into critically overbought territory on its RSI indicator, failure of the steep uptrend can be expected to lead to a rapid convulsion as short-term traders suddenly hit the exits. However, any such sudden weakness can be bought into, as the medium-term trend, which is up, can be expected to suddenly reassert itself once the sudden correction has done its work of easing the overbought condition. We can expect numerous "air pockets" of this type as the price ascends, mostly minor and lasting perhaps a few days, with a few larger ones thrown in to keep traders on their toes. Any such sharp drops can be bought into aggressively. The now large gap with the 50-day moving average is making a "short sharp shock" increasingly likely.
It is obvious that the steep advance of the past few weeks has been fuelled in part by a short squeeze, but with regard to this it is thought likely that some shorts have held out up to now, in order not to book massive losses for the third quarter. Now that we are into October they may finally decide to "take their lumps" and their buying in coming days could force the price even higher, resulting in an even more overbought extreme.
Clive Maund, Diploma Technical Analysis
[email protected]
www.clivemaund.com
Copiapo, Chile, 3 October 2010

Clive P. Maund’s interest in markets started when, as an aimless youth searching for direction in his mid-20’s, he inherited some money. Unfortunately it was not enough to live a utopian lifestyle as a playboy or retire very young. Therefore on the advice of his brother, he bought a load of British Petroleum stock, which promptly went up 20% in the space of a few weeks. Clive sold them at the top…which really fired his imagination. The prospect of being able to buy securities and sell them later at a higher price, and make money for doing little or no work was most attractive – and so the quest began, especially as he had been further stoked up by watching from the sidelines with a mixture of fascination and envy as fortunes were made in the roaring gold and silver bull market of the late 70’s.
Clive furthered his education in Technical Analysis or charting by ordering various good books from the US and by applying what he learned at work on an everyday basis. He also obtained the UK Society of Technical Analysts’ Diploma.
The years following 2005 saw the boom phase of the Gold and Silver bull market, until they peaked in late 2011. While there is ongoing debate about whether that was the final high, it is not believed to be because of the continuing global debasement of fiat currency. The bear market since 2011 is viewed as being very similar to the 2-year reaction in the mid-70’s, which was preceded by a powerful advance and was followed by a gigantic parabolic price ramp. Moreover, Precious Metals should come back into their own when the various asset bubbles elsewhere burst, which looks set to happen anytime soon.
Visit Clive at his website: CliveMaund.com
More from Gold-Eagle


