Gold Market Update


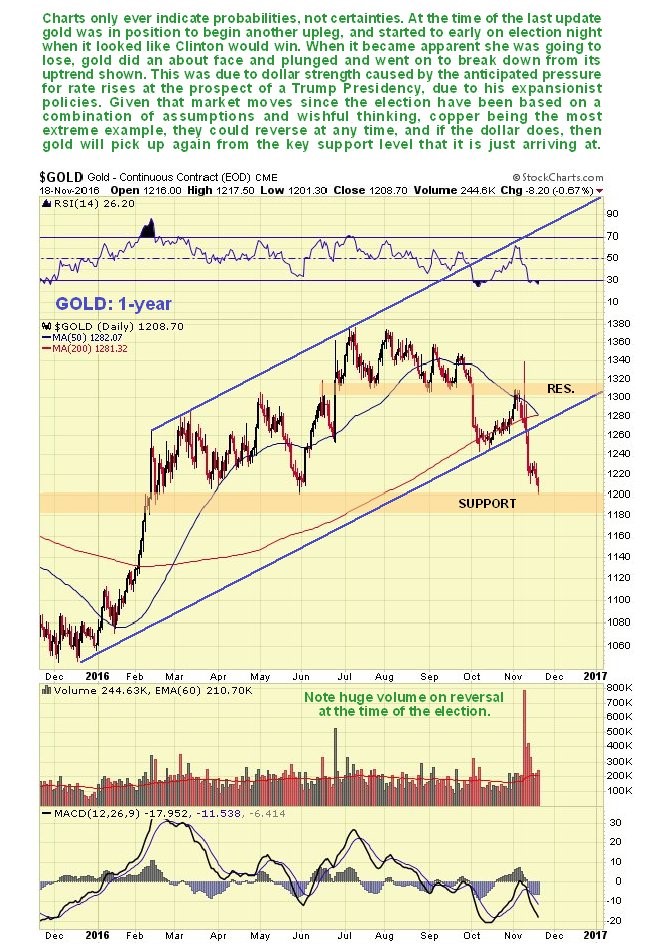
Charts only indicate probabilities, not certainties. At the time of the last update, gold was setting up for another upleg within the uptrend shown on our 1-year chart below, but this was predicated upon the expected Clinton victory, so when Trump won instead, this scenario aborted. Observe how, early on election night, when the markets assumed Clinton would win, gold was up sharply, but by the end of the night it had reversed sharply on heavy turnover, and it went on to break down from the uptrend and head steeply lower towards the important support level shown, which it started to arrive at on Friday. Fundamentally, the reason for gold heading sharply lower on a Trump win was not the possibility of Trump melting down Trump Tower and casting it into gold ingots to dump on the market, but the prospect of Trump’s ambitious and expansionary policies driving up interest rates which had the immediate effect of driving the dollar higher, but given that sharp moves across markets since the election have been based on a combination of assumptions and wishful thinking, they could go into reverse very quickly. Moreover, with the dollar hitting a target late last week, gold has a good chance of turning up from the support in the $1180 - $1210 zone. It is widely assumed that because Trump won the election by a clear majority (of electoral votes), he has “carte blanche” to fulfill his election pledges as he wishes, but there are powerful vested interests standing in his way who will make their presence felt, which is a reason some of the post-election trends may go into reverse
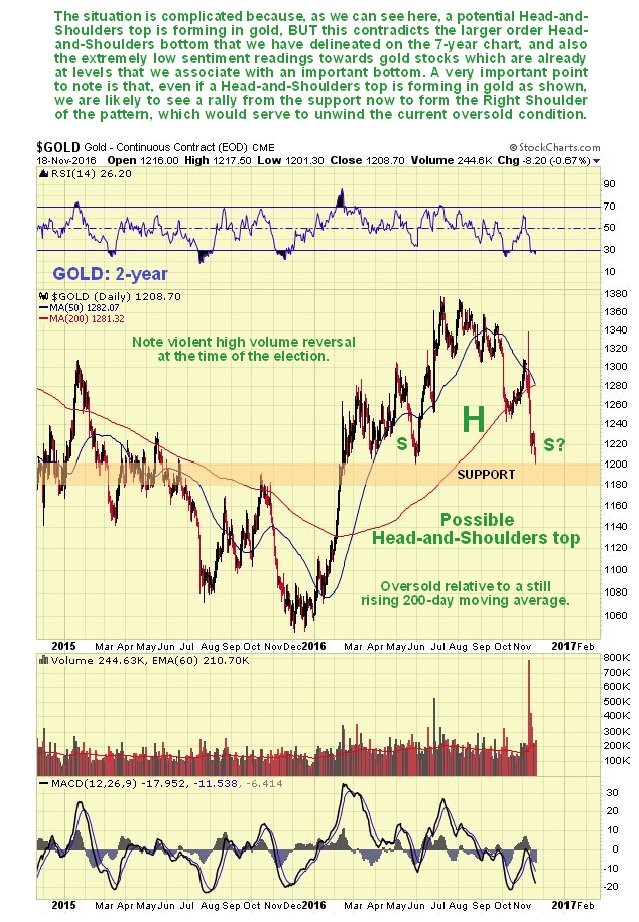
It is interesting to look at gold on a 2-year chart, because on it we can see that gold may be in the process of forming a Head-and-Shoulders top at the support level. However this scenario is considered less likely, because of a larger order Head-and-Shoulders bottom that we will look at shortly on gold’s 7-year chart, and because gold stock sentiment is already at the abysmal levels that are associated with an important bottom. Even if gold is actually marking out a Head-and-Shoulders top, the probability is high that it will rally here to about the $1280 level to form a Right Shoulder to the pattern, which would serve to unwind the oversold condition before it later breaks down.
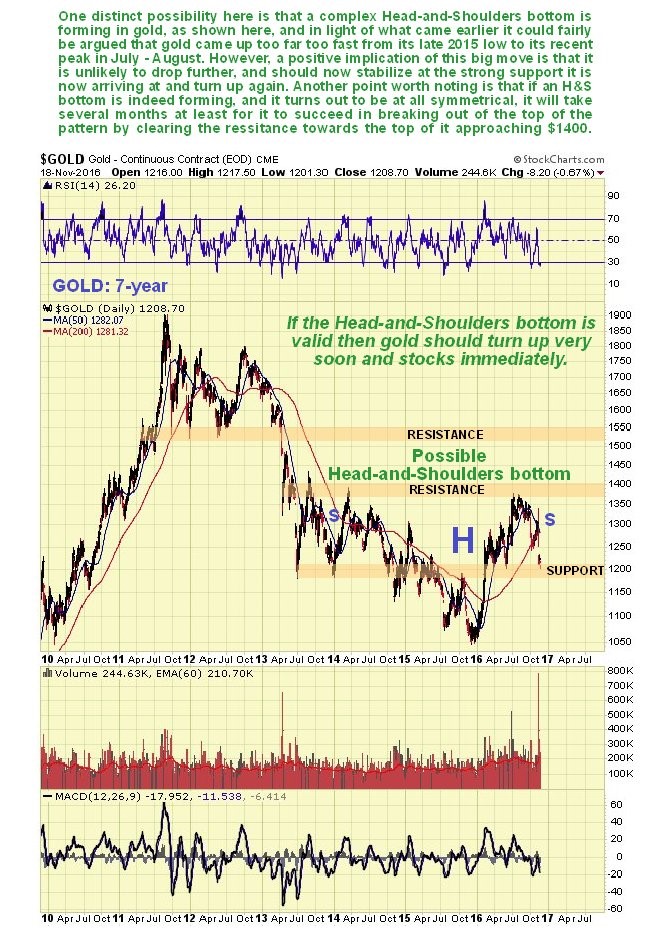
Proceeding to the 7-year chart, we see that a larger order complex Head-and-Shoulders bottom may be forming in gold, and if so the retreat of recent weeks signifies it dropping down to form the Right Shoulder of the pattern. If this interpretation is correct then, given the tendency of these patterns to symmetry, it is likely to take some months of building out the Right Shoulder before gold is ready to advance out of the pattern by breaking above the resistance at the top of it towards and at $1400. The big advance from the late 2015 low to the peak last July – August certainly has bullish implications and increasing the probability that gold is turning into a bull market.
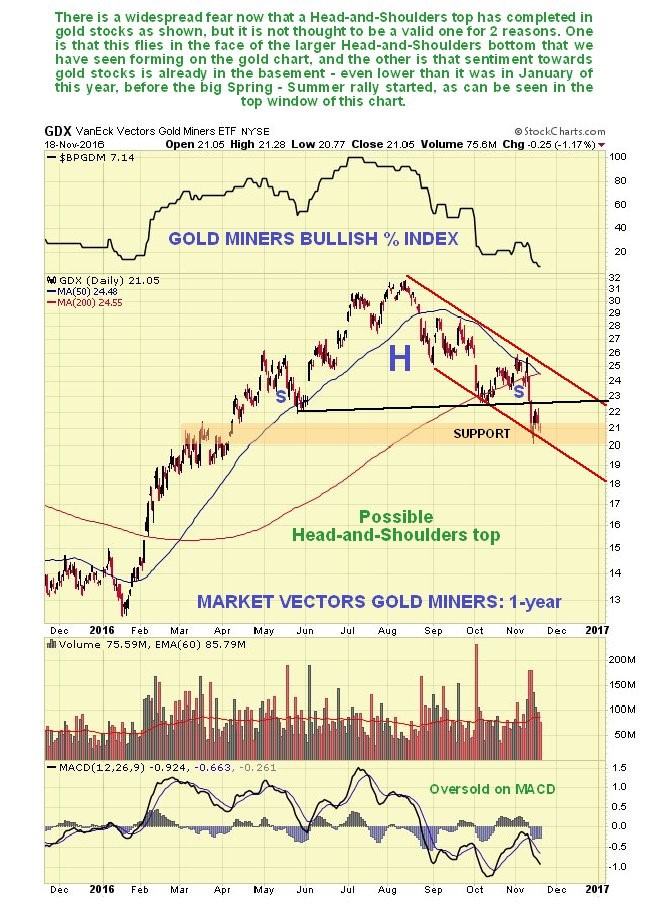
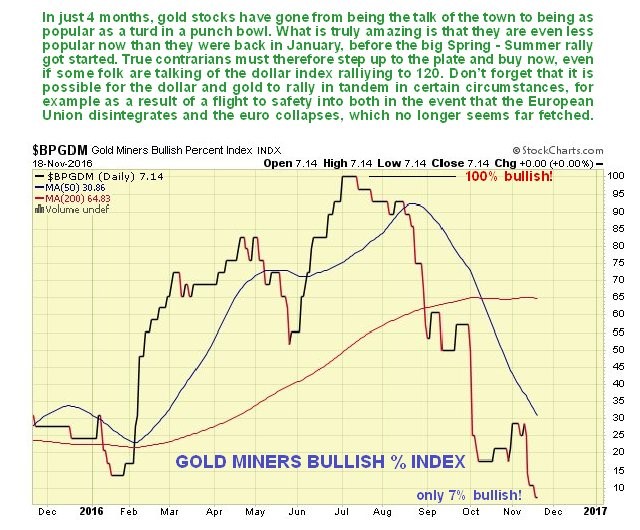
The breakdowns by gold and silver naturally had a big impact on mining stocks, which fell hard, as we can see on the 1-year chart for GDX shown below. There is a widespread fear now that GDX and various indices have broken down from a Head-and-Shoulders top, but it is not thought to be a valid one for 2 main reasons – one is that this flies in the face of the larger order Head-and-Shoulders bottom that we have already observed on the 7-year chart for gold, and the other is that sentiment towards gold stocks is already close to rock bottom – just 7% bullish compared to 100% at the beginning of July. This reading, which we can see on the Gold Miners Bullish Percent Index chart below, is even lower than just before the huge sector rally that started in January of this year, when it was at about 13%. This strongly suggests that GDX will turn up from the strong support level that it is currently dug into.
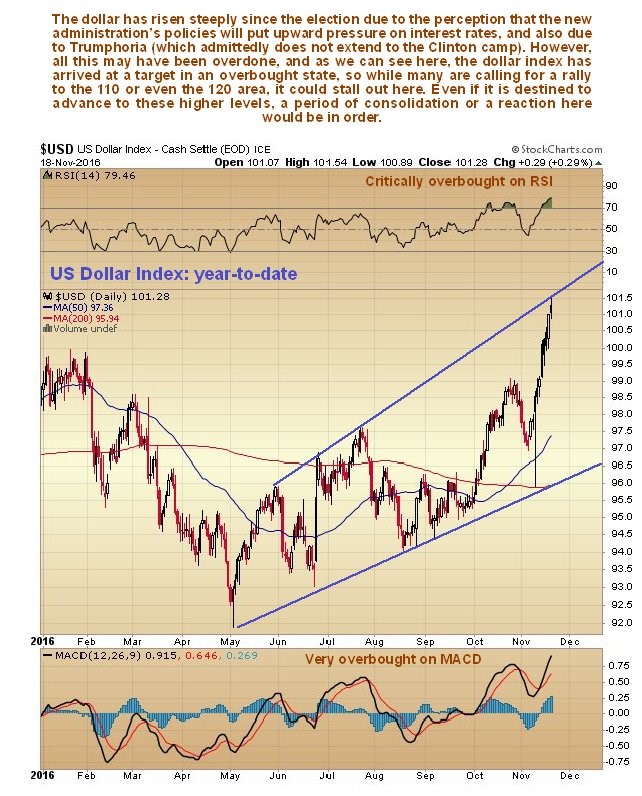
The dollar did an about face and went storming up on the Trump win, for the reasons set out above. Many are now calling for a big rally to the 110 or even 120 area. And while this could yet occur, it is sobering to observe that the dollar has arrived at a target in a very overbought state. Moreover, given that simplistic assumptions about a Trump Presidency could soon give way to serious doubts, it is conceivable that the dollar is at a top here – even if it is destined to continue to 110 or 120, it would be in order for it to stop for a rest here and consolidate or react somewhat.
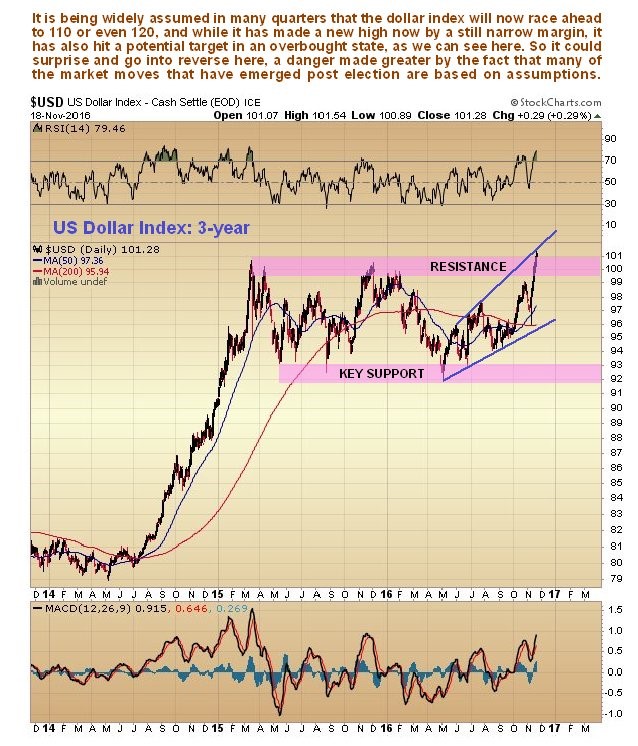
The dollar index has made new highs, as has been widely TRUMPeted in the media. However, as we can see on its 3-year chart, these new highs are still marginal, and the fact that it is at a target and still within grabbing range of the resistance shown, and is overbought, increases the risk that it will slump back into the giant trading range, and if it does it will trigger a rebound in the Precious Metals sector – this could be the most important message being telegraphed by the extremely low Gold Miners Bullish Percent Index.
Courtesy of Courtesy of http://www.clivemaund.com

Clive P. Maund’s interest in markets started when, as an aimless youth searching for direction in his mid-20’s, he inherited some money. Unfortunately it was not enough to live a utopian lifestyle as a playboy or retire very young. Therefore on the advice of his brother, he bought a load of British Petroleum stock, which promptly went up 20% in the space of a few weeks. Clive sold them at the top…which really fired his imagination. The prospect of being able to buy securities and sell them later at a higher price, and make money for doing little or no work was most attractive – and so the quest began, especially as he had been further stoked up by watching from the sidelines with a mixture of fascination and envy as fortunes were made in the roaring gold and silver bull market of the late 70’s.
Clive furthered his education in Technical Analysis or charting by ordering various good books from the US and by applying what he learned at work on an everyday basis. He also obtained the UK Society of Technical Analysts’ Diploma.
The years following 2005 saw the boom phase of the Gold and Silver bull market, until they peaked in late 2011. While there is ongoing debate about whether that was the final high, it is not believed to be because of the continuing global debasement of fiat currency. The bear market since 2011 is viewed as being very similar to the 2-year reaction in the mid-70’s, which was preceded by a powerful advance and was followed by a gigantic parabolic price ramp. Moreover, Precious Metals should come back into their own when the various asset bubbles elsewhere burst, which looks set to happen anytime soon.
Visit Clive at his website: CliveMaund.com


