Gold Market Update


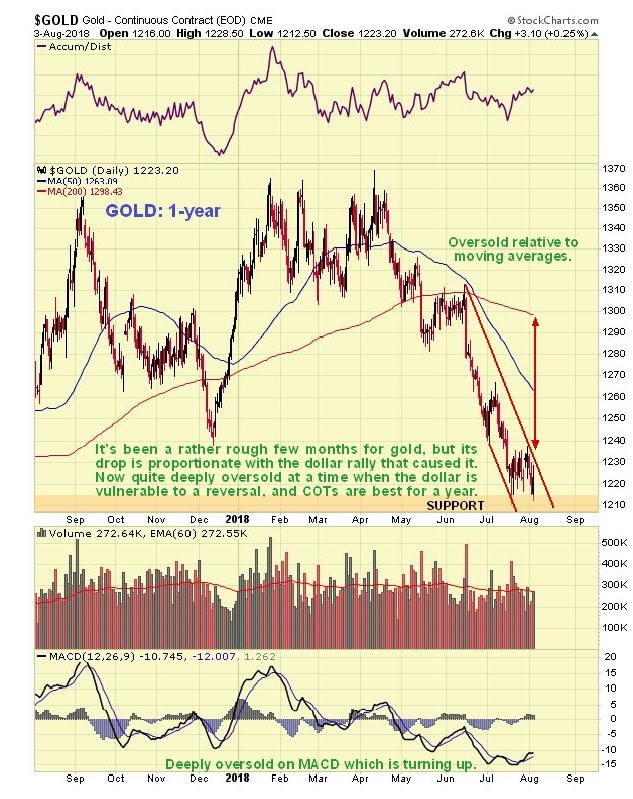
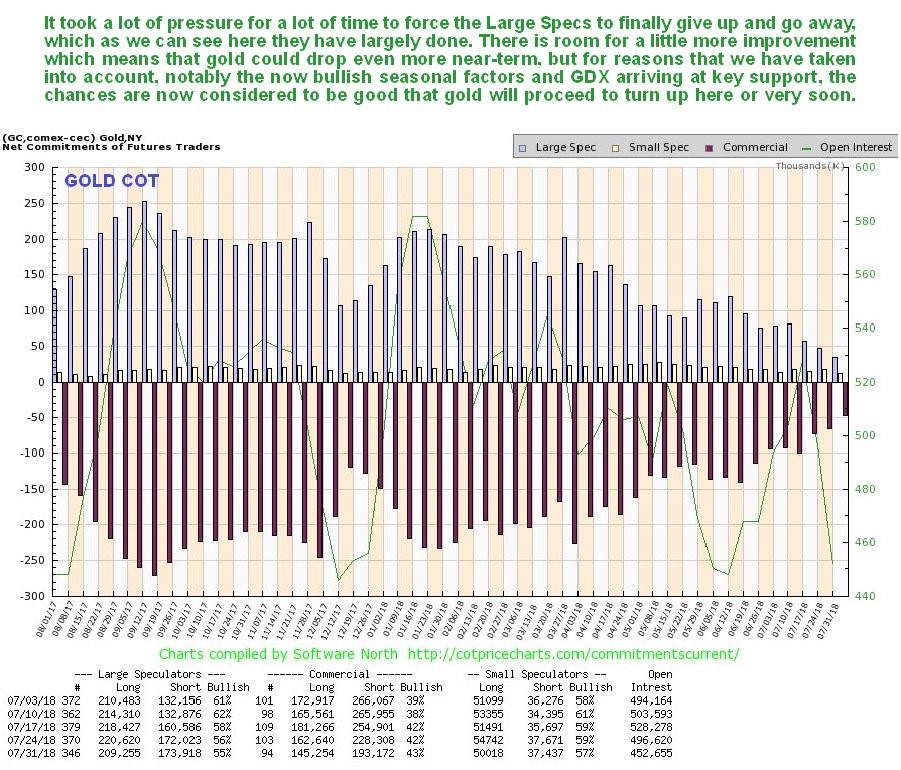
Gold has had a rather hard time of it during the past several months, as we can see on its latest 1-year below, but its drop has been proportionate to the rally in the dollar, and is therefore unremarkable. What this drop has achieved, which is a useful precursor to a recovery, is to finally flush out the Large Specs, who, after outstaying their welcome, have finally packed their bags and left. This we can see on the latest COT chart which is stacked right below gold’s 1-year chart for direct comparison.
Click on chart to popup a larger, clearer version.
Points worth noting on these charts include the following: gold is now oversold on its MACD and relative to its moving averages and when you couple these facts with the now cleaned up COT and strongly bullish seasonal factors now in play that we will look at shortly, we can see that there is a strong case for gold turning up here, which implies that the dollar will soon drop, so we will look at that later too. The positive divergence of the Accum – Distrib line relative to the gold price over the past couple of weeks is worth noting too.
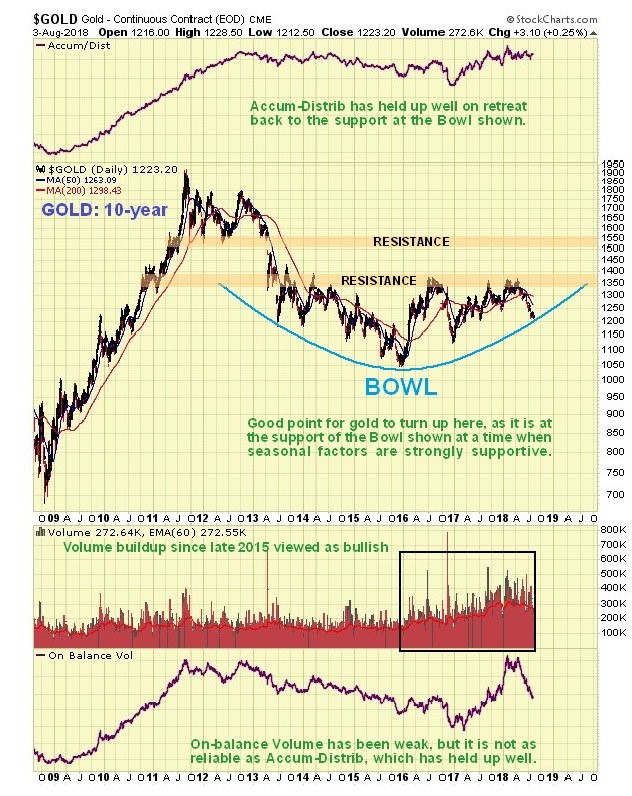
Taking all of the above into account it is thus very interesting to observe gold’s latest 10-year chart on which we see that its price has dropped down to arrive at the support of a giant Bowl pattern, so, again, this is a very point for it to turn up. The pattern in gold since early – mid 2013 may also be described as a complex Head-and-Shoulders bottom which is not shown here as it would make the chart rather messy, and the Bowl pattern suffices to define what is going on, at least for now.
Seasonally, it could not look better for gold as it has just entered its most bullish time of year, and here we should note that seasonal factors are an important influence for gold, with heavy buying in India ahead of the wedding season being one important factor behind it.
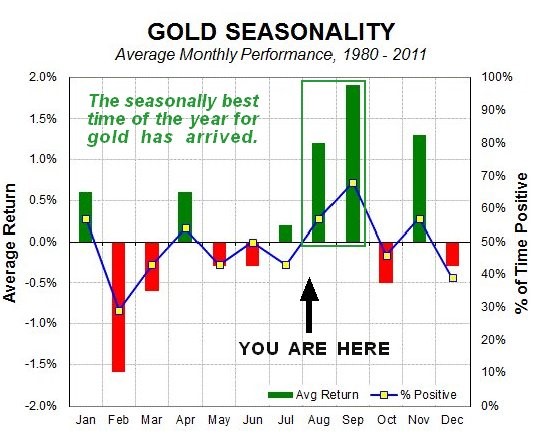
Chart courtesy of sentimentrader.com
The Gold Risk Levels chart, a new one for us, shows, as its name implies, that the risk involved in buying gold here is low. We can see on this chart that there is a good correlation between extremes on it and reversals in gold, both up and down. Whilst it could drop a little more to reach rock bottom, which would involve gold dropping back some more, it is saying that gold is either at or close to a bottom here…
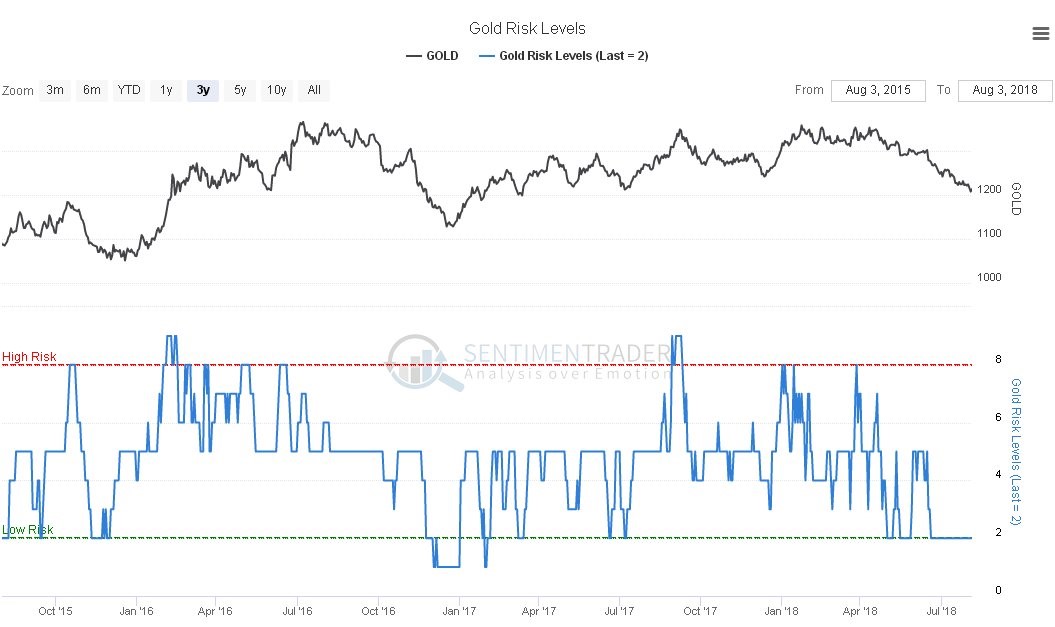
Click on chart to popup a larger, clearer version.
Chart courtesy of sentimentrader.com
Now we look at the all-important dollar, which alone is responsible for gold having fallen down the stairs in recent weeks. The timeframe for seeing to best advantage what is going on in the dollar index chart is a 2-year one. On the 2-year chart we can see exactly why the dollar’s advance has stalled out in recent weeks where it has – it has arrived at an important resistance level at its October – November 2017 peak – and the entire pattern from that peak suggests that a large Head-and-Shoulders bottom may be forming, with the index getting ready to drop down to complete the Right Shoulder of the pattern. Whilst this interpretation may be incorrect and the dollar suddenly resume its rally, this is made less likely by gold’s latest COT which supports an immediate gold recovery and therefore a drop in the dollar. If the pattern is indeed a Head-and-Shoulders bottom, then it has major implications because it means that the dollar index will later run to a target in the 102 – 104 area or even higher, which we can expect to coincide with a broad based asset collapse, as in 2008. After that the emergency measures that we can expect to be implemented by the Fed and other monetary authorities, in the Fed’s case some form of QE4, will usher in a dollar collapse and hyperinflation, which must be the endgame result of years of excess and profligacy.
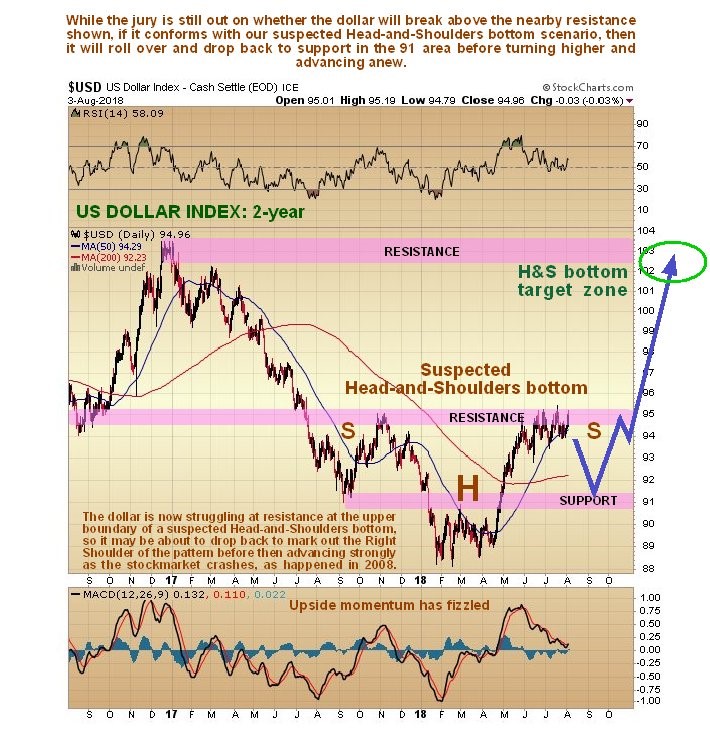
The storm clouds are already gathering with the news that the property market is starting to stall out ahead of an implosion that will spread across many asset classes. If this comes to the fore immediately then the dollar will continue to advance due to a “dash to cash” without bothering to drop back first.
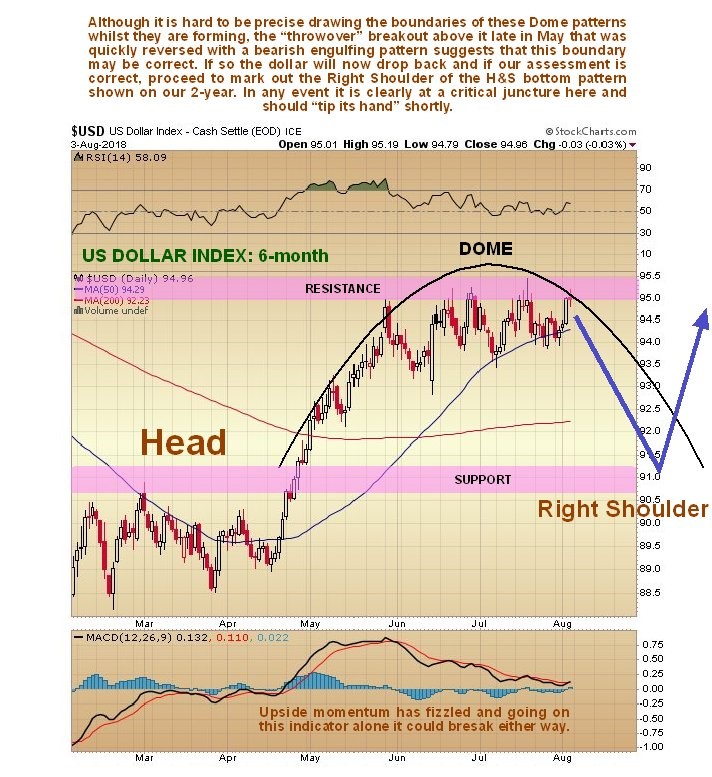
The dollar is thus at a critical juncture and the delicacy of the situation quickly becomes apparent when we look at the latest 6-month chart for the dollar index. On this chart we see that, in addition to stalling out at the aforementioned resistance, the dollar index is rounding over beneath a Distribution Dome, which, unless it negated by a break above it and the resistance level, will soon force it lower to drop back and mark out the Right Shoulder of our suspected Head-and-Shoulders bottom before it then turns higher again to complete the pattern as the broad-based market crash looms.
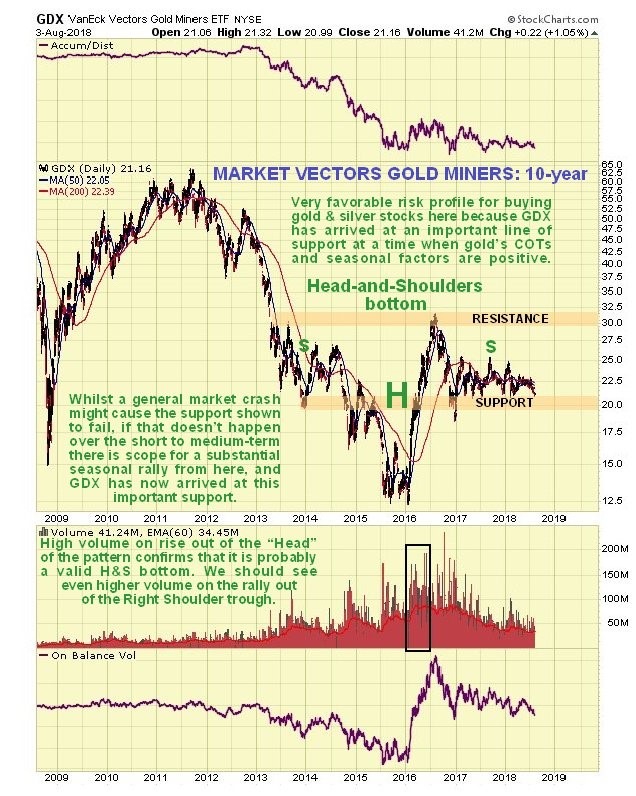
Whilst gold has dropped back significantly over the past several months, gold stocks, generally speaking, have not dropped back much at all, as we can see on the latest 2-year chart for GDX, and have in fact outperformed gold noticeably. This has bullish implications for the sector, as gold stocks tend to lead gold. The reason that we are looking at a 2-year chart for GDX is that it reveals the importance of the clear line of support at about $21, which turned the price up on no less than 5 occasions since early 2017. There is thus a high probability that the sector will turn up again here, and one tactic is to engage in across the board buying of the better stocks across the sector, employing a general stop below this line of support on GDX, but if you do this there is one thing you should watch out for. If we can see the importance of this line of support, then Big Money can too, and they may try to force GDX below this support briefly to run people out of their positions. Be aware of this and either be more generous in your placing of a general stop, or be ready to jump back in if the stop is triggered and then the sector suddenly turns higher again and hops back above the support.
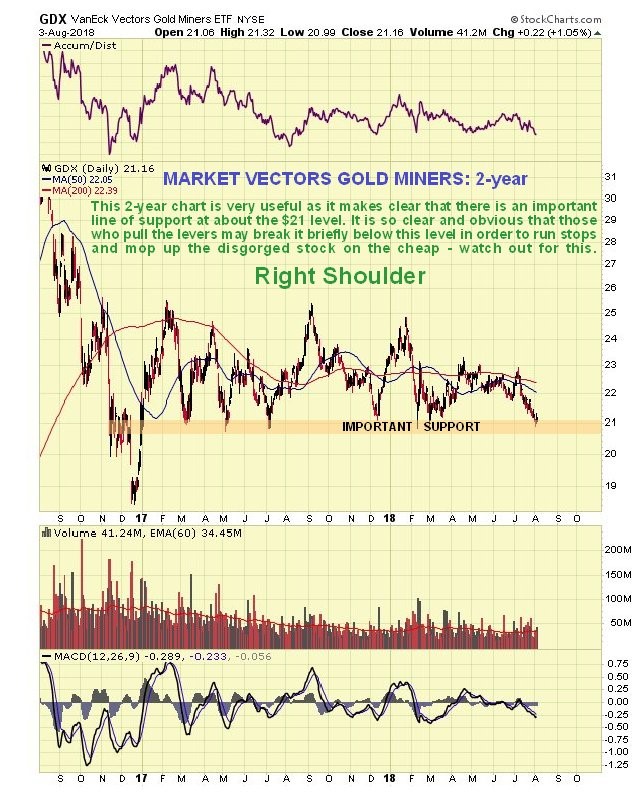
The 10-year chart for GDX continues to show it seemingly working on completing the Right Shoulder of a giant Head-and-Shoulders bottom. If this is what it is then we are clearly at a very good entry point for many stocks now.
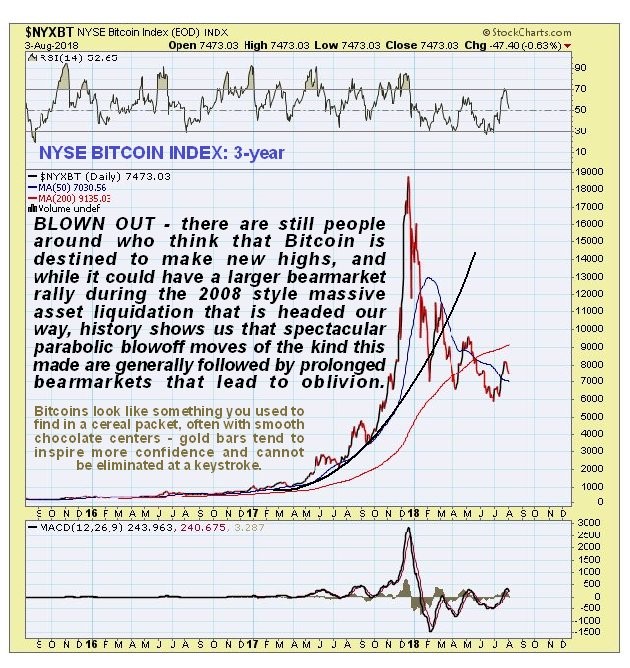
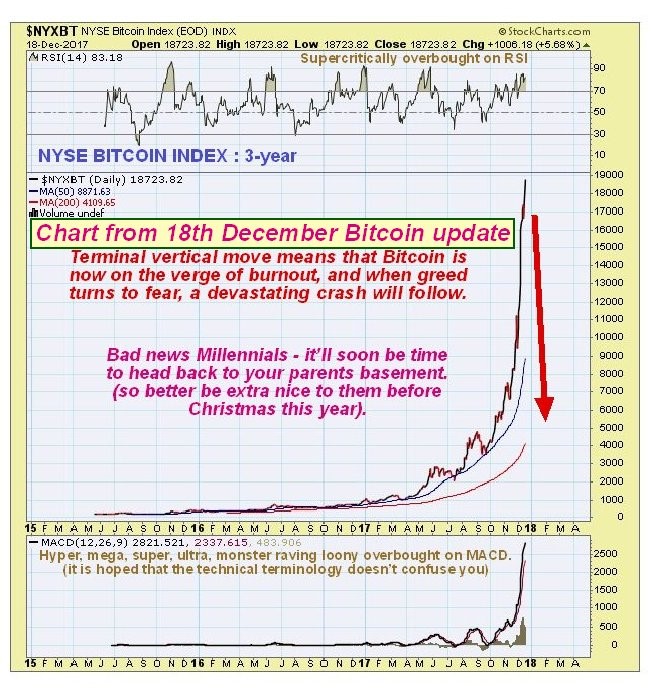
What about Bitcoin? – there has been a lot of chatter recently about it making a comeback and even advancing to new highs. You may recall that we called the top in Bitcoin within a day back in December. History is replete with examples of speculative counters like the Tulip Mania of the 16th Century or the South Sea Bubble that made parabolic blowoff moves like we have just seen in Bitcoin, and were then consigned to the trash can of history – and Bitcoin was the biggest bubble in history, even eclipsing these examples. This looks set to be the fate of Bitcoin too, especially as it is bedeviled by two problems that are having an increasingly adverse impact on it. One is that governments will simply not allow something of this nature to replace their Fiat, and will either outlaw it or tax it into the ground, or strangle it with regulations etc., the other is the proliferation of other cryptos that are all vying for a slice of the pie. So, while we might see a larger bearmarket rally in Bitcoin when the mass 2008 style asset liquidation hits, otherwise it should continue to head in the direction of obscurity and irrelevance.
Finally it is worth making some comment on the Trade War between the US and China and its immediate impact on China, and eventual impact on the rest of the world and in particular the average US consumer. The tariffs imposed on Chinese imports are purported to be to redress “unfair trade practices”, but if you want to consider unfair trade practices try this – the United States is a country that has gotten away with swapping piles of intrinsically worthless paper in the form of dollars and Treasuries for goods and services from other lands for about 7 decades, thanks to the dollar being the global reserve currency, and bought off the Saudis in the 70’s to create the Petrodollar to continue this system. The Chinese at least work to create the stuff they sell. No – the underlying and unstated reason for the tariffs is that the US Neocons have become alarmed at the rapid rise of China as the dominant economy in the region and its consequent growing geopolitical power and the resulting threat to their hegemony. So they have decided to try to “nobble” the Chinese economy with tariffs. For now their plan appears to be working as both the Chinese currency and Chinese stockmarket are tanking, and we can see the severe drop in the Shanghai Composite index on its 1-year chart below…
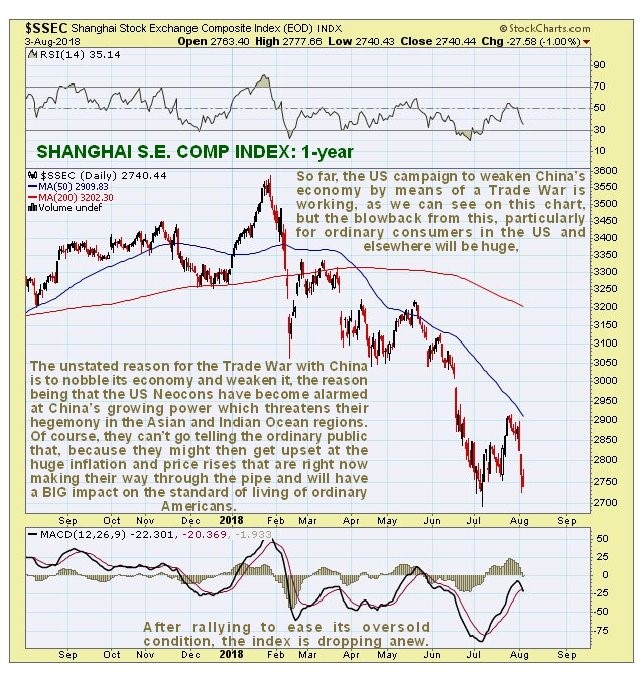
The problem is that, as any student of history knows, Trade Wars create a lose – lose situation for the world economy at large, and amongst the biggest losers will be US consumers who are now accustomed to buying stuff for peanuts that is made in some distant place over the horizon. The way things are going they won’t be able to buy this stuff on the cheap for much longer. There is a tsunami of inflation heading for US shores, which doesn’t bother the Neocons of course because most of them are millionaires or billionaires, but it is going to make a big difference to the standard of living of the average US citizen which Apple becoming a trillion dollar company will not allay – get ready to tighten your belts.

Clive P. Maund’s interest in markets started when, as an aimless youth searching for direction in his mid-20’s, he inherited some money. Unfortunately it was not enough to live a utopian lifestyle as a playboy or retire very young. Therefore on the advice of his brother, he bought a load of British Petroleum stock, which promptly went up 20% in the space of a few weeks. Clive sold them at the top…which really fired his imagination. The prospect of being able to buy securities and sell them later at a higher price, and make money for doing little or no work was most attractive – and so the quest began, especially as he had been further stoked up by watching from the sidelines with a mixture of fascination and envy as fortunes were made in the roaring gold and silver bull market of the late 70’s.
Clive furthered his education in Technical Analysis or charting by ordering various good books from the US and by applying what he learned at work on an everyday basis. He also obtained the UK Society of Technical Analysts’ Diploma.
The years following 2005 saw the boom phase of the Gold and Silver bull market, until they peaked in late 2011. While there is ongoing debate about whether that was the final high, it is not believed to be because of the continuing global debasement of fiat currency. The bear market since 2011 is viewed as being very similar to the 2-year reaction in the mid-70’s, which was preceded by a powerful advance and was followed by a gigantic parabolic price ramp. Moreover, Precious Metals should come back into their own when the various asset bubbles elsewhere burst, which looks set to happen anytime soon.
Visit Clive at his website: CliveMaund.com


