Gold Market Update
We have seen the breakout predicted in the last Gold Market update, although so far subsequent gains have been modest as gold continues to be restrained by the strong resistance level shown on the 1-year chart in the $655 - $680 zone. Although we have seen limited gains so far following this breakout, it was nevertheless an important technical development that is viewed as marking the start of a major uptrend which is still in its infancy. The open question now therefore is whether gold will go on to break above $680 soon, which would be expected to lead to a rapid run at last year’s highs in the $730 area, or whether it will first react back towards the third fan line, which happens frequently after a breakout from one of these 3-arc fan patterns.
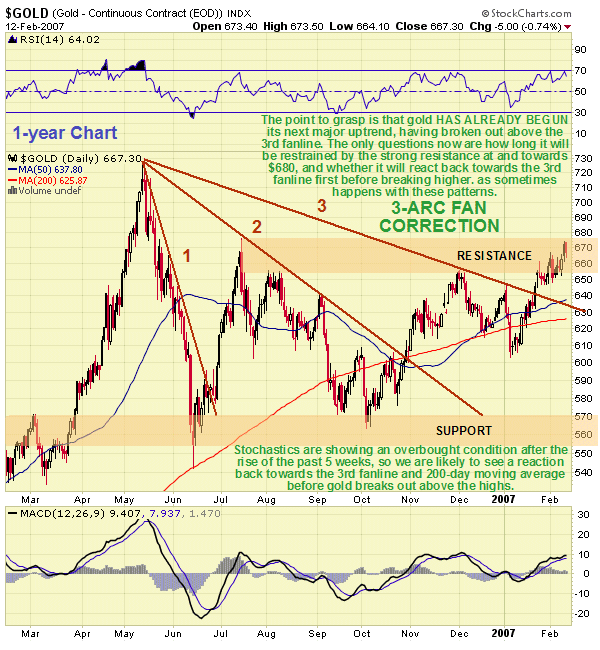
Gold has had a significant runup in the 5-week uptrend that began at the early January lows, and is now substantially overbought as shown by its Stochastics, making it vulnerable to a short-term reaction, especially as it is still in a zone of strong resistance, which would actually be a positive development in a sense, as long as it didn’t go too far, as it would unwind the overbought condition and thus put gold in better position to stage a convincing breakout. The RSI and MACD lines are not seriously overbought, on the other hand, and given that an overbought condition as shown by Stochastics can persist for a considerable time, gold may just go ahead and break above $680 soon anyway, overbought or not. Should gold react soon it is important that it does not break below the 3rd fanline and below the upper trendline shown on the long-term chart below. At this point in time these lines are crossing at about $630, with the 200-day moving average just beneath, making this an important support level where we would expect the price to find support on any short-term reaction.
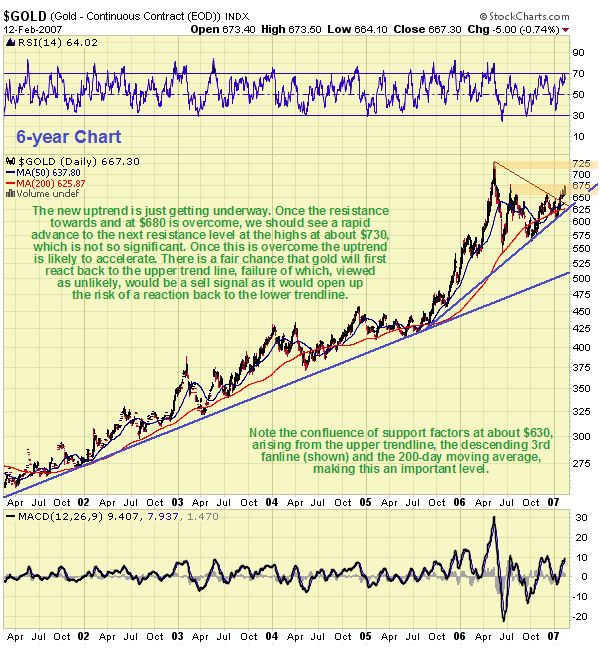
On the 6-year gold chart we can see its entire bull market to date, and how it accelerated dramatically in 2005, implying that if anyone was attempting to suppress gold, they weren’t making a very good job of it. After the big rise from mid-2005 through May 2006, gold was entitled to take a breather, hence the subsequent reactive phase which only ended with the breakout from the 3-arc Fan Correction a few weeks ago. While more aggressive traders will want to watch out for a short-term reaction, the bigger picture is that gold is believed to be on its way again, short-term reaction or not, and longer-term investors can safely ignore such minor fluctuations - only in the event of the upper trendline shown on the 6-year chart failing would they have reason to consider standing aside.
The dollar is worth taking a look at here as a resolution of the current standoff in the dollar will likely determine whether gold breaks higher or reacts back to the $635 area.
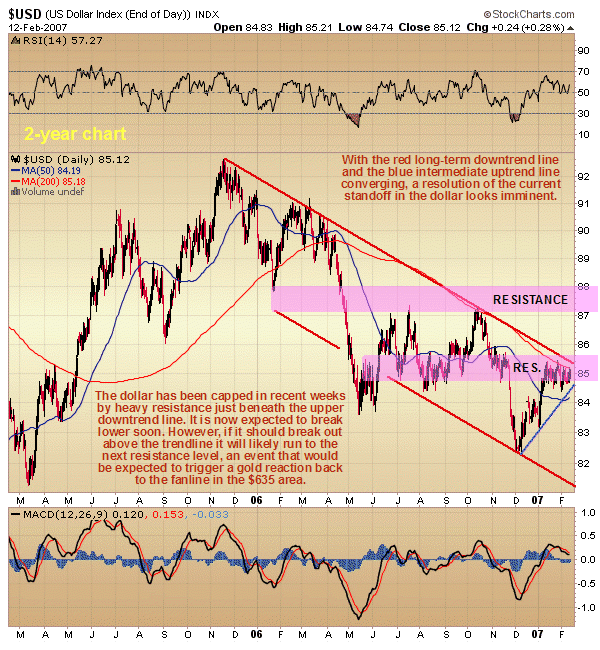
After its sharp runup early in January it was hardly surprising that the dollar ran out of steam where it did, as it had into 3 powerful restraining influences, its downtrend channel line, its falling 200-day moving average, and an important resistance level. As we can see on the chart, the intermediate uptrend has collided with the long-term downtrend. Normally this situation resolves with a break to the downside, but with the 50-day moving average turning up beneath the chances of an upside breakout are increasing, although not by much. This situation needs to be closely watched as a breakout one way or the other appears to be fast approaching - gold and silver are rather out on a limb now and should the dollar break higher here, it can be expected to run to the next resistance level, an event that would be expected to trigger a gold reaction back to the $635 area. Agile traders will clearly want to take appropriate measures in the event that the dollar breaks higher.
The interpretation here does represent a shift to a somewhat more cautious stance near-term than that presented in recent articles.
Silver Market Update
Clive Maund
Silver is believed to be slowly limbering up to take out the resistance at and towards last year’s highs, an event that can be expected to lead to a major advance. However, shorter-term the picture is not so bright.
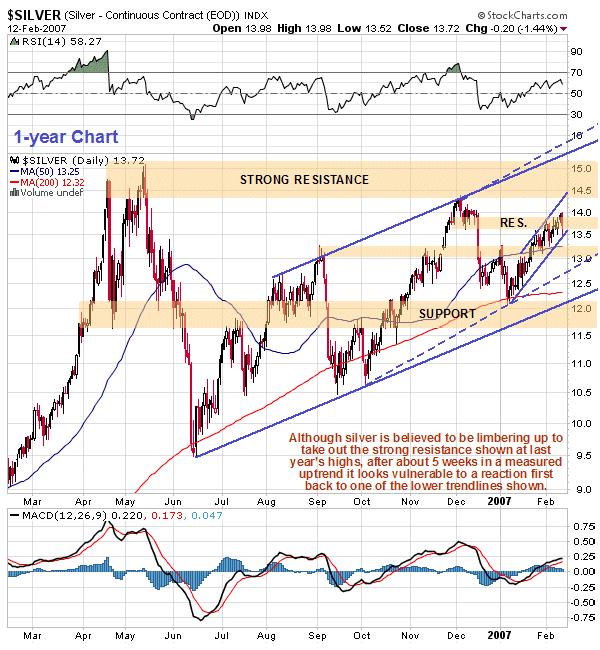
On the 1-year chart we can see how silver has made steady, measured progress within an uptrend that began after the December and early January sell off. This uptrend has brought the price back up to the broad zone of heavy resistance between about $13.50 and last year’s highs around $15. As we can see on the 1-year chart, periods of gradual ascent have in the past been followed by severe, if short-lived reactions, and after a 5-week gradual uptrend back into the zone of heavy resistance, the risk of another such sharp reaction is clearly increasing. The lack of dynamism on this advance is not liked and is viewed as increasing the risk of a short-term reaction. Silver could still break higher here, and may even gather the momentum to break clear above last year’s highs, but it is viewed as more likely that it will react first, probably back to the dotted uptrend line shown, an event that would be expected to synchronize with gold retreating back to support at its third fanline currently at about $635.
It is the dollar that holds the key to what happens next. The standoff in the dollar that has been going on for weeks, described in the Gold Market update, is due to be resolved soon, and the way the dollar breaks out will determine the immediate fate of gold and silver.
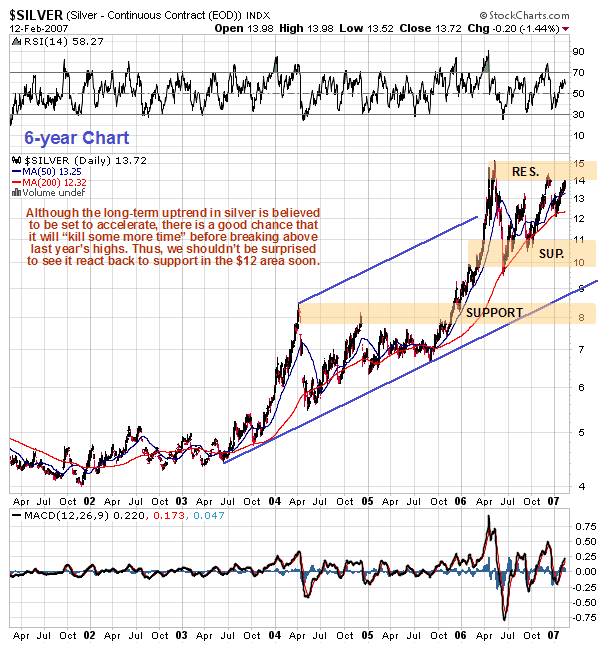
The long-term 6-year silver chart suggests that silver will likely need more time before it can break to new highs, but that any reaction from here is unlikely to be deep and can be expected to be followed by sideways trading within a relatively narrow range before the upside breakout occurs.
Clive Maund, Diploma Technical Analysis
Copiapo, Chile, 14 February 2007


