Gold Market Update


Gold's technicals have been looking very promising in the recent past, but there have been two worrying developments over the past couple of weeks which suggest that we may be about to see a vicious shakeout rather than the breakout to new highs that so many are anticipating. One of these developments has been the very high number of advisors calling for an upside breakout on public websites, as many of you will be aware, and the other is the trend of COT data, with the latest figures being at levels that have in the past almost always signalled a reversal to the downside.
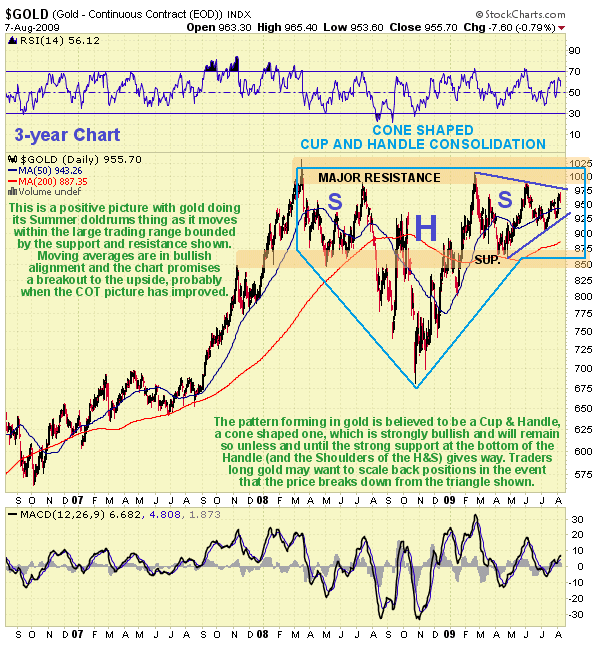
On the 3-year chart for gold we can see that the giant pattern which has developed in gold following the highs in March of last year can be interpreted as a bullish cone-shaped Cup & Handle consolidation pattern, or as a Head-and-Shoulders consolidation, or both at the same time, either or both of which imply an upside breakout soon. Negatively, the entire pattern can be interpreted as a Double Top. On the basis of this chart alone we would come down on the bullish side of the fence, favoring the Cup & Handle or the Head-and-Shoulders interpretation, especially as moving averages are in bullish alignment and as we are closing in on the most seasonally bullish month of the year for gold, September. However, there are other important factors that give grounds for caution at this point.
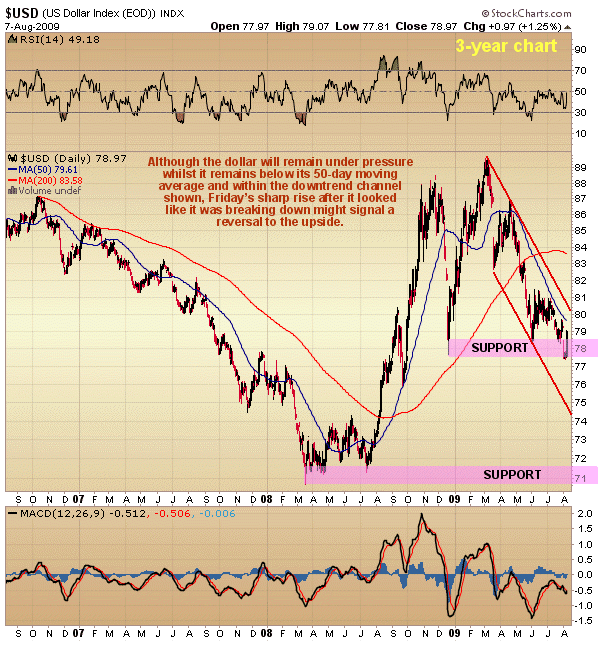
One factor giving grounds for concern is the dollar, which looked like it was breaking down last week, but then suddenly rallied strongly on Friday, which MAY mark an intermediate reversal. As we can see on the 3-year chart for the dollar index, despite the strength of Friday's rally, the dollar will remain under pressure whilst it is below its falling 50-day moving average and within the downtrend channel shown. However, a breakout above these constraining factors could lead to a sizeable rally, which would fit with the picture for Treasuries, where both short dated bills and long dated bonds are in position to rally off support.
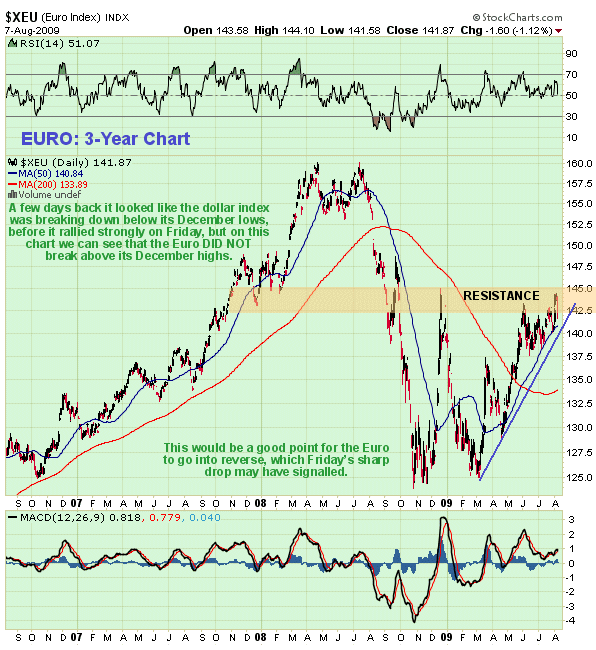
Although many were writing off the dollar again last week, because of its marginal breach of support, it is interesting to observe that the Euro DID NOT break above the resistance shown on our 3-year chart, and although the uptrend in force from March has not yet failed it can be seen that this would be a good point for the Euro to go into reverse.
More ominous still for gold is the number of advisors calling for an upside breakout very soon and the latest COT data. The number of writers calling for an upside breakout has risen to a very high level, and this has been found in the past to be a contrary indicator. Meanwhile the COT chart shows that Large Spec long positions and Commercial short positions have risen to an extreme that has in the past correlated with a reversal to the downside.
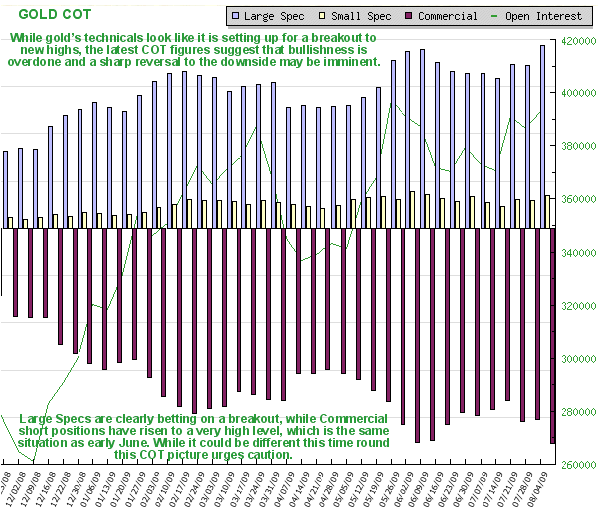
So how do we reconcile the seemingly very bullish chart pattern for gold with the seemingly bearish COT data? Whilst recognising that gold could climb in the face of Large Spec long and Commercial short positions rising to even greater extremes, a more likely scenario is that Big Money is preparing an ambush - a sharp reversal to the downside to shake the little guy out and scoop up his gold and PM stocks at knockdown prices before prices reverse again to the upside and then the breakout to new highs occurs. This scenario is described in more detail in the article BIG MONEY'S game plan to FLEECE GOLDBUGS ahead of THE BIG ONE.
A complicating factor that could exacerbate the downside in PM stocks should gold and silver break lower will be if the broad stockmarket goes into correction mode at the same time. This looks likely as Abbey Joseph Cohen appeared on CNBC last week proclaiming a new bullmarket, which has been found to be one of the most reliable indicators that we are close to an intermediate top in the market at least.
The state of indecision in the gold market at this time is amply illustrated by the development of a Symmetrical Triangle on shown on our 3-year gold chart, and as the price must soon break out one way or the other from this pattern, the standoff should soon resolve itself.
In the last update it was pointed out that silver looked stronger than gold, and it has since outperformed gold significantly, which in itself is a warning that the uptrend in the broad stockmarket is mature. However, the larger trend for silver must be classified as neutral at this time.
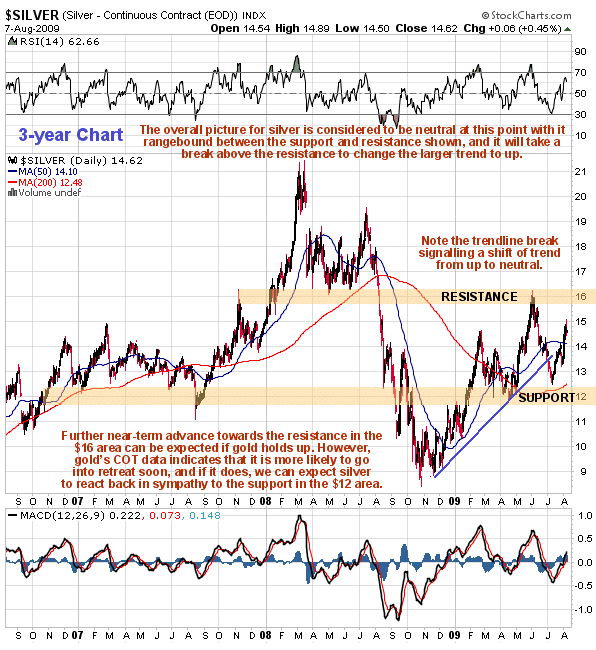
On its 3-year chart we can see that although silver has rallied well in recent weeks it is confronted with a line of heavy resistance in the $16 area which is expected to keep a lid on it, except in the event that gold succeeds in breaking out to new highs, in which case silver could vault this resistance and then proceed to work its way through the remaining resistance approaching its highs. The first and only time it approached the resistance in the $16 in the recent past was in late May / early June whereupon it got smacked down hard, and the subsequent failure of the uptrend in force from last November switched the intermediate trend from up to neutral, which is why silver is now considered to be rangebound between the support and resistance shown, and a trading buy towards the bottom of this range with a stop under the support and a trading sell towards the top of it with a stop above the resistance.
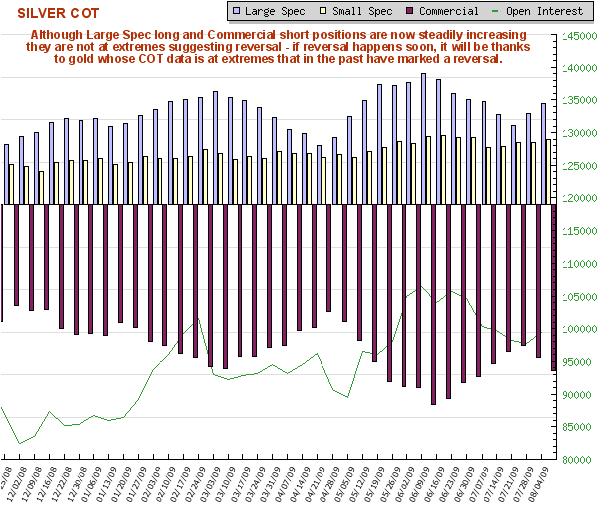
Silver's COT chart has looked considerably more positive than gold for some weeks, but now the Large Spec long and Commercial short positions are climbing, although they are not yet at the extreme levels suggestive of a reversal. However, the matter may well be decided by gold, whose COT chart is already showing extreme readings. Clearly, if gold holds up for a while longer, silver may motor up to the $16 area again, but if gold breaks down sidekick silver will get kicked down again.
Clive Maund, Diploma Technical Analysis
[email protected]
www.clivemaund.com
Copiapo, Chile, 9 August 2009

Clive P. Maund’s interest in markets started when, as an aimless youth searching for direction in his mid-20’s, he inherited some money. Unfortunately it was not enough to live a utopian lifestyle as a playboy or retire very young. Therefore on the advice of his brother, he bought a load of British Petroleum stock, which promptly went up 20% in the space of a few weeks. Clive sold them at the top…which really fired his imagination. The prospect of being able to buy securities and sell them later at a higher price, and make money for doing little or no work was most attractive – and so the quest began, especially as he had been further stoked up by watching from the sidelines with a mixture of fascination and envy as fortunes were made in the roaring gold and silver bull market of the late 70’s.
Clive furthered his education in Technical Analysis or charting by ordering various good books from the US and by applying what he learned at work on an everyday basis. He also obtained the UK Society of Technical Analysts’ Diploma.
The years following 2005 saw the boom phase of the Gold and Silver bull market, until they peaked in late 2011. While there is ongoing debate about whether that was the final high, it is not believed to be because of the continuing global debasement of fiat currency. The bear market since 2011 is viewed as being very similar to the 2-year reaction in the mid-70’s, which was preceded by a powerful advance and was followed by a gigantic parabolic price ramp. Moreover, Precious Metals should come back into their own when the various asset bubbles elsewhere burst, which looks set to happen anytime soon.
Visit Clive at his website: CliveMaund.com


