Gold Market Update - Dollar Rally may Trigger Correction......
 share
share
 share
share
 share
share
 share
share
 share
share
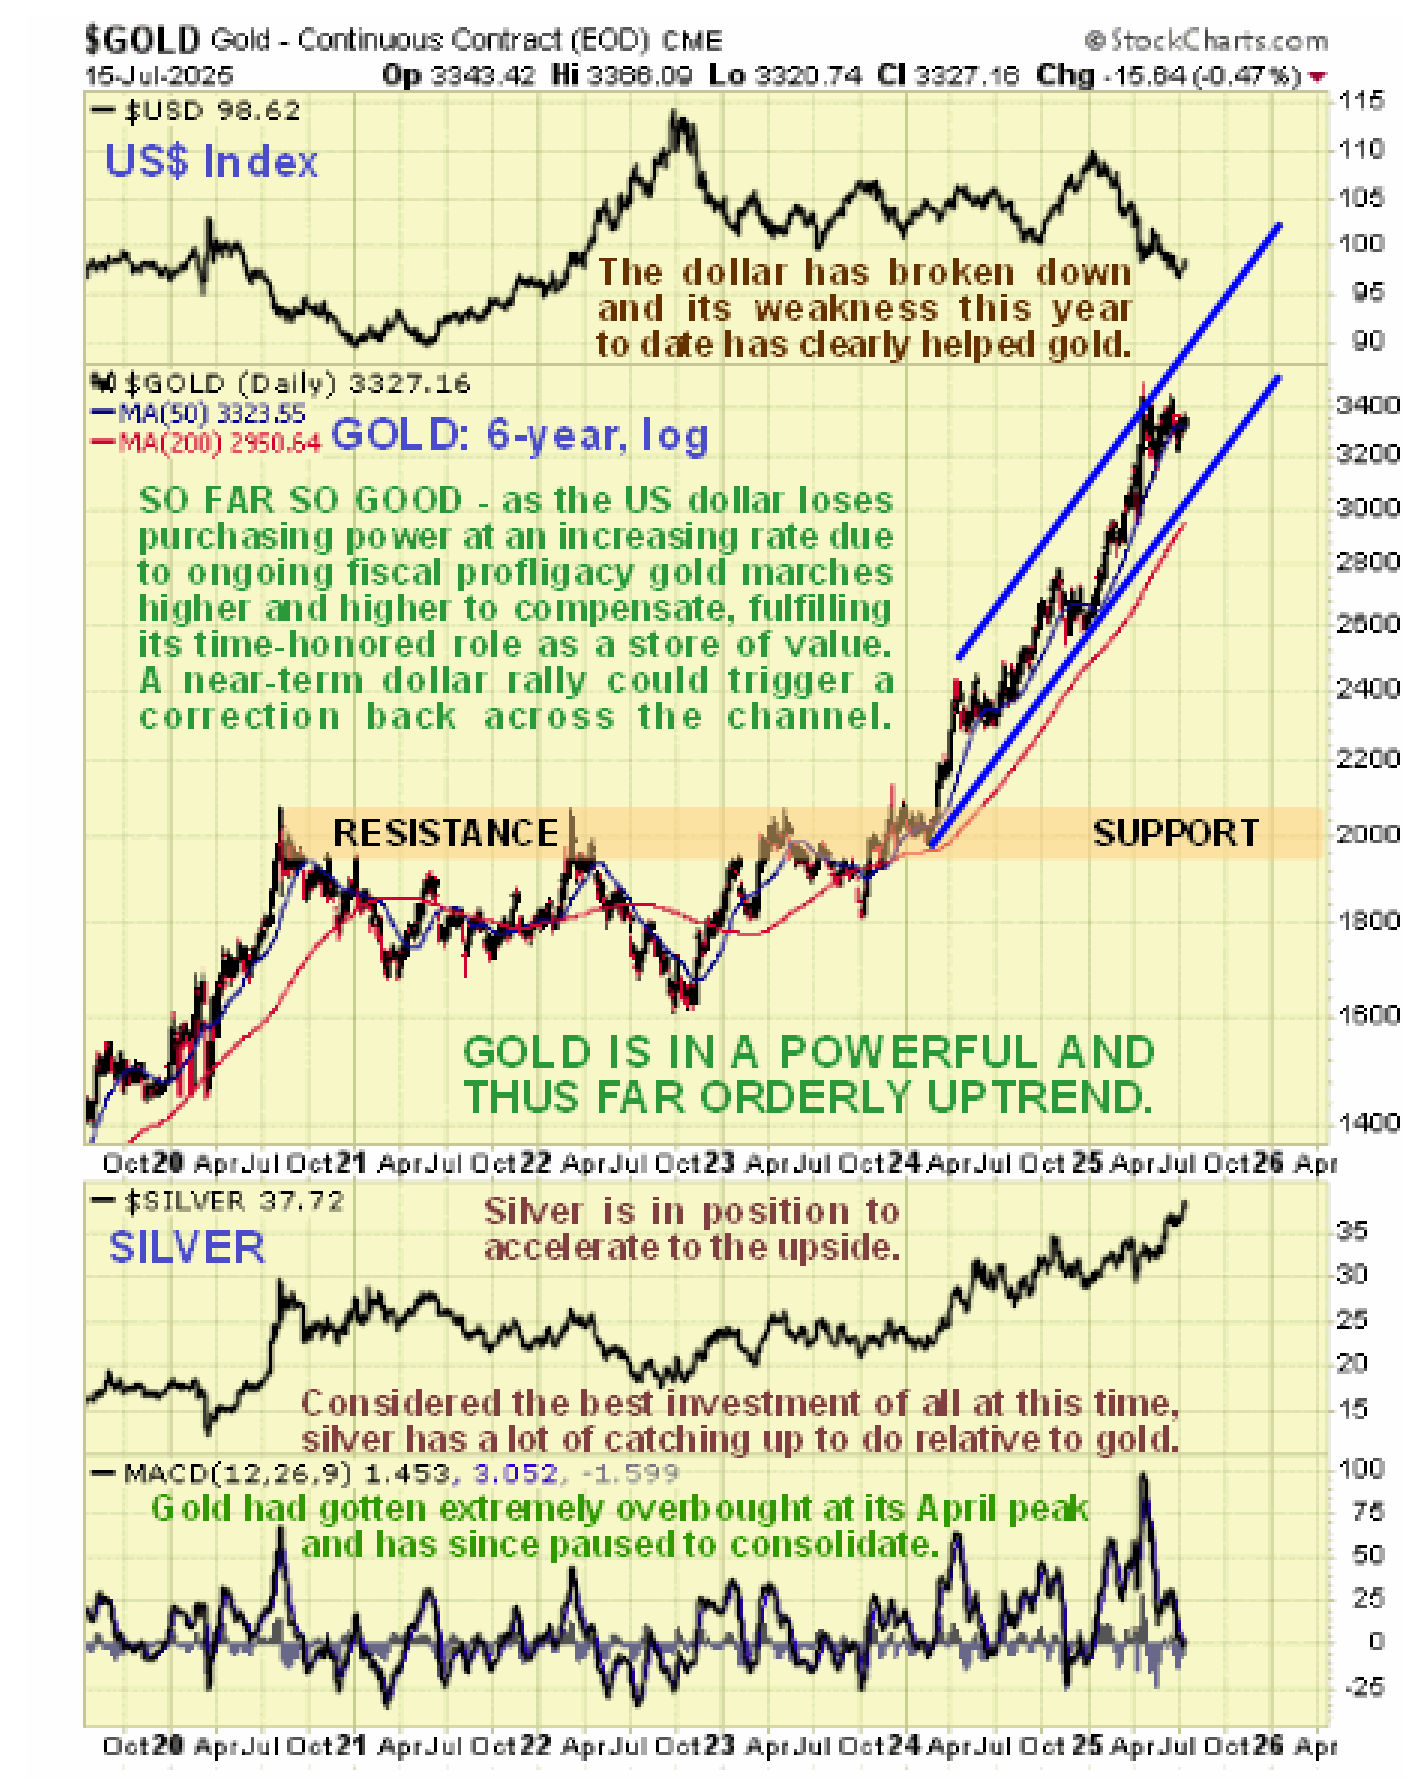
Gold is in a powerful bull market that in due course is set to continue and to accelerate in the face of reckless and relentless money creation. Near-term, however, there is some risk of a (modest) correction which would be caused by a countertrend rally in the dollar.
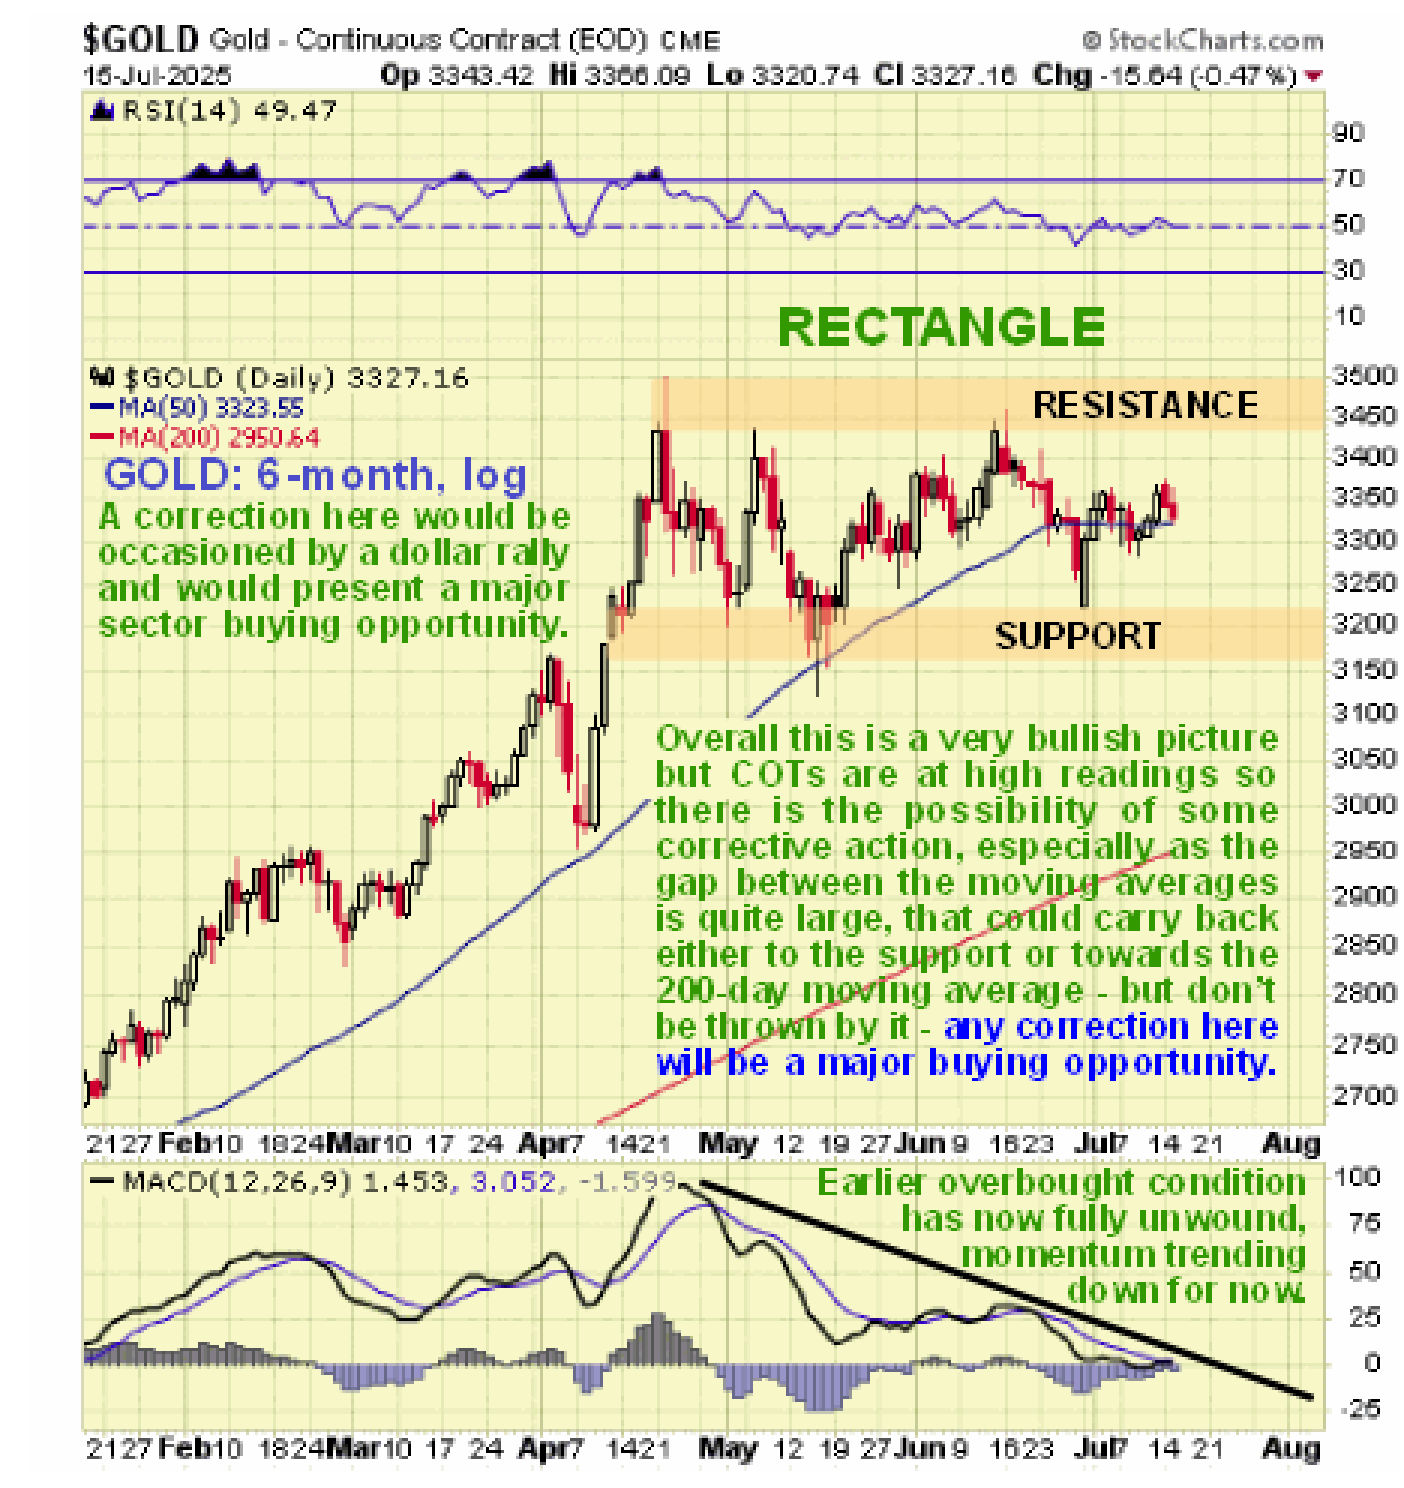
On its 6-month chart we can see that, following a strong runup in the Spring, gold hit a peak in April and has since run off sideways marking out a rectangular trading range. On the positive side the duration of this range has allowed time for the earlier heavily overbought condition to completely unwind and for the moving averages to close the gap with the price – fully in the case of the 50-day and partially in the case of the 200-day. Negatively, there is still a quite large gap between these moving averages which increases the risk of its breaching the support at the lower boundary of the range and correcting back towards its rising 200-day moving average, especially as upside momentum (MACD) has now ebbed away to nothing but that said this bull market is so powerful that it is unlikely to drop back that far and any such reaction will be viewed as presenting a major buying opportunity.
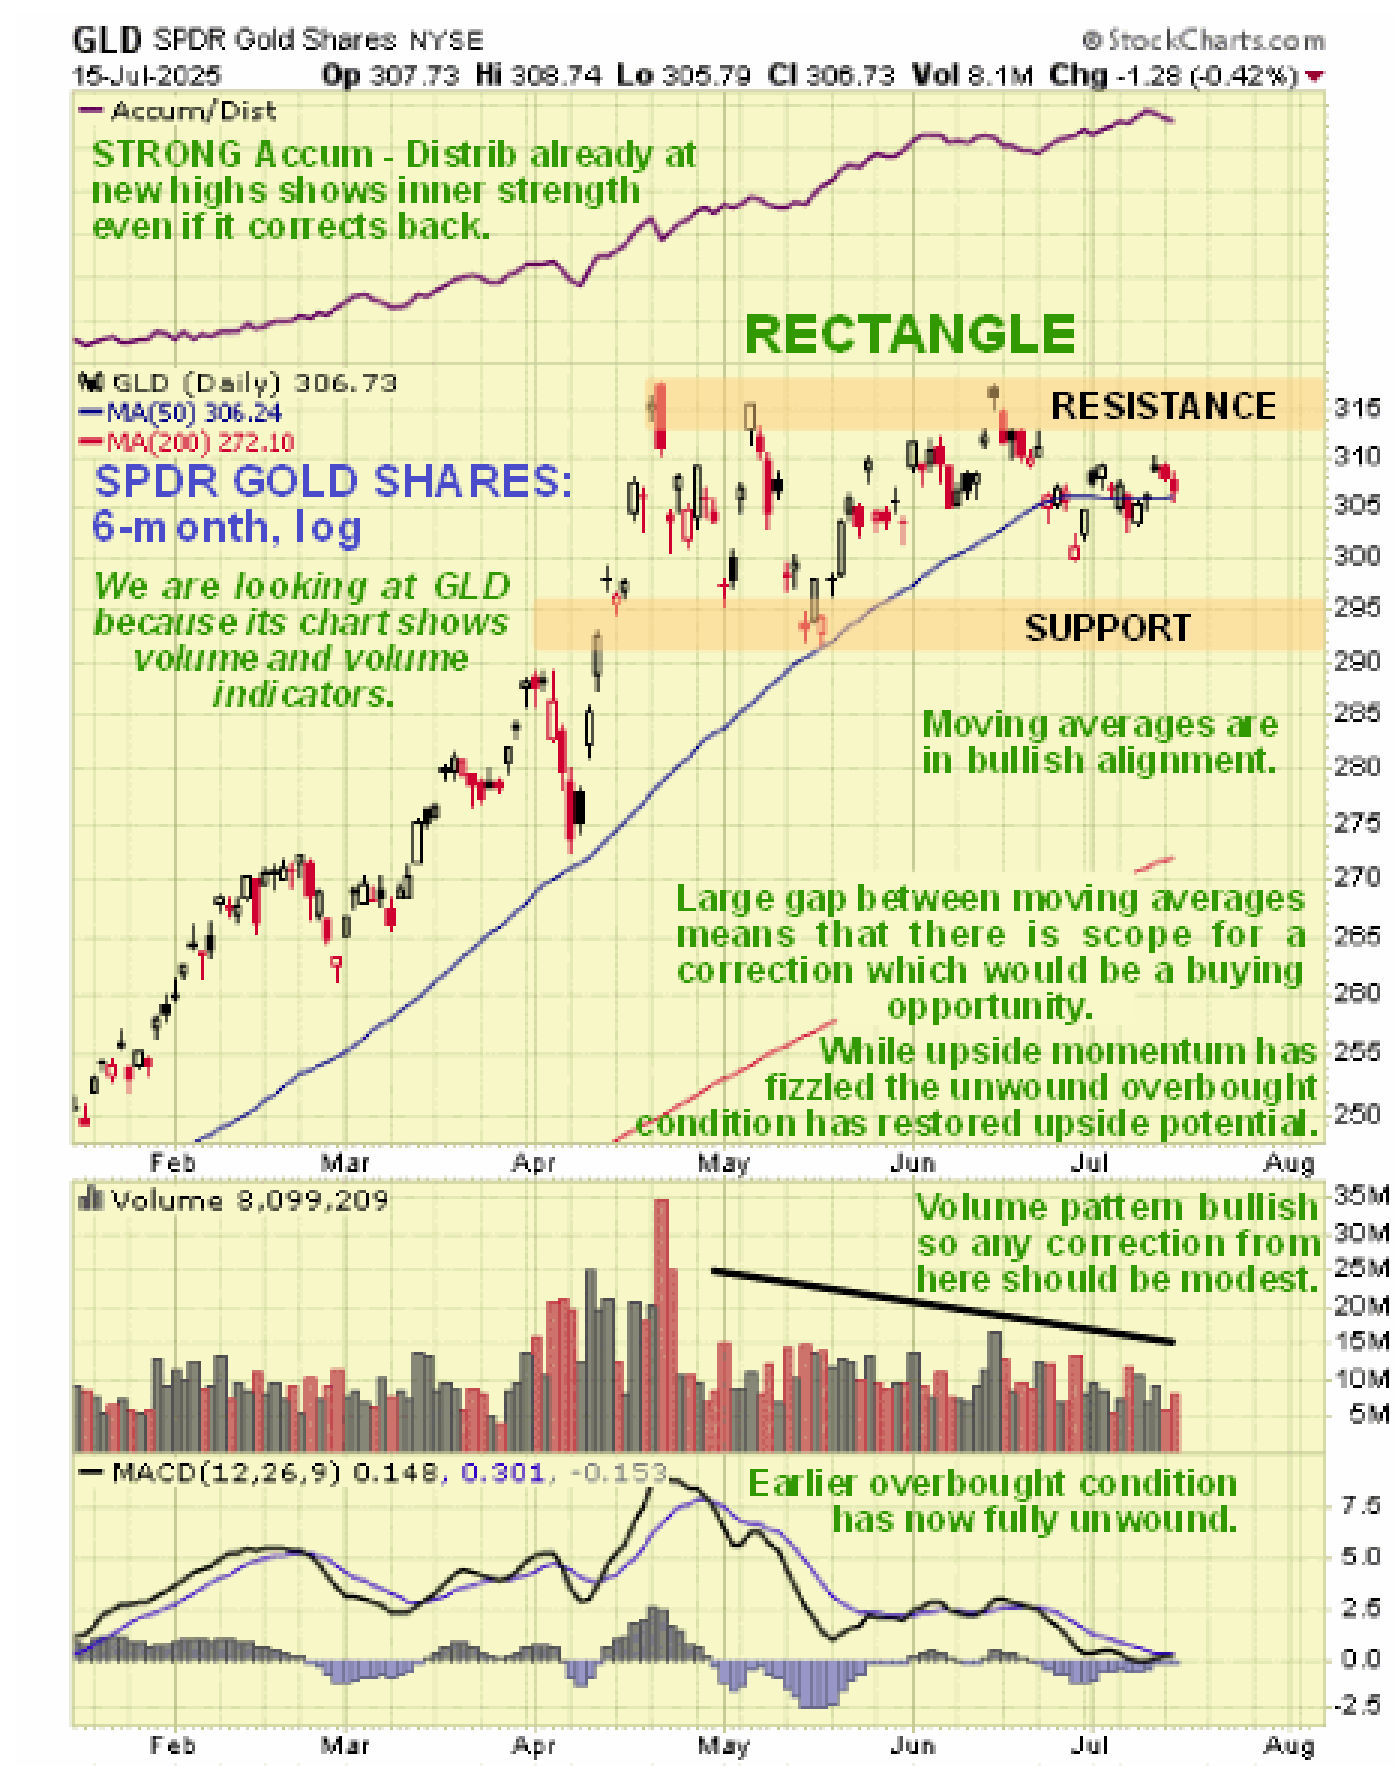
We are hampered by not having volume or volume indicators on this Stockcharts gold chart but we can get around that by using the chart for faithful gold proxy SPDR Gold Shares for the same time period of 6 months. On this chart we can see that the volume pattern is overall positive, with it dropping back as the rectangular trading range has built out from the April peak, which is why the Accumulation line has remained so strong, even rising to clear new highs as the range has formed. By itself this is quite strongly bullish and it suggests that if a correction does manifest as a result of temporary dollar strength, it is likely to be shallow and probably quite short lived.
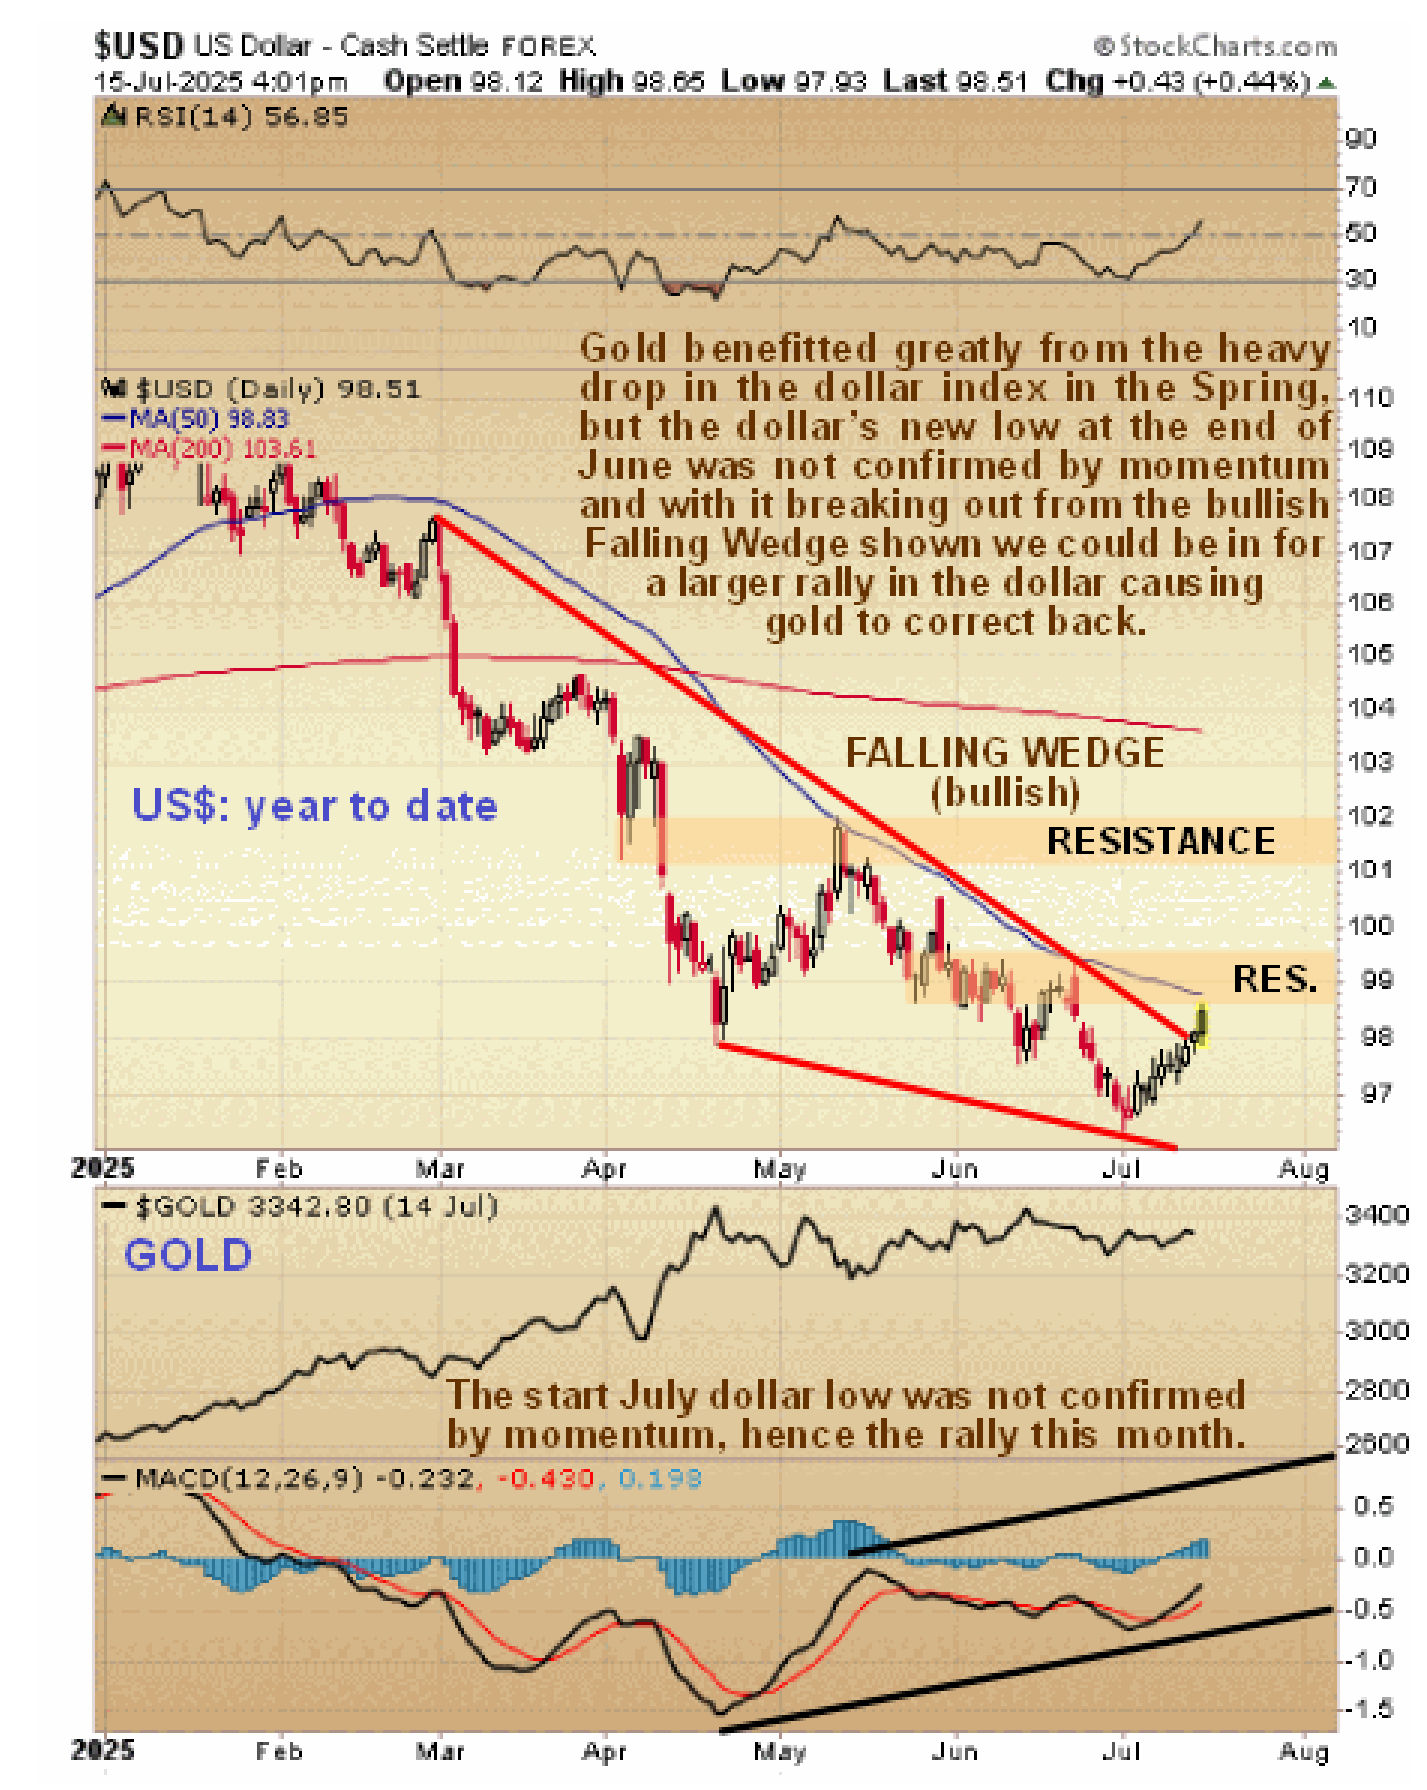
Alright, so why might the dollar rally, at least temporarily? To see why we will look at the 6-month chart for the dollar index. Here we see at once the reason for gold’s big rally in the Spring – the dollar index fell and fell hard into mid-April but notice how the later drop into the late June – early July low was much more measured which is why the MACD indicator did not drop anywhere near as low as where it got to in April, meaning that there was a significant diminution in downside momentum on the later drop with the later low not confirmed by the MACD indicator which is an early warning of a possible trend change, if only temporarily. Visually we can see a marked convergence of the downtrend from early March which means that it is a bullish Falling Wedge. Speculating on why the dollar index could rally from here is of course a waste of time – what matters is that this chart suggests that a rally is starting. How far might it get?. Given that the dollar is now in a severe bear market due to unbridled money creation in the face of a failed Treasury market – the Fed is buying all this garbage – all we can expect to see here is a countertrend rally and if it carries beyond the nearby resistance shown it will likely target the next significant resistance towards 102. Best case is a rally to the 103 – 103.5 area near to the falling 200-day moving average. An important point to keep in mind is that even if the dollar index does rally, it does not mean intrinsic dollar strength – if would simply be rallying against other currencies and since they are all “circling the drain” it means that gold’s bull market cannot be stopped and is likely to accelerate, although as mentioned earlier, such a dollar index rally cause trigger a modest gold correction.
The 6-year chart for gold puts things in perspective and reminds us that if gold breaks down from its current trading range and corrects back it will be “no big deal” as the correction is likely to terminate at the lower rail of its parallel uptrend channel above its rising 200-day moving average.
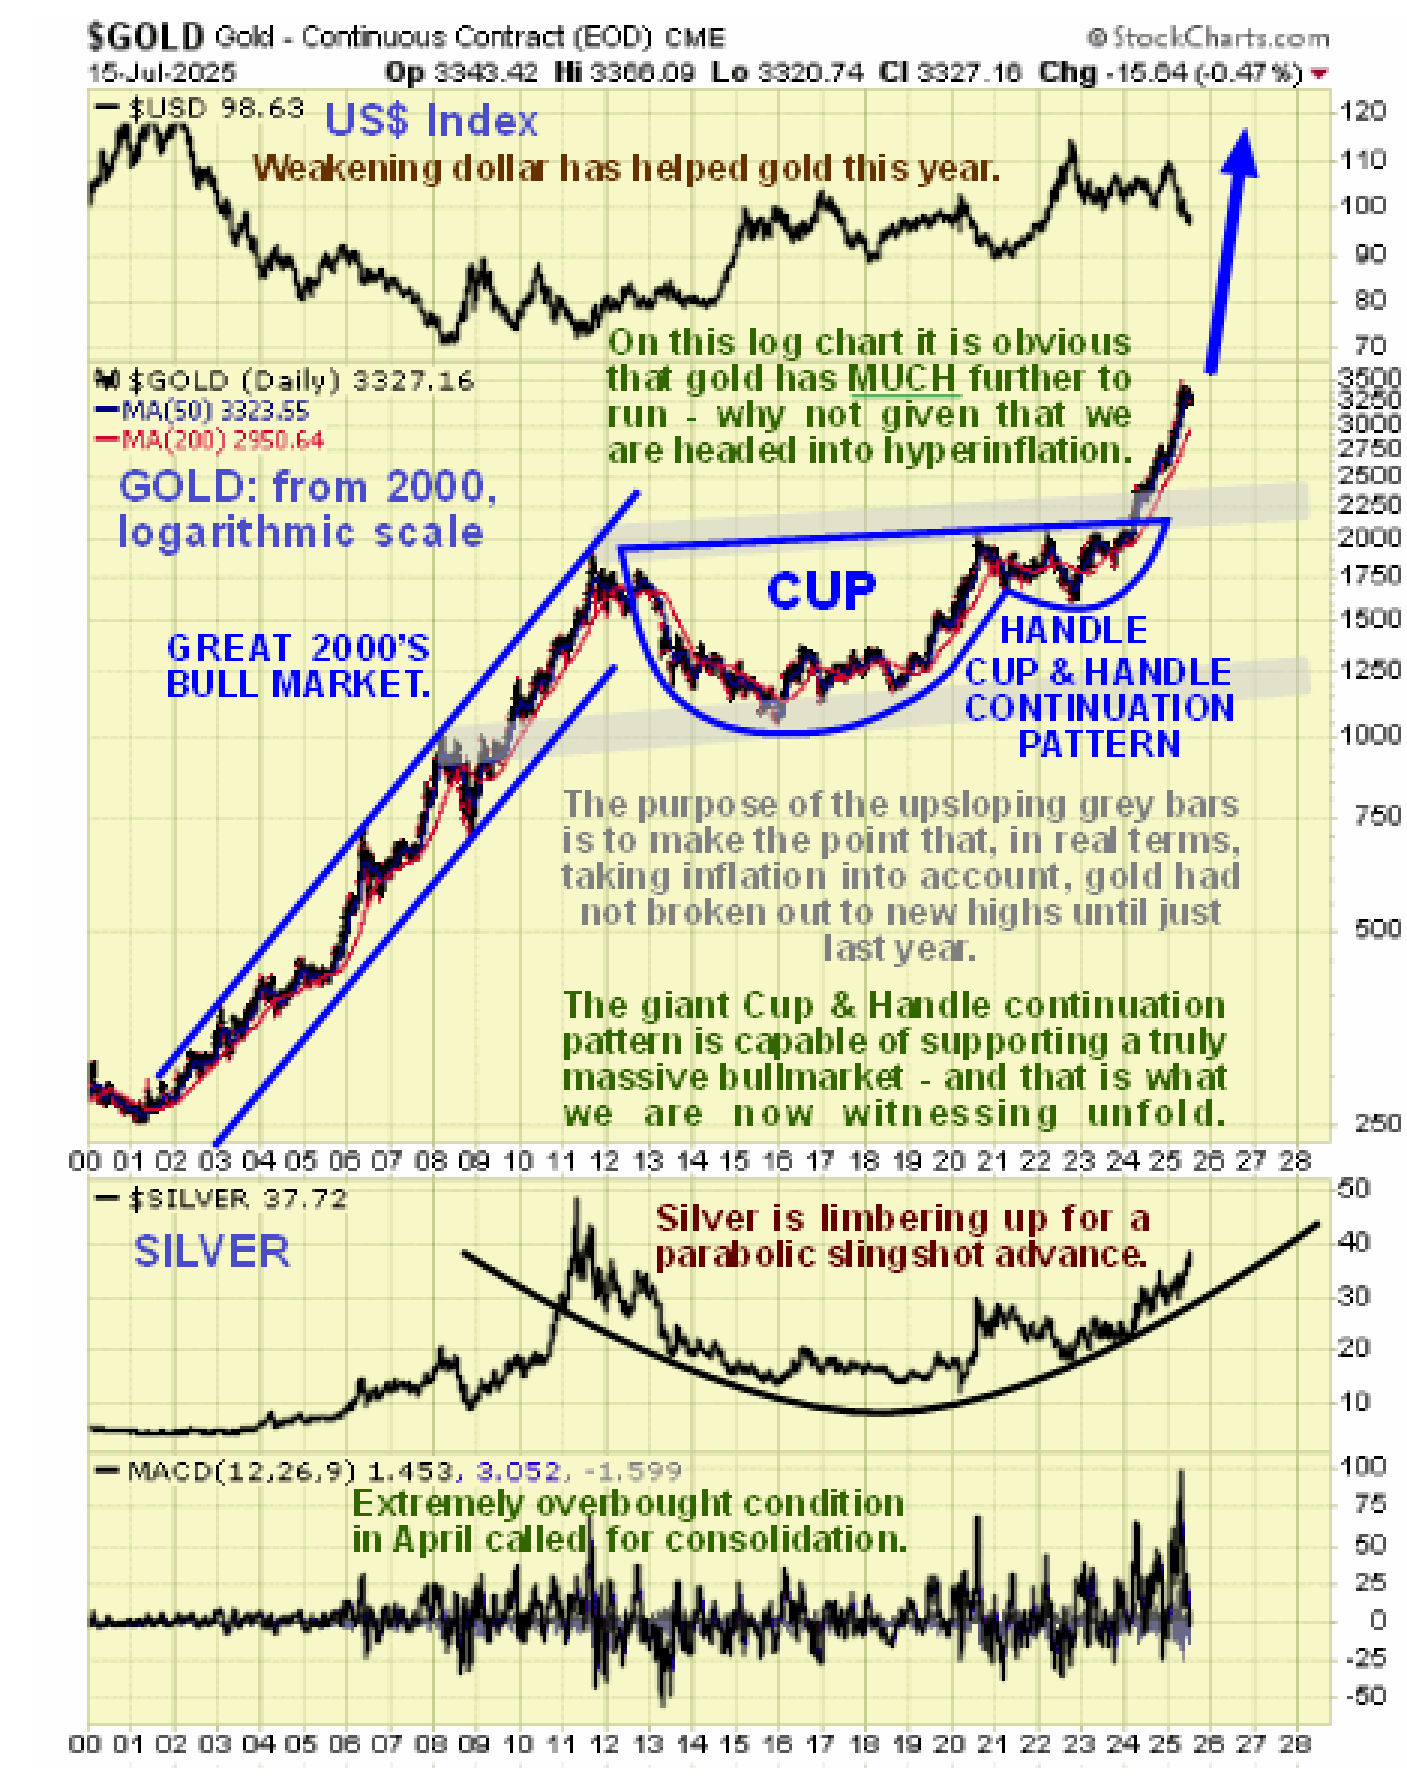
Zooming out again via a very long-term log-scale chart going all the way back to the start of the millenium, i.e. to the year 2000, affords us an overall Big Picture perspective. This chart makes clear that the breakout early last year from the large trading range that started to form in the middle of 2020 actually marked the breakout from the Handle of a gigantic Cup & Handle continuation pattern that started to form as far back as 2012. This is a truly enormous consolidation pattern that certainly has the capability to support a correspondingly big bull market and as we are only about 16 months into this major new bull market, it clearly has much further to run.
For Technical Analysis on individual gold and silver stocks please go to clivemaund.com
Management wishing to apply for reports encompassing complete fundamental analysis of their company by consultant economic geologist Nigel Maund combined with Technical Analysis of its stock by chart analyst Clive Maund please visit Great Reset Gold (greatresetgold.com).
*********
share
share
share
share
share

Clive P. Maund’s interest in markets started when, as an aimless youth searching for direction in his mid-20’s, he inherited some money. Unfortunately it was not enough to live a utopian lifestyle as a playboy or retire very young. Therefore on the advice of his brother, he bought a load of British Petroleum stock, which promptly went up 20% in the space of a few weeks. Clive sold them at the top…which really fired his imagination. The prospect of being able to buy securities and sell them later at a higher price, and make money for doing little or no work was most attractive – and so the quest began, especially as he had been further stoked up by watching from the sidelines with a mixture of fascination and envy as fortunes were made in the roaring gold and silver bull market of the late 70’s.
Clive furthered his education in Technical Analysis or charting by ordering various good books from the US and by applying what he learned at work on an everyday basis. He also obtained the UK Society of Technical Analysts’ Diploma.
The years following 2005 saw the boom phase of the Gold and Silver bull market, until they peaked in late 2011. While there is ongoing debate about whether that was the final high, it is not believed to be because of the continuing global debasement of fiat currency. The bear market since 2011 is viewed as being very similar to the 2-year reaction in the mid-70’s, which was preceded by a powerful advance and was followed by a gigantic parabolic price ramp. Moreover, Precious Metals should come back into their own when the various asset bubbles elsewhere burst, which looks set to happen anytime soon.
Visit Clive at his website: CliveMaund.com
More from Gold-Eagle