Gold Market Update: At Major Inflexion Point...


In a sense, gold’s price in fiat is irrelevant, because it has intrinsic value that is timeless. With fiat money trending ever more rapidly towards becoming utterly worthless, really the only reason that we track gold’s price against various currencies is to try and identify those times when we can get the most gold for our fiat while we still can.
With respect to gold’s performance relative to fiat for the balance of this year, there are two big factors in play. One is whether and when the BRICS or perhaps China / Russia will introduce a new gold-backed currency, and that apparently may be decided as soon as the 22nd of this month, when the BRICS are having a big important meeting. The other is the possible impact of a Fall market crash precipitated by a worsening banking crisis as a result of persistent relatively high interest rates. With respect to the former, if the BRICS or China / Russia do launch a gold-backed currency soon it will put the final nail in the dollar’s coffin and can be expected to send the dollar into a tailspin that will obviously benefit the dollar price of gold. With respect to the latter a market crash would be expected to depress the price of gold temporarily due to a knee-jerk reaction into the dollar, but not as much as in 2008, and it should come roaring back strongly as soon as it is clear that the crash phase is done. Even so, PM stocks would probably be slammed due to margin calls and the usual indiscriminate dumping, but then they too should bounce back strongly.
There is always talk about the gold (and silver) price being artificially suppressed. We don’t talk about market manipulation much because we take it for granted that where markets can be manipulated they will be but suffice it to say that to whatever extent gold and silver prices are being held in restraint by manipulative forces is the extent to which, when the pressure to regress to the mean becomes strong enough, they will break free of the restraint and rocket higher, probably overshooting to the upside.
So, having considered the main factors currently in play let’s now proceed to review the charts.
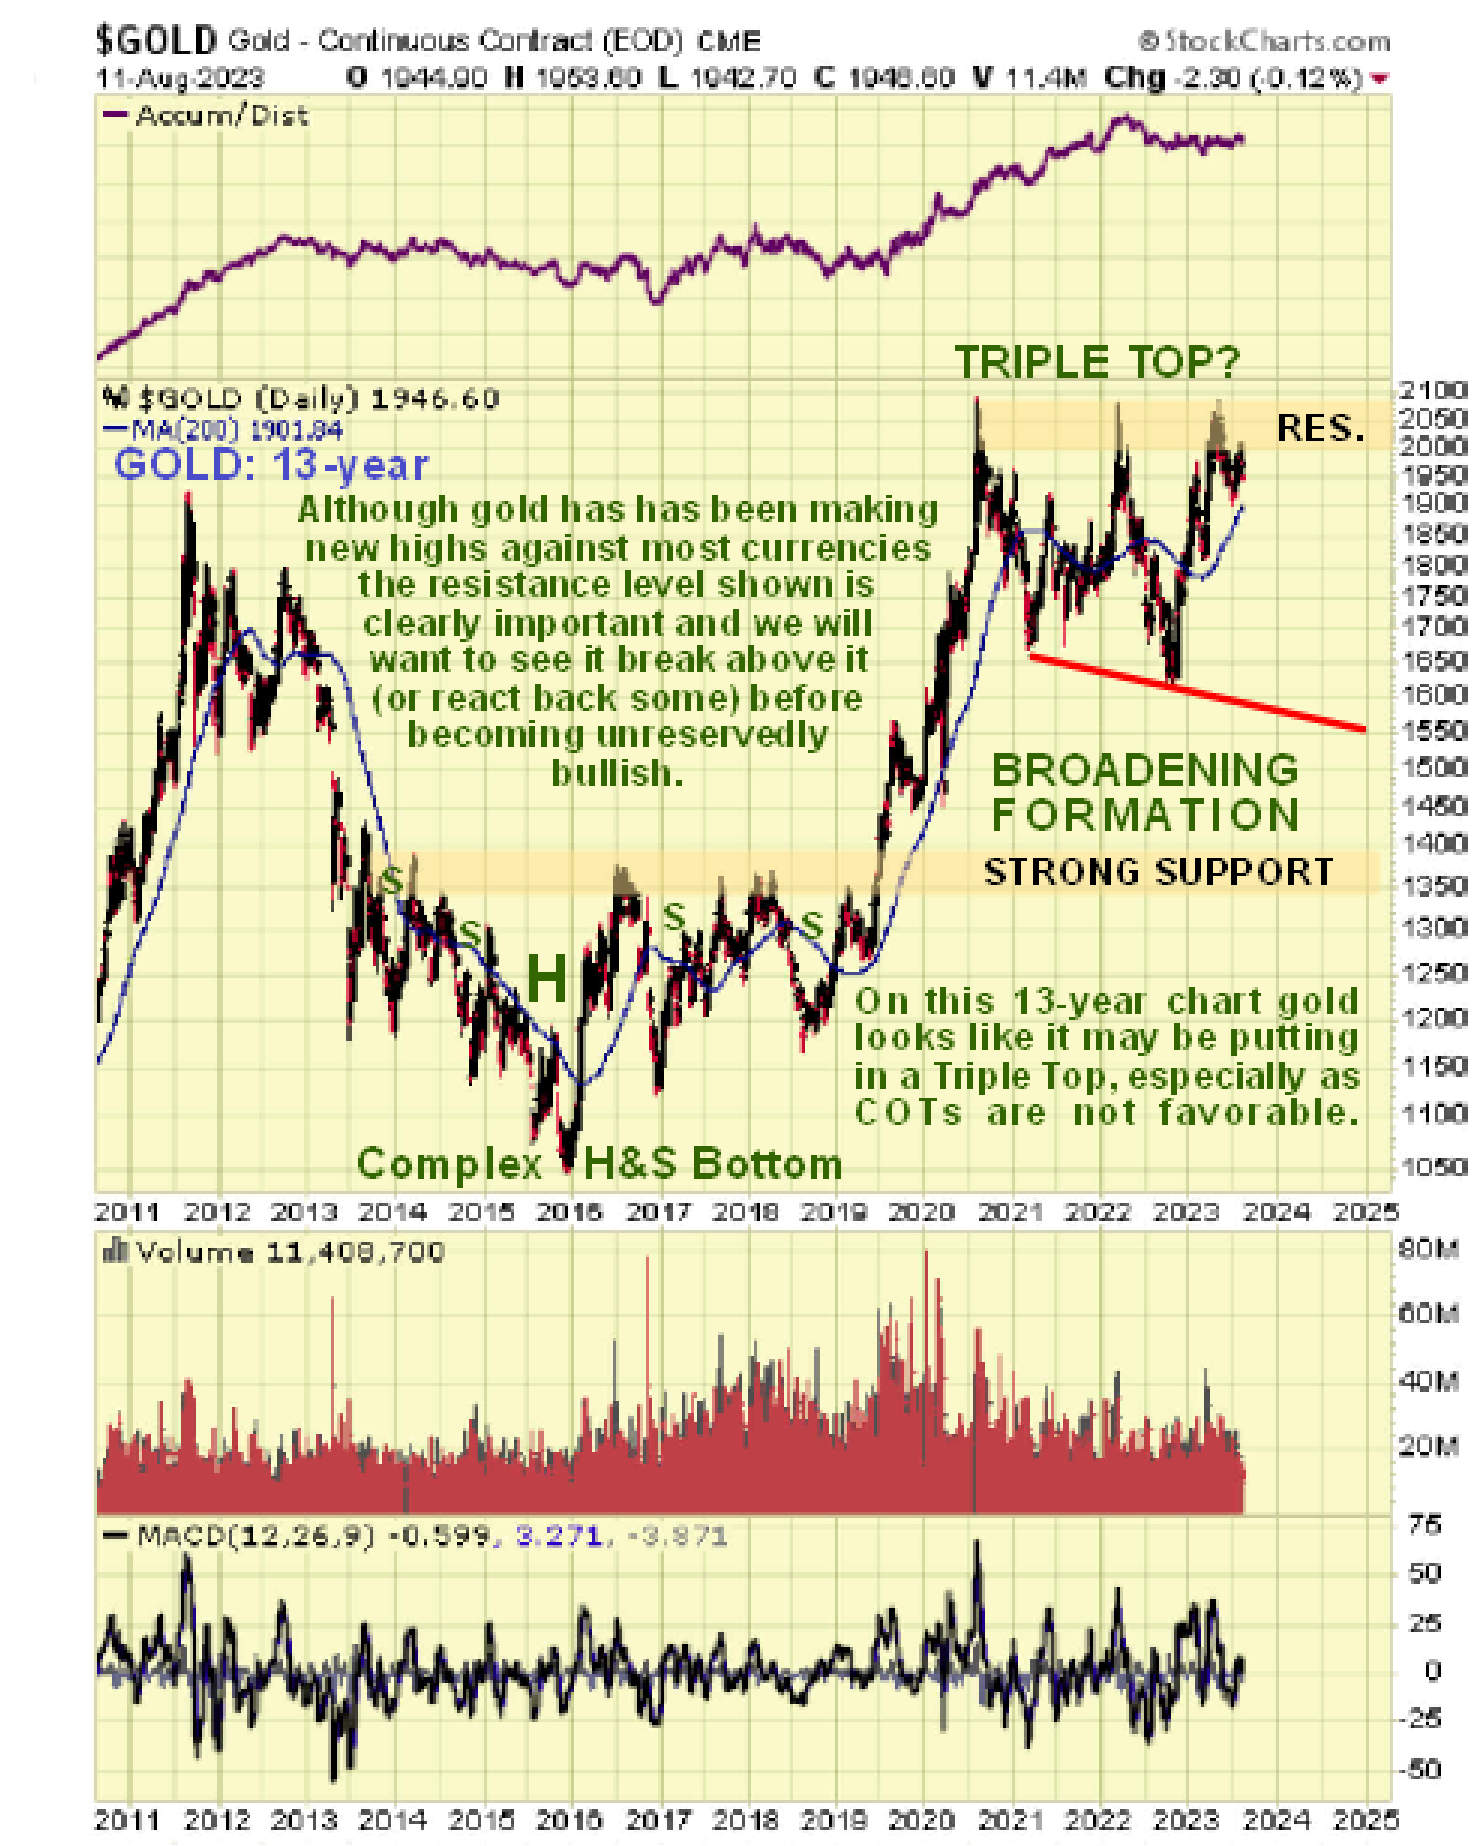
Starting the with long-term 13-year chart for gold in US dollars we should begin by reminding ourselves that gold has already broken out above its 2011 highs, which is did as a result of the big rally in 2019 and 2020 but following its mid-2020 peak it has been stuck in a giant trading range. Including the 2020 top it has run at the resistance at the top of this trading range 3 times now and it is currently hovering not far below it. So if the BRICS do launch a gold-backed currency soon then clearly it could break above it into a strong upleg. However, if they don’t and a Fall market crash ensues, then there is scope for gold to drop away but given its current high level it is considered unlikely that it will drop below the red line on the chart, which marks the lower boundary of the slightly broadening trading range. In this scenario, depending on how markets look at the time, gold and PM sector investments would drop to “fire sale” prices ahead of a probable massive recovery rally.
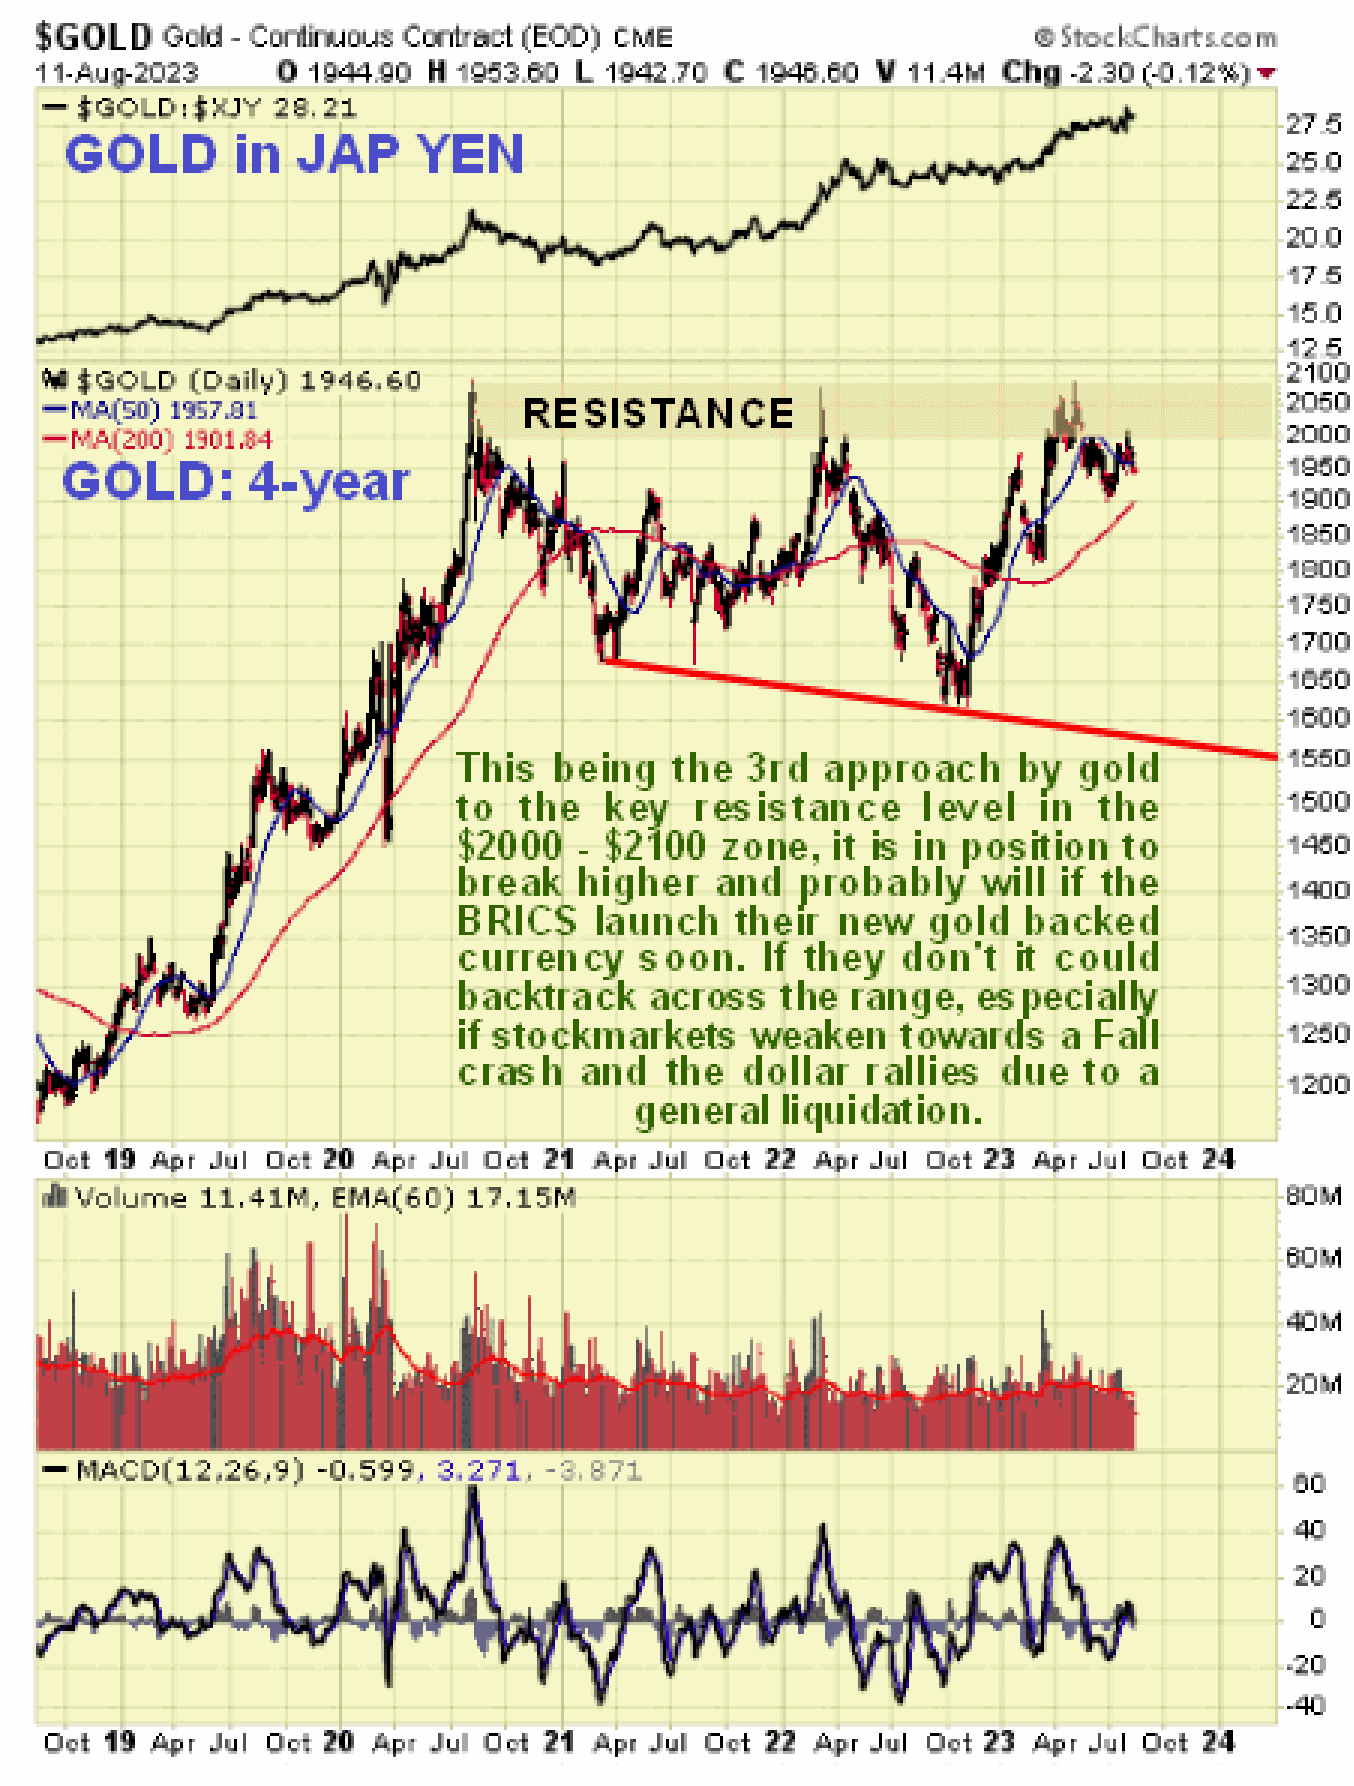
On the 4-year gold chart we can see the 2020 and 2021 runup and the big trading range that followed in detail. This trading rnge has been going on for a long time now - 3 years - but it is important to note that gold has not been static against some other important currencies, such as the Japanese Yen shown at the top of this chart. The resistance level at the top of the trading range in the $2000 - $2100 zone is clearly very important, so if gold succeeds in breaking above this it is likely to trigger a major uptrend.
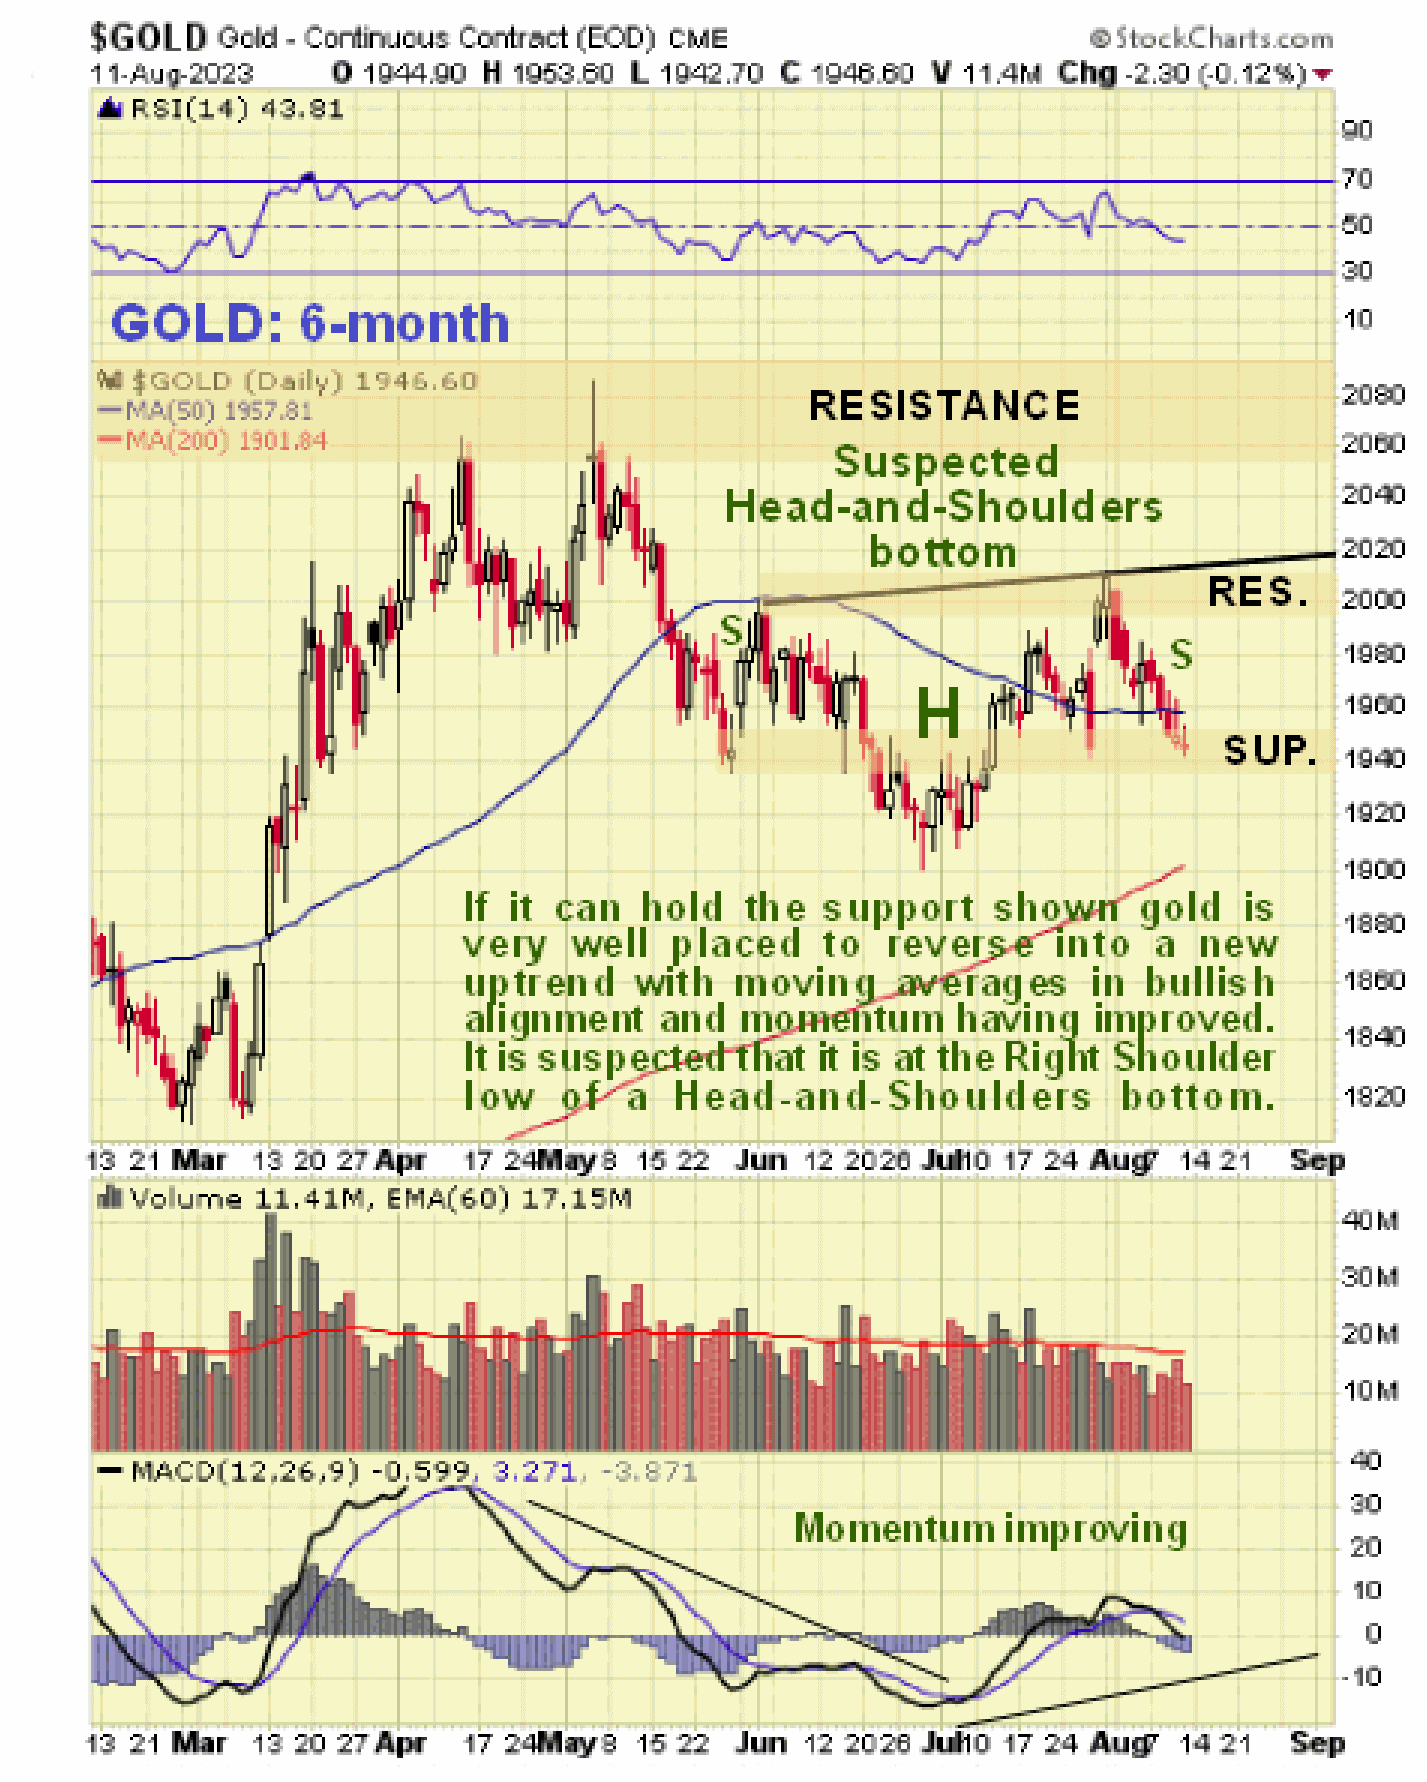
Gold’s 6-month chart does look encouraging as it appears to right now be at the Right Shoulder low of a suspected high level Head-and-Shoulders bottom, an interpretation that is given support by the very positive alignment of its moving averages and the improving momentum (MACD).
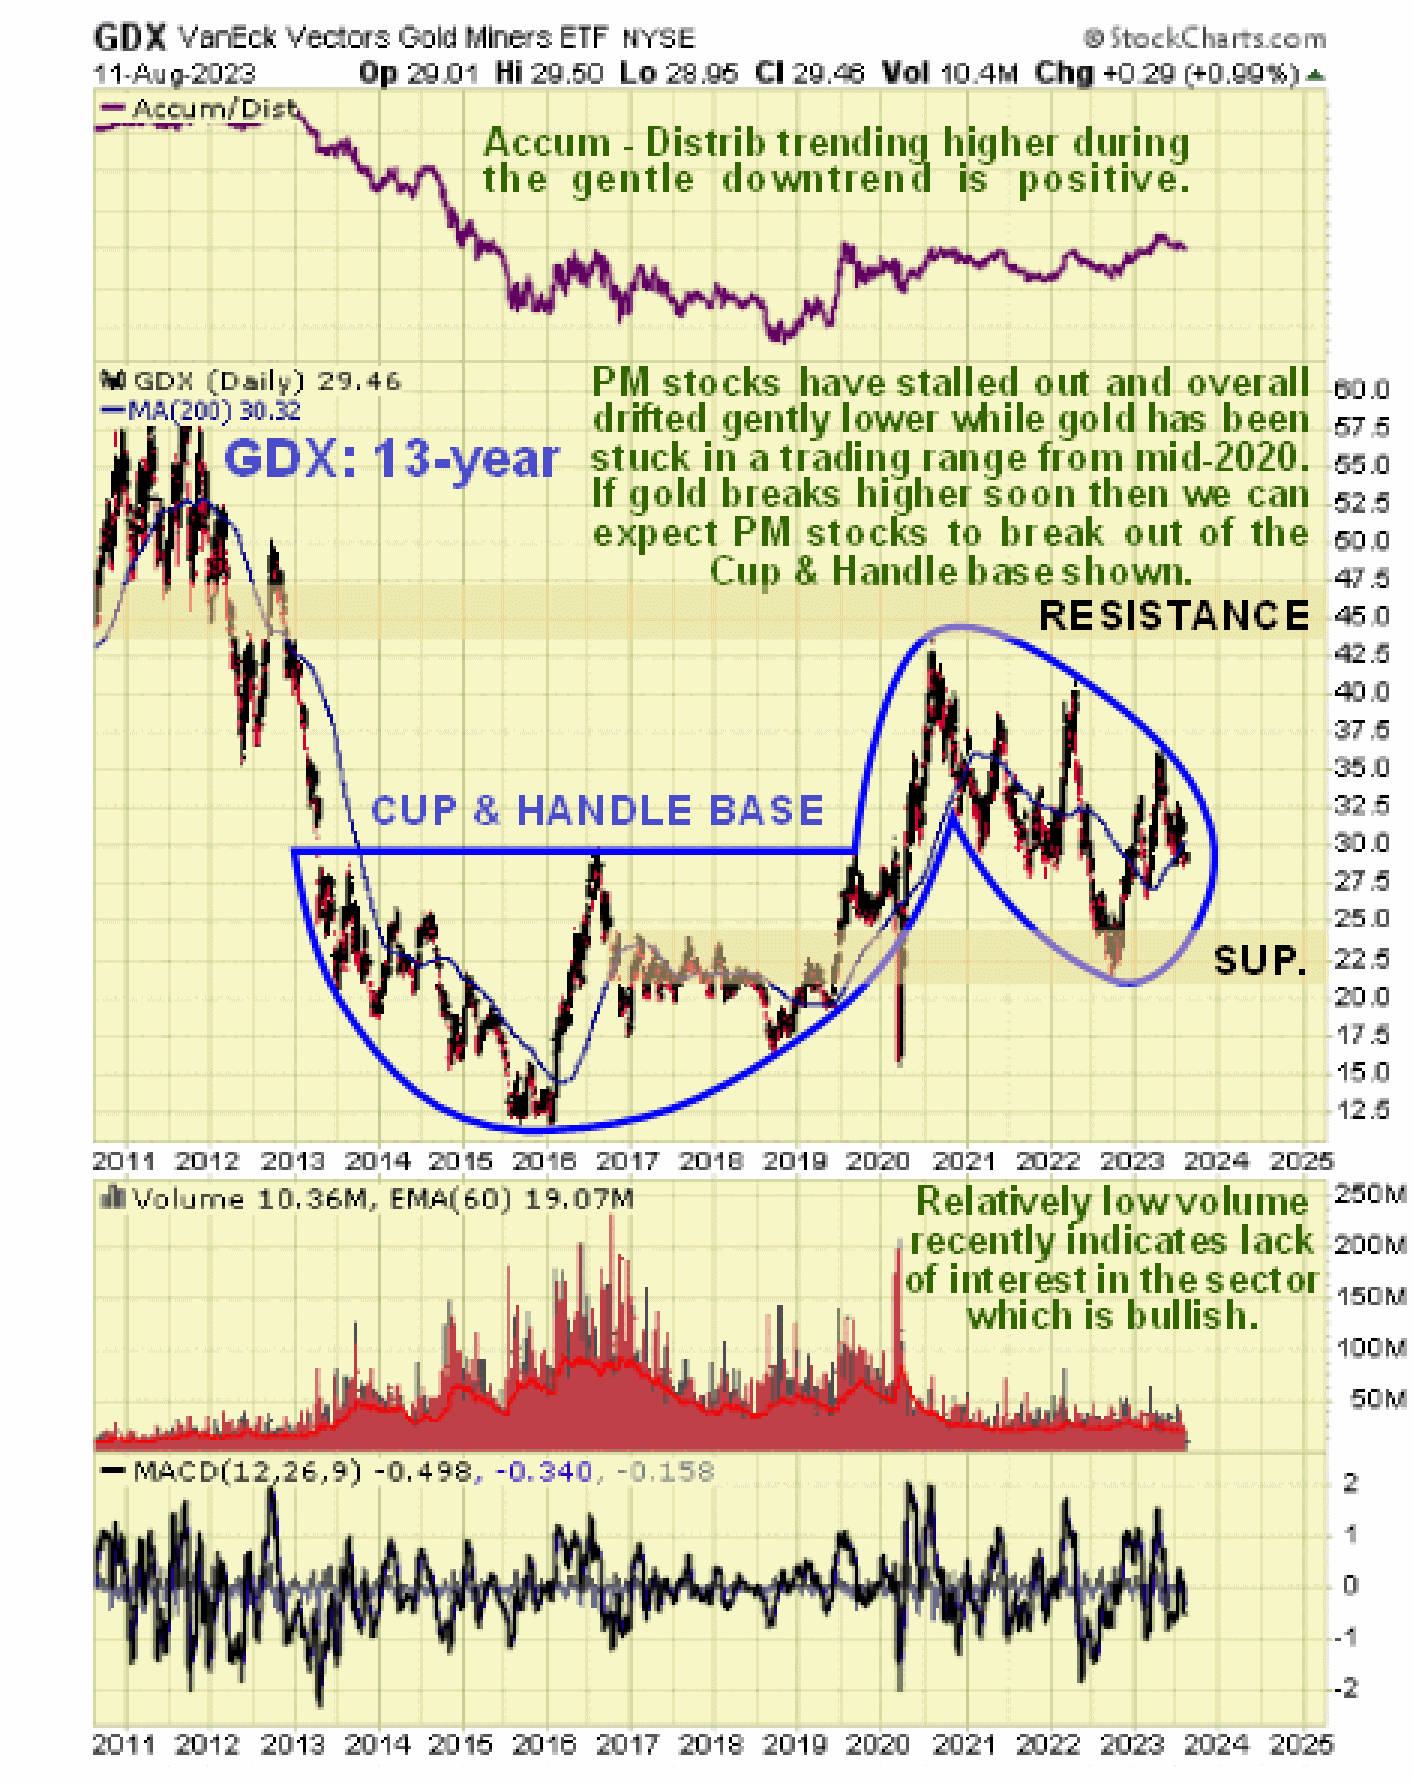
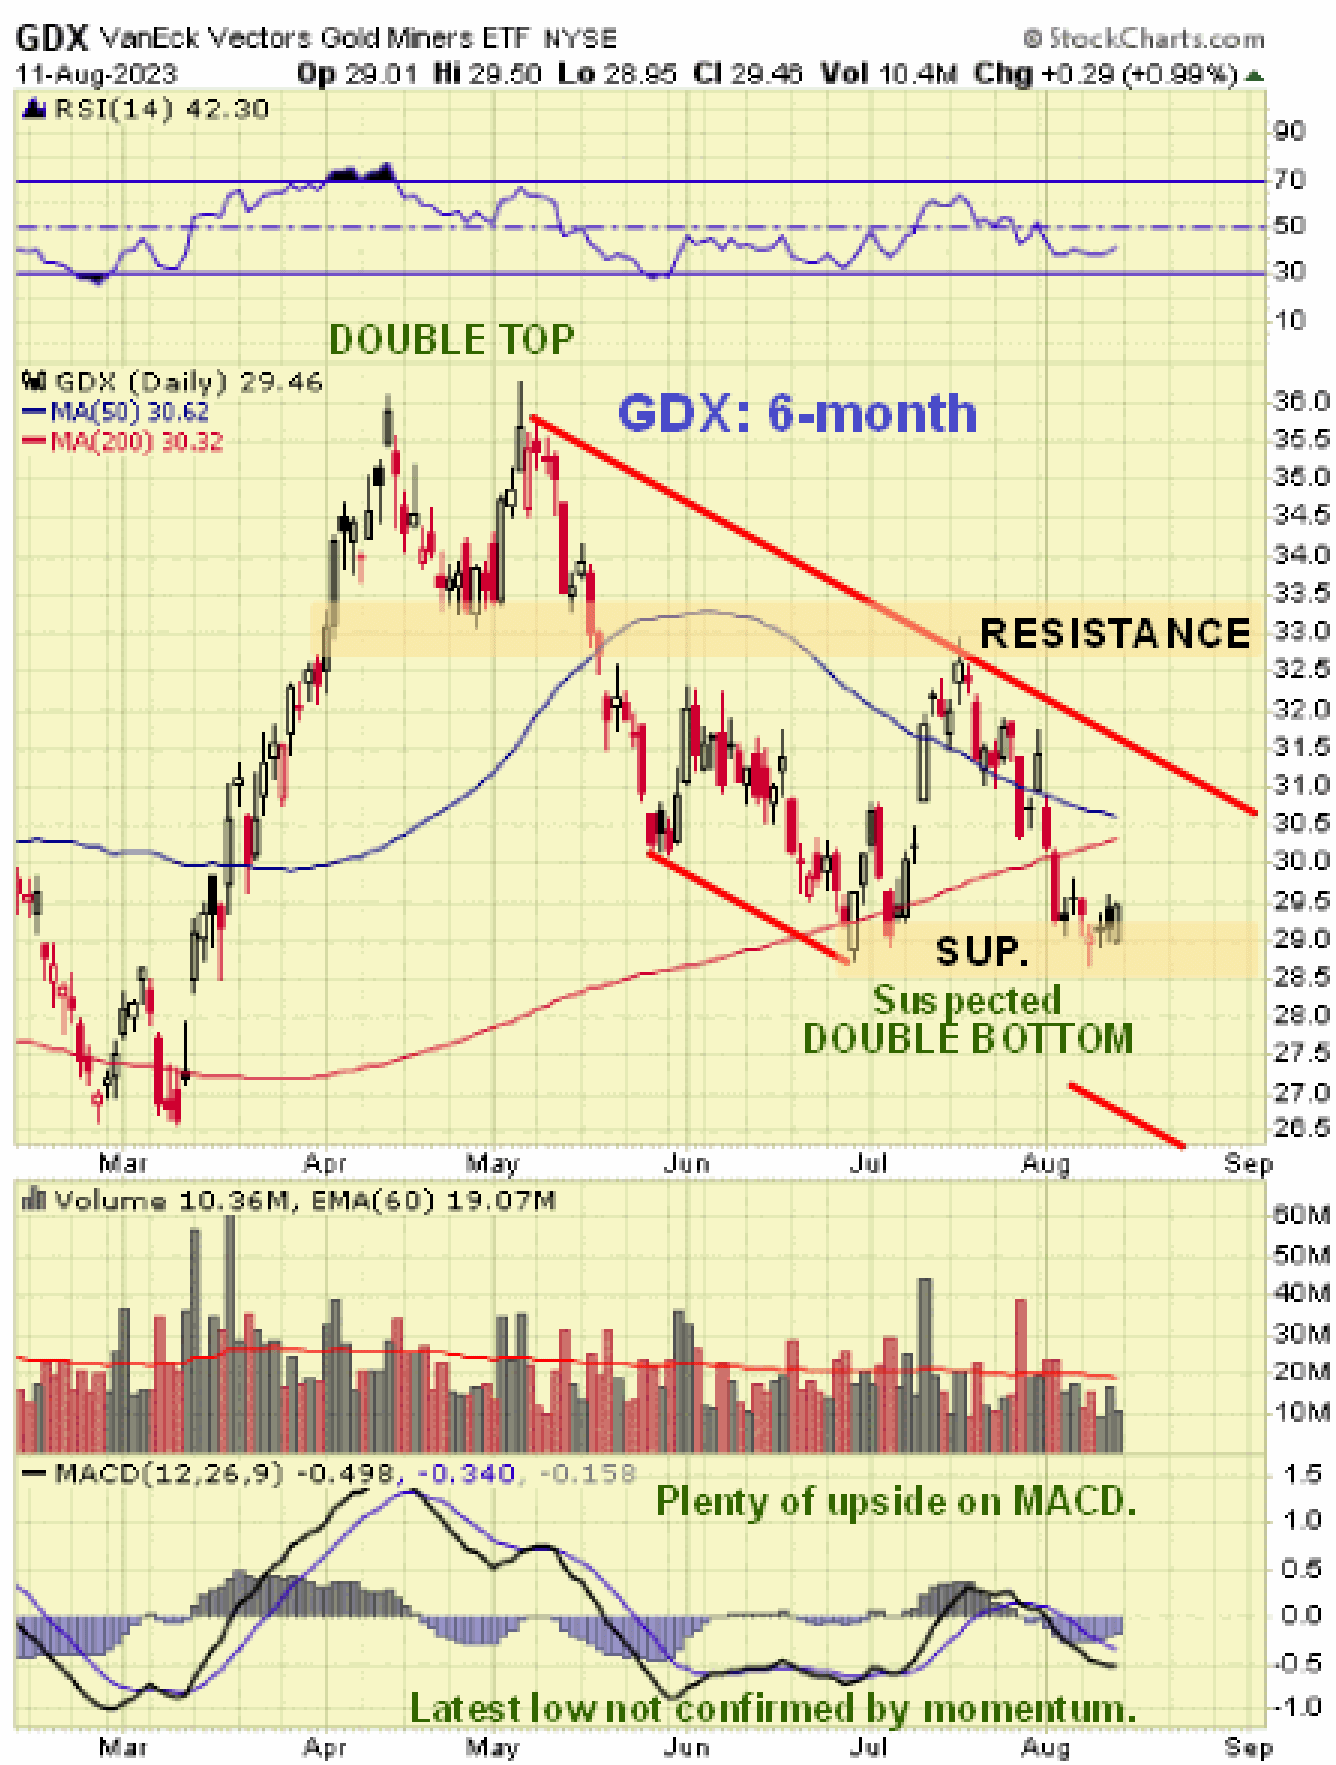
Bearing in mind what we have observed on gold’s charts we will now move on to consider the charts for GDX which faithfully represents gold stocks. Some of you may recall that as far back as last year we had delineated a possible giant Cup & Handle forming in GDX. Looking at the latest 13-year chart you will see that we have had to be very accommodating in adjusting the boundaries of the Handle of the pattern to include the nasty drop in GDX last Fall that brought it back deeply into the Cup to arrive at a zone of strong support where it stabilized and turned up again. The duration of this Handle corresponds exactly with that of the big trading range that has built out in gold itself since mid-2020, as we would expect, and clearly an upside breakout from this pattern is to be expected when gold succeeds in breaking out above the strong resistance at the top of its trading range that we considered above. Two further points to make before leaving this chart are that the Accumulation line has been trending higher as the Handle has built out which is positive and suggests upside resolution, with the line recently making new highs and volume in GDX (and the sector) has been relatively low for a long time which denotes the lack of interest that often precedes a new uptrend.
On the 6-month chart for GDX we can see that the last part of the Handle of the giant Cup & Handle base has taken the form of a downtrend that followed the Double Top in April and May and there is some chance that it is now forming the 2nd low of a Double Bottom with the late June low.
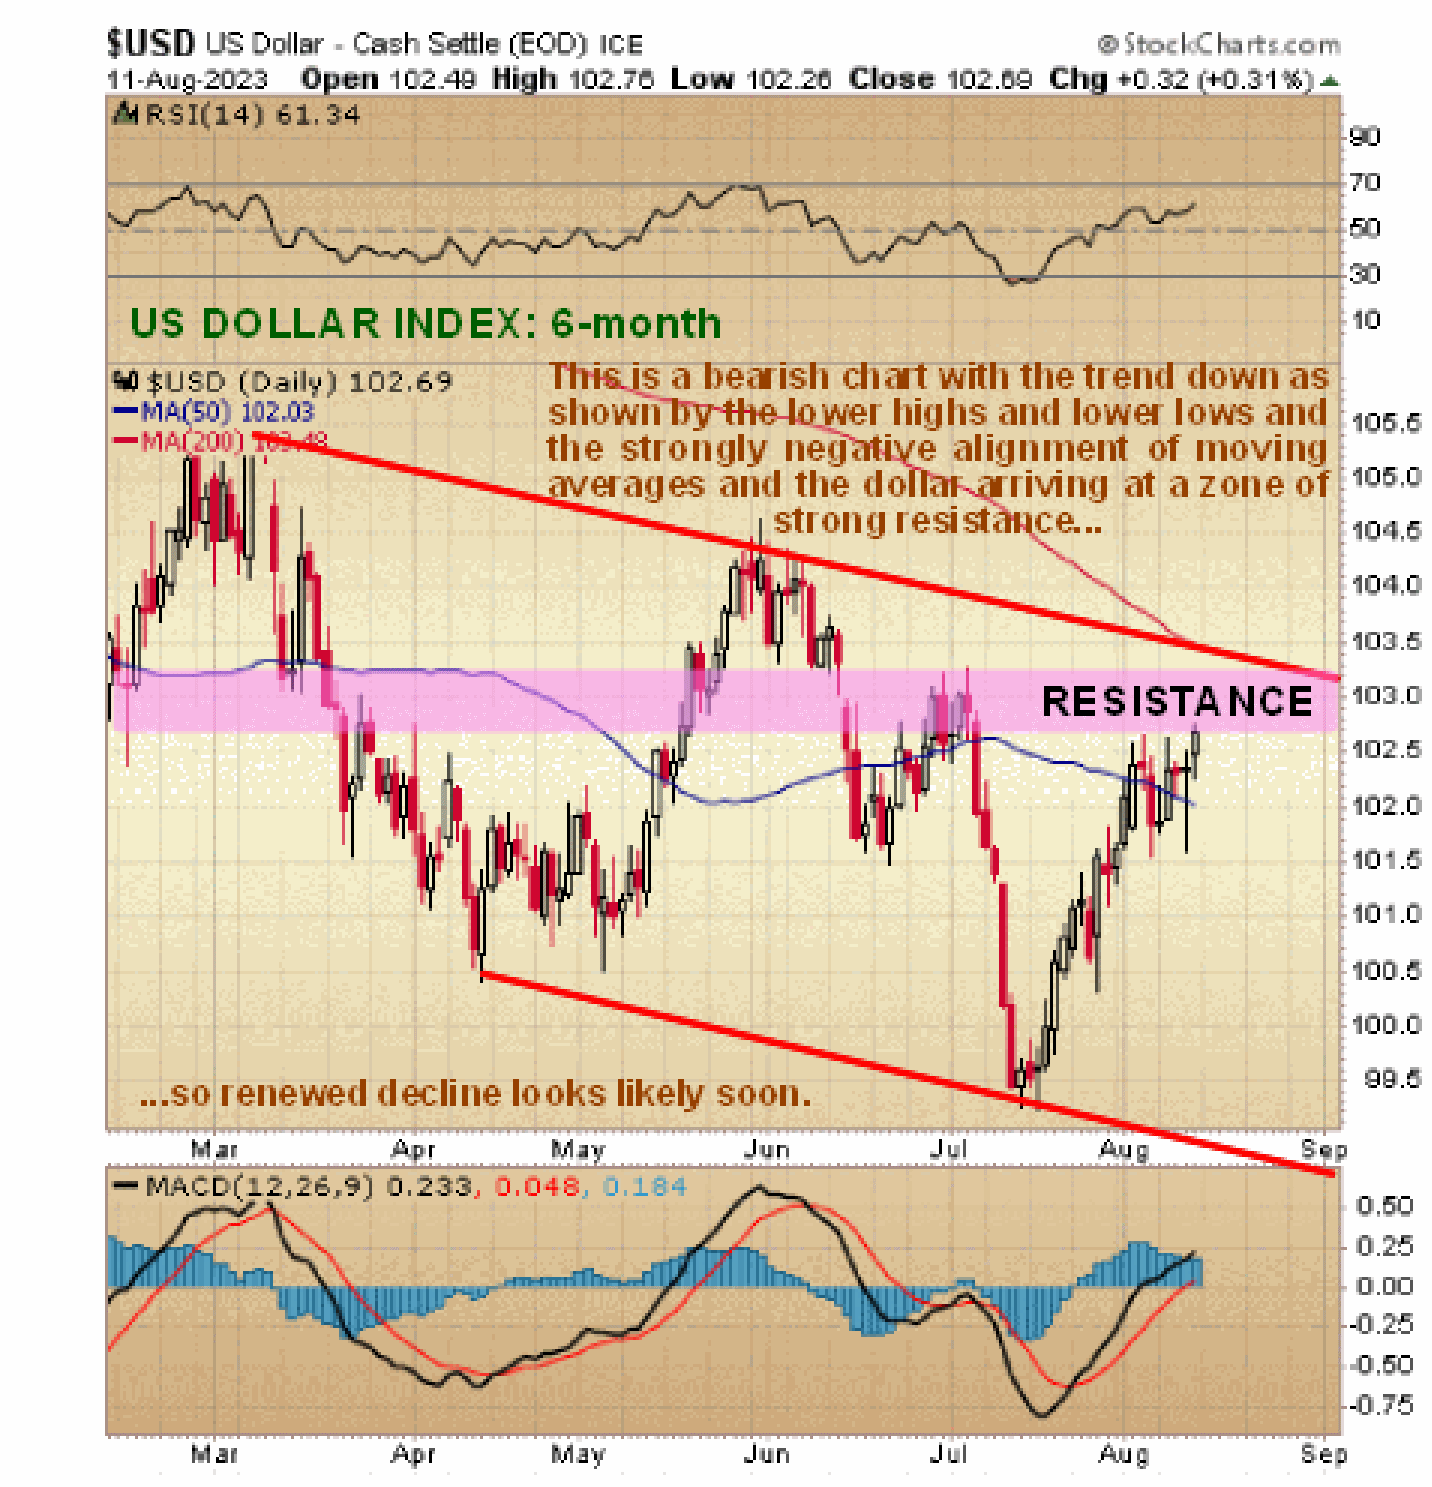
We will now take a quick look at the dollar. On the 4-year chart for the dollar index we can see that after being in a bullmarket from mid-2021 through the early Fall of last year, it reversed sharply into a bearmarket that started with a steep drop and for much of this year it appears to have been consolidating in a slightly downsloping trading range that has allowed the heavily oversold condition that resulted from the steep drop to unwind and the 200-day moving average to roll over and drop and catch up with the index, which it has now almost done. The pattern that has formed this year could break either way, like gold, depending on what happens, with the big bearish factor in play being whether or not the BRICS go ahead and launch a new gold-backed currency, and a big bullish factor for the dollar, if only for the medium-term, being the growing risk of a market crash in the Fall caused by a ballooning crisis in the banking sector triggered by persistent relatively high interest rates. Interestingly, unlike in the past, the BRICS need not fear the US military arriving on their shores and smashing up their countries as they did with Iraq and Libya when they dared to try moving away from the dollar, because they have a powerful nuclear deterrent and other advanced military kit, although as we are seeing, that is not stopping them “giving it a go” with their proxy war against Russia via the Ukraine and the looming proxy war against China using Taiwan as the excuse.

Although the dollar could break either way, for the reasons given above, it has to be said that the 6-month dollar index chart looks rather ugly with the index near the top of a downtrend channel and moving averages in heavily bearish alignment so that the quite strong rally of recent weeks that has more than fully unwound the earlier oversold condition can be seen to have fully restored the potential for another potentially big downleg, which can be expected to trigger a major breakout by gold out of its recent large trading range.
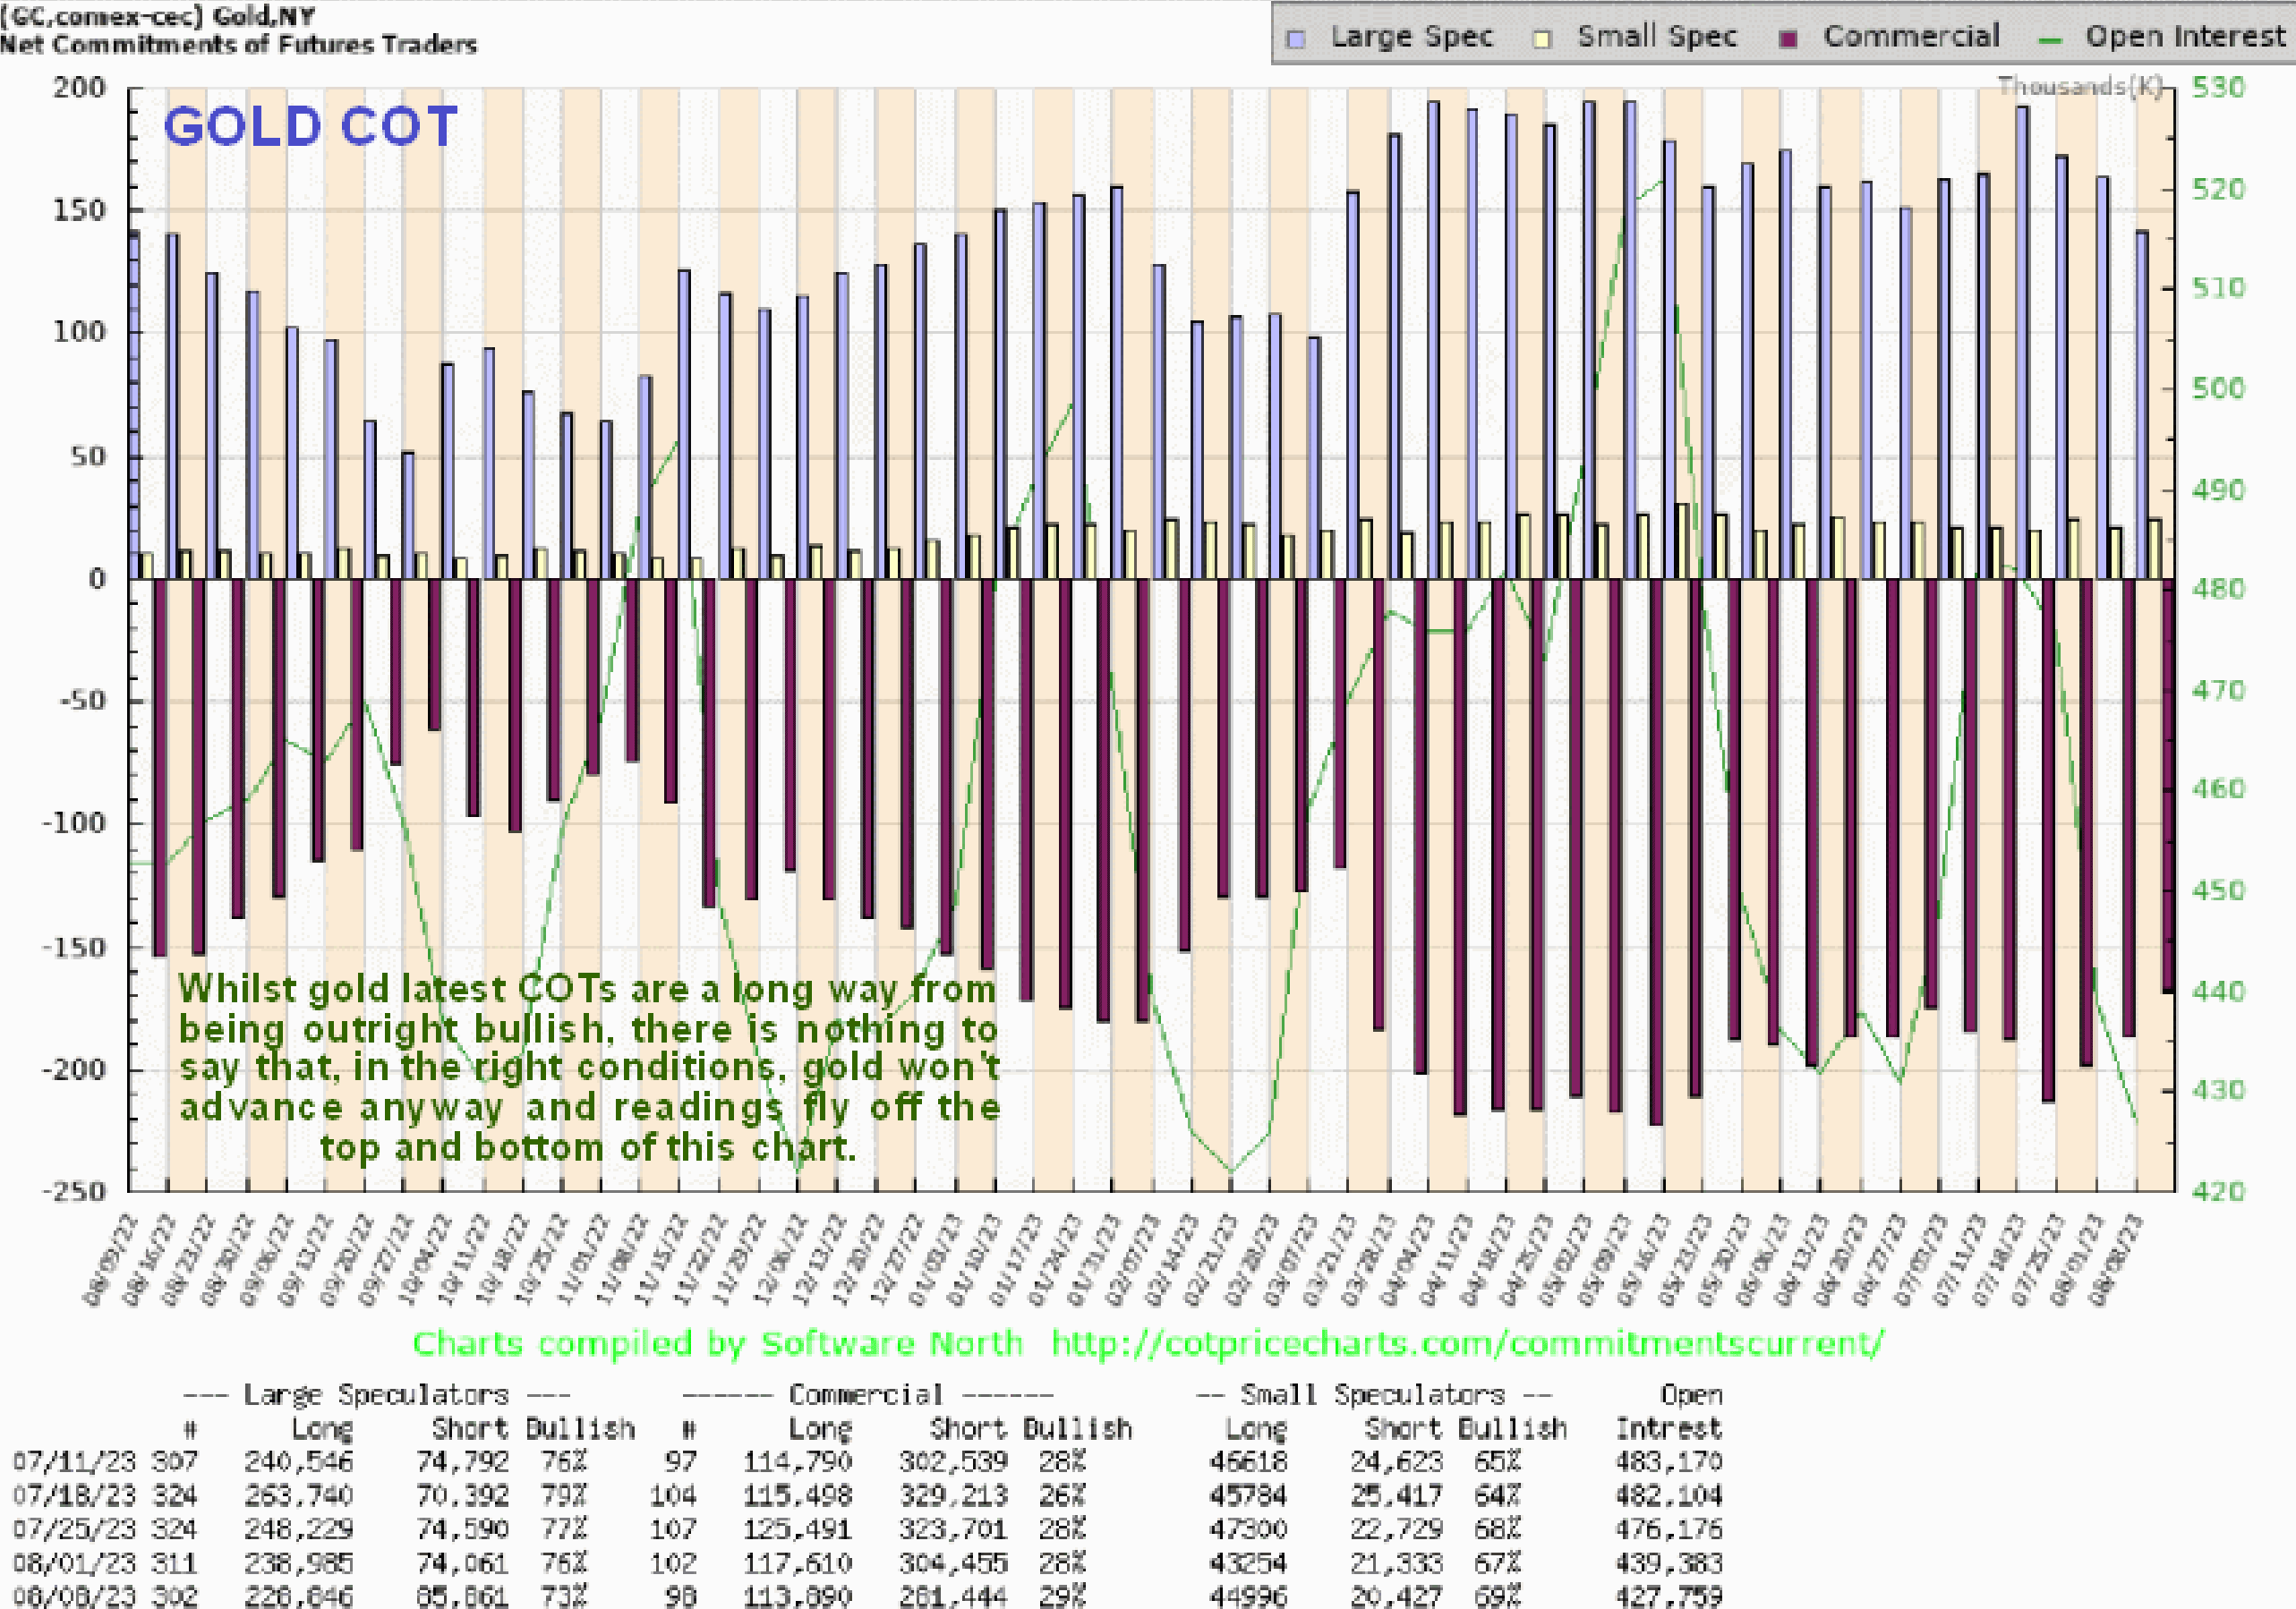
We will end by looking at gold’s latest COT and it has to be said that the readings on this chart are a long way from being outright bullish – the Large Specs bullishness has not moderated much. In more normal times we would be looking for these readings to moderate more before becoming outright bullish, but there is of course nothing to say that, in the right conditions, readings won’t become a lot more extreme and fly off the top and bottom of this chart.
*********

Clive P. Maund’s interest in markets started when, as an aimless youth searching for direction in his mid-20’s, he inherited some money. Unfortunately it was not enough to live a utopian lifestyle as a playboy or retire very young. Therefore on the advice of his brother, he bought a load of British Petroleum stock, which promptly went up 20% in the space of a few weeks. Clive sold them at the top…which really fired his imagination. The prospect of being able to buy securities and sell them later at a higher price, and make money for doing little or no work was most attractive – and so the quest began, especially as he had been further stoked up by watching from the sidelines with a mixture of fascination and envy as fortunes were made in the roaring gold and silver bull market of the late 70’s.
Clive furthered his education in Technical Analysis or charting by ordering various good books from the US and by applying what he learned at work on an everyday basis. He also obtained the UK Society of Technical Analysts’ Diploma.
The years following 2005 saw the boom phase of the Gold and Silver bull market, until they peaked in late 2011. While there is ongoing debate about whether that was the final high, it is not believed to be because of the continuing global debasement of fiat currency. The bear market since 2011 is viewed as being very similar to the 2-year reaction in the mid-70’s, which was preceded by a powerful advance and was followed by a gigantic parabolic price ramp. Moreover, Precious Metals should come back into their own when the various asset bubbles elsewhere burst, which looks set to happen anytime soon.
Visit Clive at his website: CliveMaund.com


