Gold Market's 'Black Hole' Forming


Last week's trading saw gold forming its high in Monday's session, here doing so with the tag of the 1761.00 figure. From there, a sharp decline was seen into late-week, with the metal dropping all the way down to a Friday low of 1671.70 - before bouncing slightly off the same to end the week.
Gold Market, Short-Term
As mentioned last weekend, the last short-term bottom was registered with our 10-day cycle, which troughed on May 27th at the 1701.60 figure (August, 2020 contract). From there, the upward phase of this wave lasted into early last week - but was shortened by the larger-degree cycles, which confirmed a turn to the downside with the recent action. Here is our 10-day wave:
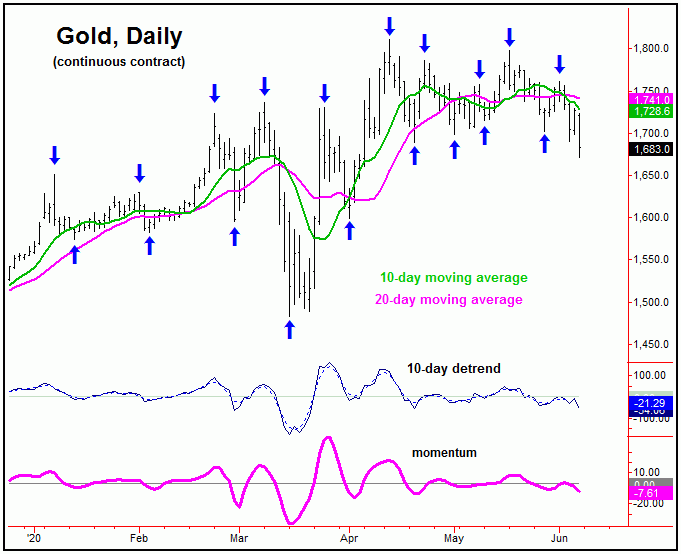
In terms of time, the recent upward phase of this 10-day wave lasted only 3 trading days, a bearishly left-translated peak - which is an additional confirm that the cycles above it are pushing south at the present time. Using the cycles - along with the technical indications noted in our report - we were able to avoid this decline, getting out with a decent gain on our most recent long position in the GLD on May 29th at the 163.13 figure (i.e., approximately 1751.00 for the August gold contract).
With the above said and noted, the next short-term low is expected to come from our 10-day wave, which is now some 7 trading days along. Once it does trough, we should see a quick 1-3 day rally phase, but one which would be favored to end up as another countertrend affair - due to the configuration of the cycles above it.
The Stepped-Back View
As noted above, the cycles above our 10-day wave have to be headed lower at the present time, with the same setting up a potential 'black hole' in the coming weeks - a spot where we will be looking for the next important low for gold to form. This low should be the last real good buying opportunity of this year for this market - thus making the price (and technical) action key to watch in the days/weeks ahead.
From last weekend: "we have our larger 34 and 72-day cycles looking for a correction in the coming weeks. On our 72-day chart, the detrend that tracks this wave is currently pointing south - and with that the near-term upside is expected to be limited, at least until we can get the correction phase of this wave out of the way."
As pointed out, our 72-day detrend indicator was projecting lower into June, an assessment which was confirmed by our momentum indicators early last week. With the market, we have to constantly monitor both momentum and price action, as the cycles are only one piece of the puzzle. That is, when they are out of alignment, we have found that is time to be on very close guard for a change in trend.
Here again is our 72-day cycle:
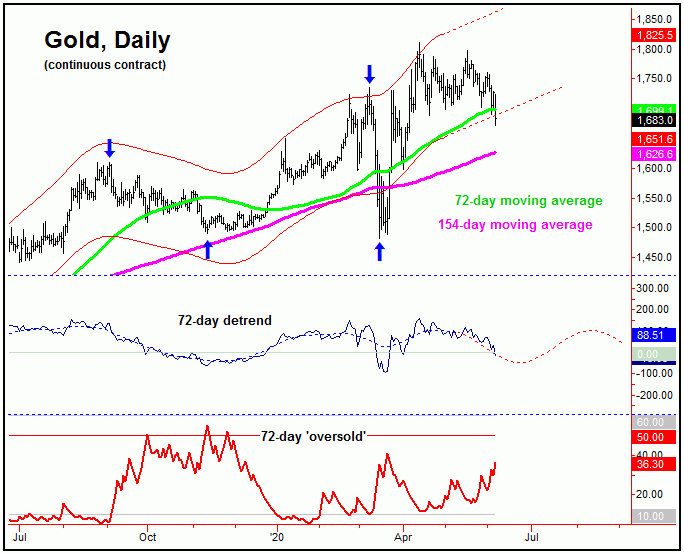
With the above said and noted, the next low of importance should come from this same 72-day cycle. In terms of price, with the recent tag of the 72-day moving average, any minimum expectation for the downward phase of this wave has already been met. Having said that, we see the downside risk being back to the 154-day moving average or lower in the days/weeks ahead, before this wave next attempts to trough.
In terms of patterns, the probabilities do favor the correction phase of this 72-day cycle to end up as countertrend - holding well above the mid-March bottom of 1482. If correct, then the probabilities are above-average that the next upward phase of this wave will take gold back above the 1811.40 swing top, though the bigger picture path is looking for an eventual push up to the 2000 figure in the coming months.
Adding to the notes above, since the time cycles give only a general range of where we should be looking for a bottom, we use 'reversal dates' to really narrow down that window. With that, we have a key date range for the month of June where we expect this low to try and form, with more precise details noted in our thrice-weekly Gold Wave Trader market report.
Technical Indications
In looking at technical action, of note is that our Mid-Term Breadth index for gold is still pointing south at the present time, and has been noted as a headwind for the markets in recent weeks. Here is the current position of this indicator:
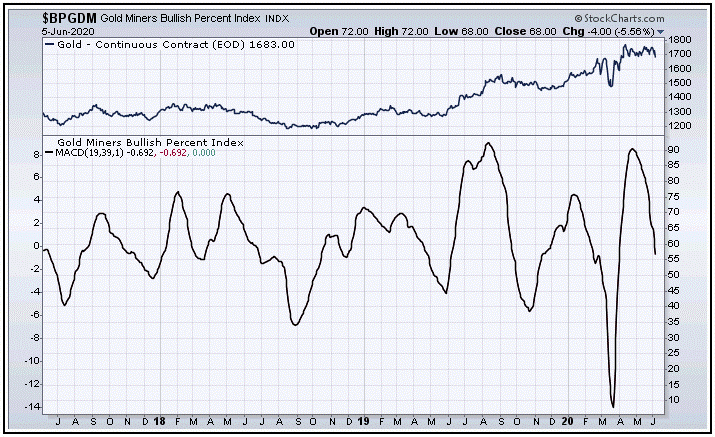
Though we don't make all our decisions based upon any one indicator, we do like to see the trend of breadth moving along in agreement with what the cycles are saying. And - when these diverge - then it is time to be on guard, as was the case with the most recent upward phase of the 72-day cycle. Here, our breadth index continues to move lower at the present time - a bearish technical signal.
From the comments made in recent articles, we want to see is our Mid-Term Breadth index indicator dropping down towards the lower-end of its range (i.e., 30-40 or lower), along with some other technical signals that we track in our Gold Wave Trader report. The next low should be an important one - and thus is not to be missed.
U.S. Stock Market
As noted in prior articles, the last important low for U.S. stocks came with the 45-day cycle, which bottomed right into our expected bottoming range of mid-May:
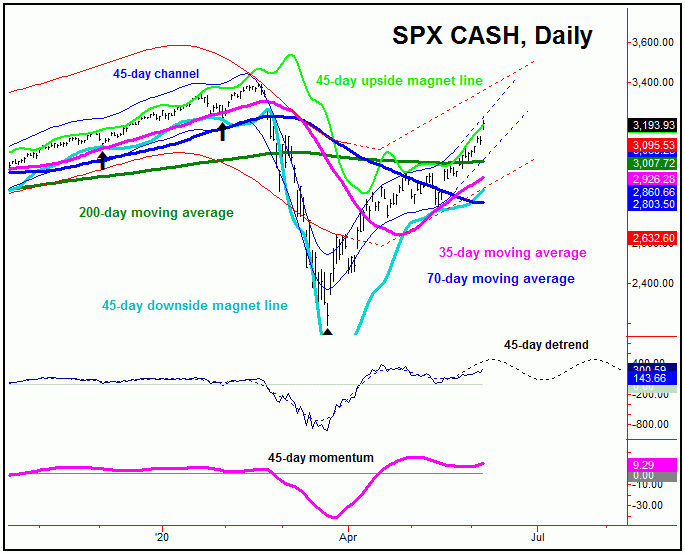
In terms of price, we noted the 3100 SPX CASH figure as a potential magnet to the upward phase of this 45-day cycle - something was well-exceeded with the action into last week. Even said, until proven otherwise, the upward phase of this 45-day wave is expected to remain intact for at least several more weeks, thus offering up the potential for even more upside in regards to price.
The current upward phase of this 45-day cycle is expected to give us the next peak of significance in U.S. stocks, though from higher price and time levels than already seen. Once this peak is set in place, the second largest percentage correction of this year is expected to play out into the Summer months, a move which is expected to end up as countertrend - inside the upward phase of the larger 180-day cycle that we track, which is shown below:
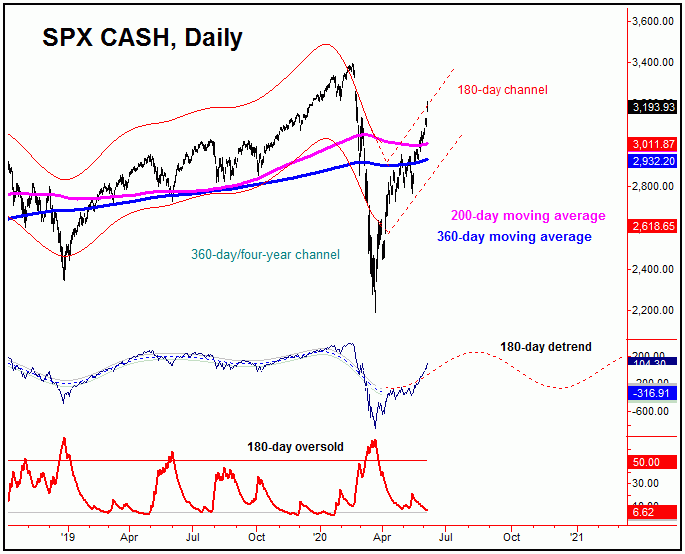
The upward phase of this 180-day cycle is projected higher into later this year, and should give way to the next mid-term peak in U.S. stocks. With that, as mentioned above, we expect the next downward phase of the 45-day cycle into mid-Summer to end up as another countertrend affair, to be followed by higher highs - then to be on the technical look for the next important peak to form. More on all as we continue to move forward.
Jim Curry
The Gold Wave Trader
http://goldwavetrader.com/
http://cyclewave.homestead.com/


