Gold Miners Are Historically Undervalued


Gold mining companies are historically undervalued compared to gold itself. While there are never any guarantees in the investment world, should gold indeed break out to new all-time highs in 2024, the potential exists for a tremendous revaluation higher for the gold mining companies, with gains vastly above and beyond those for gold itself. In this article, we will highlight the nature of the mining sector undervaluation, examine some of its causes, and look for upside potential should in fact the upward thesis play out.
Gold Miner Valuation
There is an inherent valuation relationship between gold mining companies and the very metal they dig out of the ground: the gold miners’ profits are leveraged to the price of the underlying metal. To illustrate, let us assume that ABC Mining Co. produces 1 million ounces of gold per year, at an average extraction cost of $1,300 per ounce, with gold prices currently trading near $2,000 per ounce. ABC Mining Co. thus would profit $700 per each ounce of gold mined, equivalent to $700 million per year.
Now let us assume that the price of gold rises to $2,500 per ounce, a 25% gain from current levels. Assuming all other variables remain even, we can see that ABC Mining Co. would now profit $1,200 per ounce produced, a 71% increase from its profits compared to at $2,000 gold.
Thus, we can see that as the price of gold increased by 25% per ounce, the profits of ABC Mining Co. increased by 71%. This is the leverage to the underlying metals prices that as gold mining investors we seek to achieve.
Gold Miner Undervaluation
Now, something strange has been occurring in the gold mining world since the 2011 peak in gold near $1,900 per ounce. As gold prices retreated to near $1,000 in 2015, and then subsequently doubled to over $2,000 today, the valuation of the gold mining companies has failed to show the leverage to gold prices that we would expect. The following graph shows the undervalued nature of the gold mining complex, as illustrated by the GDX large-cap gold miners fund, and compared to gold since the 2011 peak:
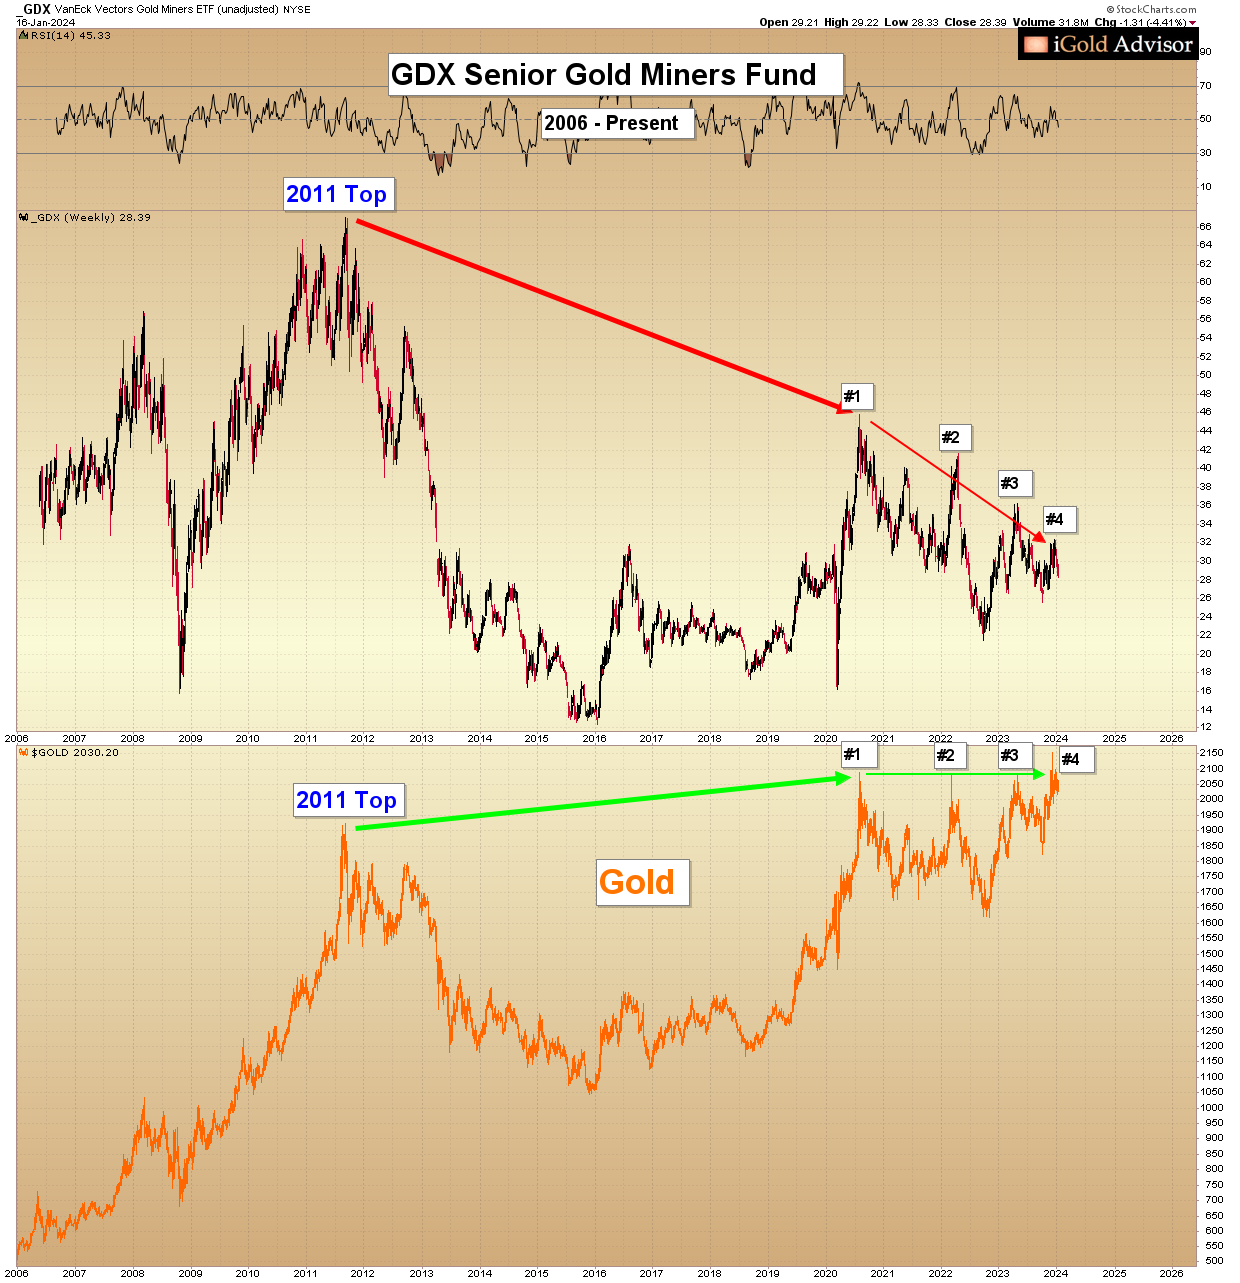
- Since the 2011 top in both gold and the gold miners, while gold itself is now $100 higher than its 2011 peak, the gold miners are still below their respective 2011 peak.
- Further, note how as gold has consolidated from 2020 – 2024 in four successive nearly equivalent peaks at $2,075 (#1 - #4), the gold miners have made sequentially lower peaks (#1 - #4) this entire time.
As we can see, on both long-term (2011 – present) and short-term (2020 – present), the gold mining companies are lagging gold itself, even though their valuations are supposed to be leveraged to the underlying metal.
Why is this?
Reason for the Gold Miners’ Underperformance
The primary reason for the gold miners’ underperformance since the 2015 bottom – even as the price of gold itself has doubled – has to do with poor sentiment in the precious metals sector compared to the wider global economy. While it may seem counter-intuitive that poor sentiment could abound amidst a 100% gain in the value of the gold, let us explain…
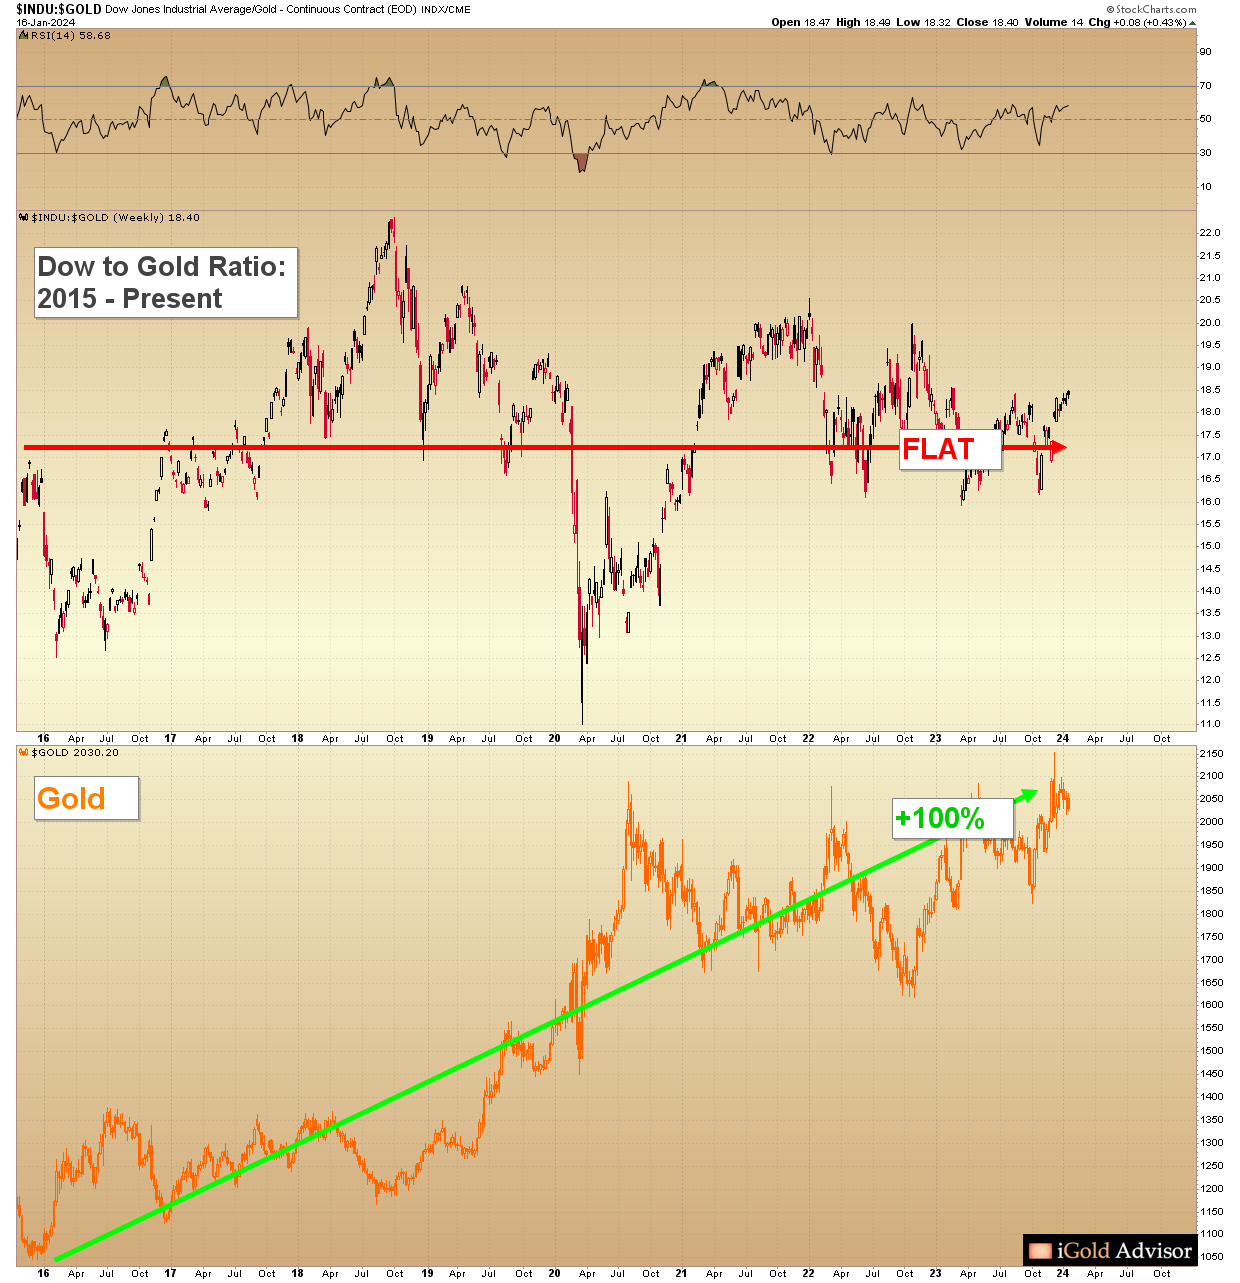
There is no better way to highlight the sentiment for the general economy versus gold than via the Dow to Gold Ratio. While the Dow to Gold Ratio measures the number of ounces of gold required to purchase one share in every company of the Dow Jones Industrial Average, more broadly speaking it is the best comparative tool for assessing sentiment in mainstream stocks (Dow) versus precious metals (gold).
Below we show the Dow to Gold Ratio since 1970 on top, with the price of gold immediately below it:
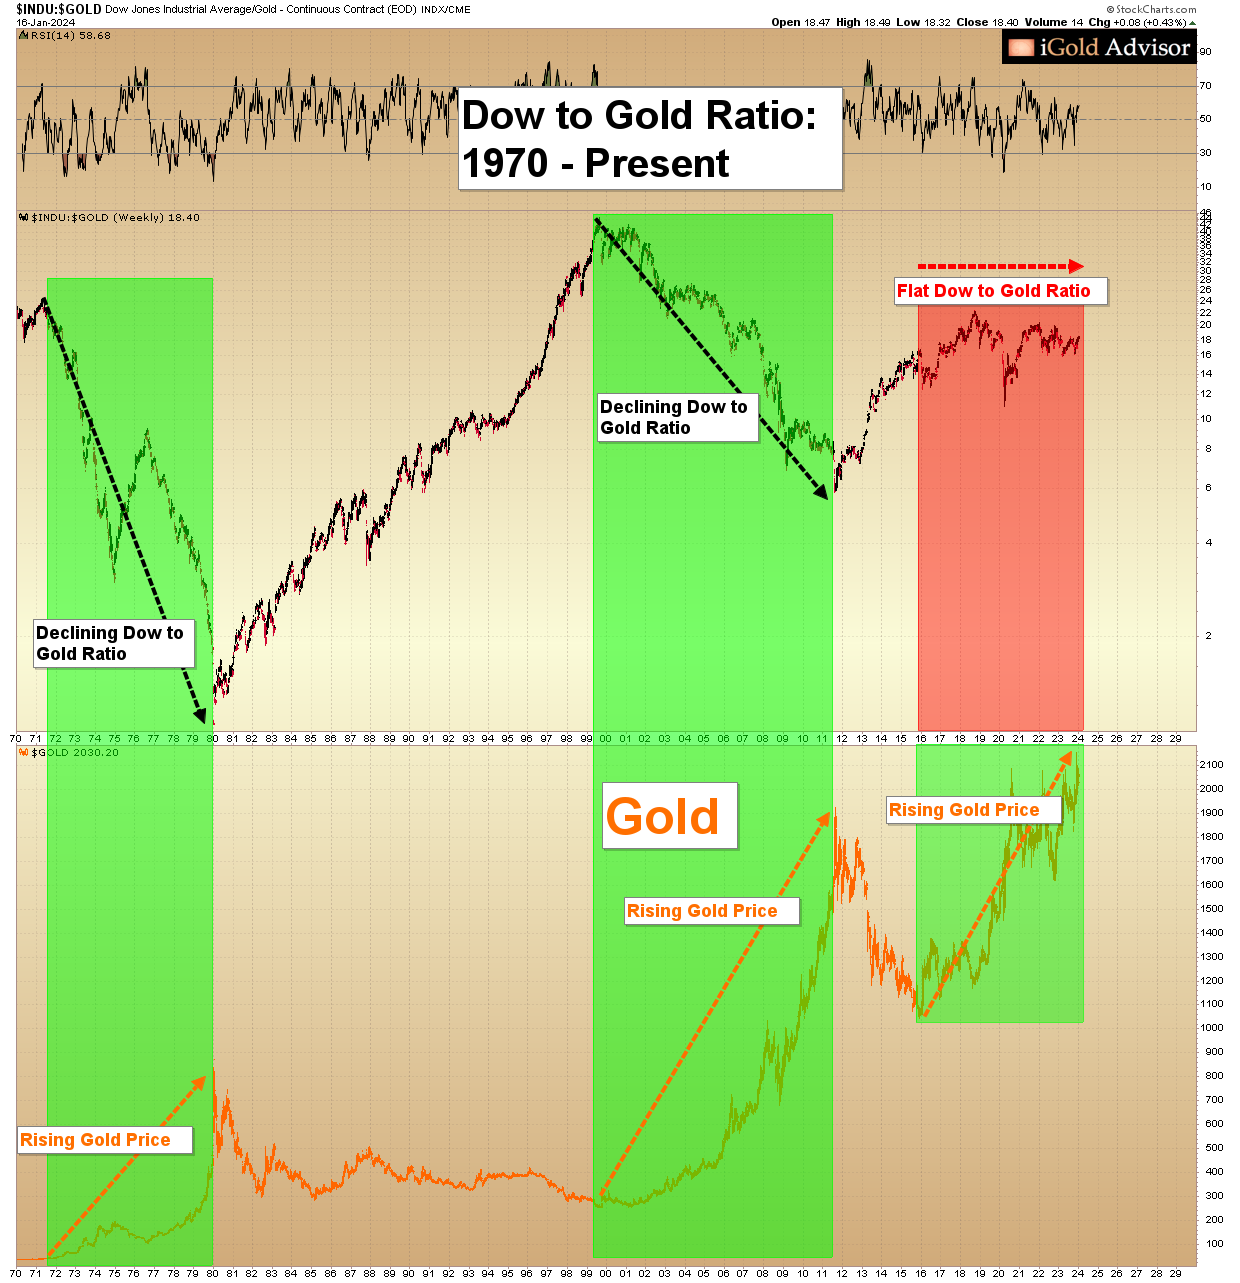
- Note that there have only been three bull markets in gold trading history (green shadings):
- 1971 – 1980,
- 1999 – 2011, and
- 2015 – present.
- In each of the previous two bull markets (1971 – 1980 and 1999 – 2011), as the gold price rose by many hundreds of percentage points, in each instance the Dow to Gold Ratio strongly compressed lower, in favor of gold (green shading):
- From 1971 – 1980, as gold rose from $35 to $865 (+2,370%), the Dow to Gold Ratio fell from 25 to 1 (-96%) à thus, the general economy lost 96% of its value relative to gold in nine years.
- From 1999 – 2011, as gold rose from $250 to $1,920 (+670%), the Dow to Gold Ratio fell from 44 down to 11 (-75%) à thus, the general economy lost 75% of its value relative to gold in 12 years.
- From 2015 – present, as gold has risen from $1,045 to $2,075 (+98%), the Dow to Gold Ratio is COMPLETELY FLAT (0% change) à thus, the general economy has maintained its value relative to gold since 2015.
- The most critical point: now is the first bull market in freely-trading gold history, in which as gold prices have risen, so has the mainstream stock market.
Need more proof? Look at the nearly perfect 1:1 correlation between the Dow and gold over the last two years:
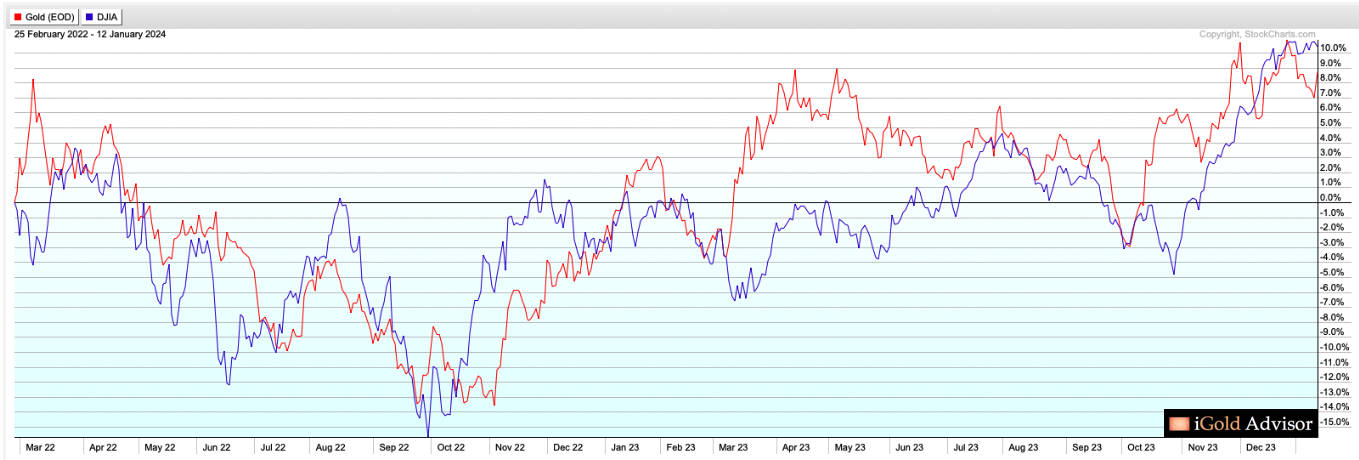
Notice how, with very minor exceptions, the price of gold (red) and the Dow Jones Industrial Average (DJIA, blue) have nearly mirror imaged one another over recent years.
With the rise of inflationary pressures following the Coronavirus pandemic and the prevalence of algorithmic trading systems around the world, the market exhibits an “all or nothing” valuation model, essentially considering Dow stocks and gold to be functionally equivalent assets on the risk and reward spectrum.
Sound crazy? Might seem so. But remember the old adage: “Markets can stay irrational longer than you can stay solvent.”
An Anomalous Correlation
And the proof is in the charts: the Dow to Gold ratio is fully flat over the last nine plus years, as the price of gold and the Dow Jones Industrial Average have both doubled within the same period.
The market considers them to be one and the same.
This has never happened before in the history of freely-traded markets. Let that sink in.
Yes, we are living through an anomalous correlation, in which the market has grouped gold and mainstream stocks together as functionally equivalent assets.
Again, the market adage: “Correlations continue… until one day they stop.”
Yet predicting the exact moment when a decade-long correlation is going to break will be a topic for another day. For now, let us think about the ramifications of the nearly-perfect correlation between the Dow Jones and gold.
Ramifications of the Dow to Gold Ratio
Consider the average investor of the 1970’s, who witnessed his retirement portfolio slowly but surely losing the majority of its value (-96%) compared to gold during this period.
What would such an investor do to protect himself?
Clearly, the answer would have been to sell some of his mainstream stocks and to buy gold, so as to participate in the wealth-enhancing results of gold during a bull market.
Then let us remember the leverage to a rising gold price that is an inherent part of the mathematics of gold mining, and consider that when we multiply that average investor times billions of people around the world, some portion of those investors would have tried to achieve superior gains above and beyond the gold price rise itself, by investing in gold mining companies.
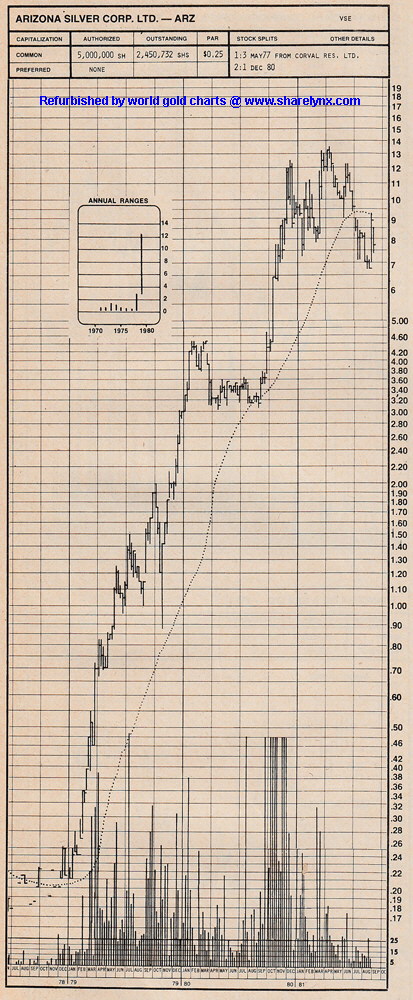
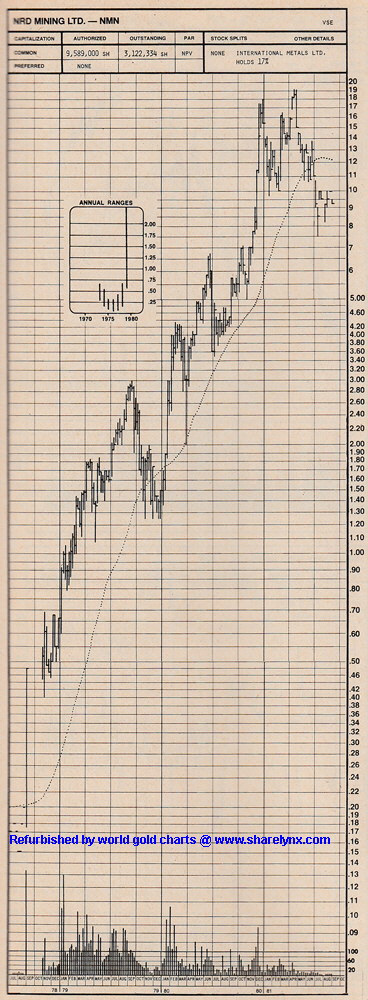
And indeed, during the late 1970’s, some of these gold mining investors did achieve vastly superior returns compared to physical gold-only investors (charts courtesy http://sharelynx.com)
- Consider Arizona Silver Corp., which rose 7,000% during the last two years of the bull market:
- Or NRD Mining, which rose an astonishing 11,900% in a little over two years:
The point is that many mining companies witnessed leverage far in excess of the gains seen in gold itself during previous rising gold cycles.
Back to the Present
Compare these incredible performances from the 1970’s cycle to the very first chart of this article, which shows how the mining sector has underperformed the price of gold since 2011, and most acutely since 2015 as the price of gold itself has nearly doubled.
Why has the mining sector underperformance been so severe?
The answer is the flat Dow to Gold Ratio.
In the present cycle, average investors, who in previous gold cycles were incentivized to swap their Dow stocks for gold, have performed just as well with their mainstream investments as have gold investors: both are up nearly an identical 100%.
Thus, sentiment in the precious metals sector has remained subdued for the last decade, even though the price of gold has risen strongly.
Again, there has never been a precious metals cycle this long in history that saw both gold and stocks rise simultaneously.
When mainstream investors see little reason to swap their traditional assets for gold, marginal interest in the precious metals sector wanes, even if prices hold steady.
And when marginal interest wanes, that speculative investment that would flow into alternate segments of the sector, namely the gold miners, also suffers.
It is this lack of speculative interest, due to a stable Dow to Gold Ratio, which has seen precious metals investors largely ignore the gold mining companies, despite gold itself having risen 100% since 2015.
Has This Ever Happened Before?
Have the gold miners ever underperformed in such a manner before, even amidst a steady gold price?
Indeed, we need only look back to the middle part of the 1970’s bull market, prior to the dramatic gains that we saw earlier (above), to notice such a period of underperformance in the mining complex, which ultimately resolved to the upside.
Below we show gold on top, with the price of AngloGold Ltd., a large gold miner similar to the companies currently featured in the GDX index:
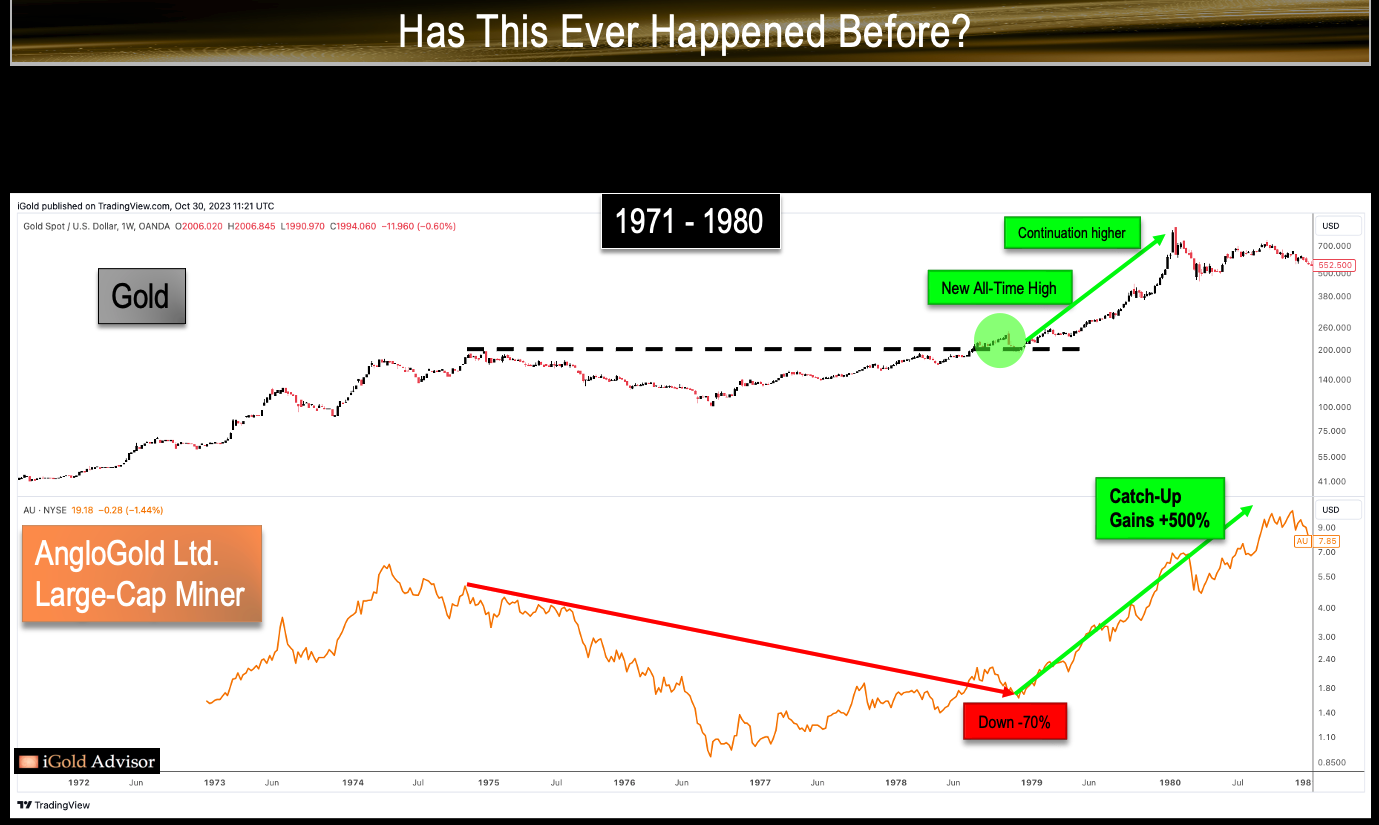
- Note how from 1974 to 1978, as gold consolidated below the $200 1974 peak, AngloGold fell by 70% in value. This radical underperformance in the mining company even amidst an overall sideways consolidation in gold itself is eerily reminiscent of the present period, in which the GDX is down nearly 40% even as gold itself has consolidated sideways since 2020.
- As a sum, mining investors loathe sideways price action, as without upside leverage, the market is of low interest to them. Thus, amidst a sideways consolidation period in gold, AngloGold was sold down by 70%.
- Note that when gold finally broke out to new all-time highs in late 1978, AngloGold investors realized the errors in their ways and piled back into the stock, chasing it up by 500% in just over 15 months following gold’s breakout.
- Indeed, the mining investors who succumbed to apathy as gold consolidated were proven wrong in the end.
Consider Another Example
Below we show silver on top, with the price of Hecla Mining, a large silver miner similar to the companies currently featured in the GDX index:
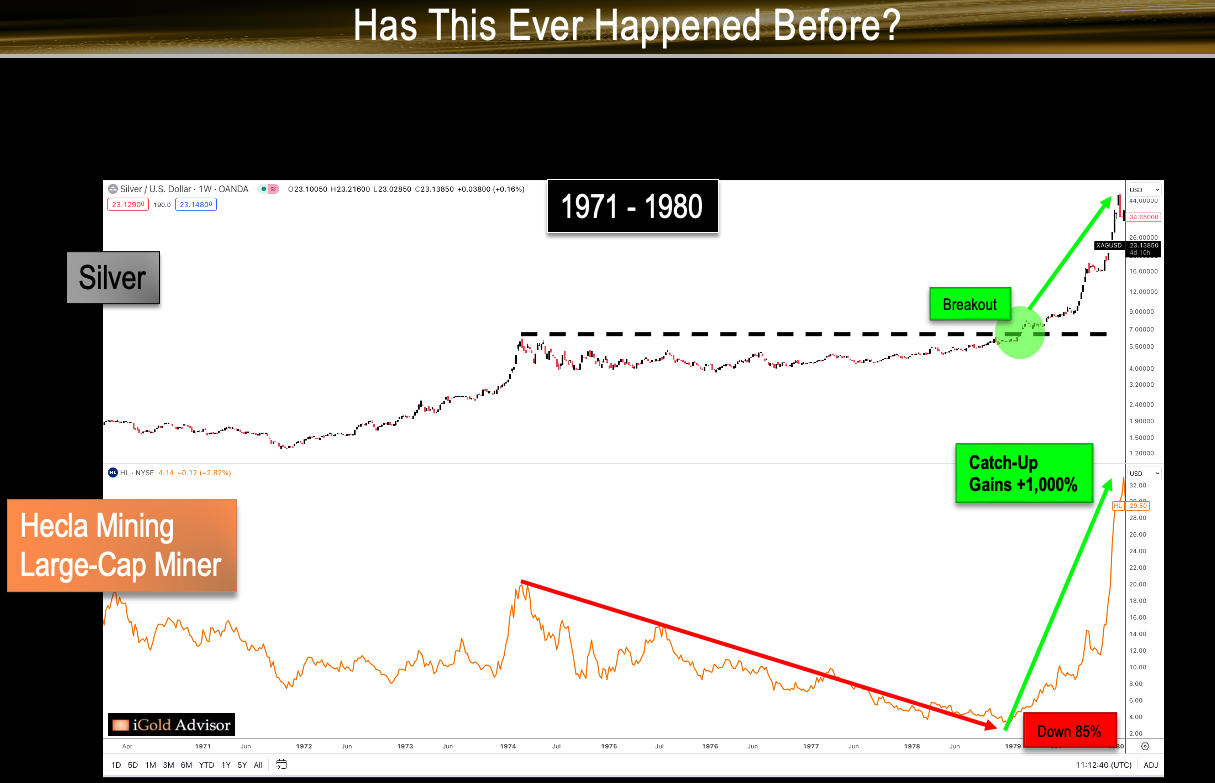
- Note how from 1974 to 1978, as silver consolidated below the $6 per ounce 1974 peak, Hecla fell by 85% in value. Again, this underperformance in the mining company even amidst an overall sideways consolidation in the precious metal itself is reminiscent of the present period.
- Again, mining investors loathe sideways price action, as without upside leverage, the market is of low interest to them.
- Note that when silver finally broke out to new all-time highs in late 1978, Hecla investors realized the errors in their ways and piled back into the stock, chasing it up by 1,000% in just over 15 months following gold’s breakout.
- Again, the mining investors who succumbed to apathy as silver consolidated were proven wrong in the end.
Key Takeaways on Gold
Gold is less than $100 away from breaking out to new all-time highs on a sustained basis, after having consolidated for the last four years below $2,075.
The Dow to Gold Ratio has moved sideways for nearly a decade, as gold has risen by 100%. This is the first time that this correlation has occurred in the history of freely-trading gold.
Since the average investor has seen little need to diversify out of mainstream Dow stocks, sentiment in the sector has remained subdued.
And so, mining investors have grown weary following four years of consolidation, and have sold their metals companies despite sideways price action in gold itself.
The last time that gold consolidated in such a manner and then eventually broke upward, many of the undervalued gold miners gained hundreds if not thousands of percentage points, all within two years of the breakout.
Gold is just beneath a breakout now. While there are never guarantees in the investment world, the reward versus risk proposition in the gold mining sector is as good as one could ask for at this juncture, given a 2 – 3 year time horizon.
At www.iGoldAdvisor.com, we are preparing to purchase stock in several gold and silver mining companies. We also invest in private placements, which offer higher net-worth investors free warrants in addition to their shares for the highest possible gains.
We conduct individual consultations with new and experienced investors alike. iGold Advisor is 100% independent and takes no fees nor kickbacks from any companies referenced herein.
********

Christopher Aaron began his career as an intelligence analyst for the CIA and Department of Defense. He served two tours to Afghanistan and Iraq between 2006 - 2009, conducting pattern-of-life mapping for military leaders.
Mapping shares similarities with technical analysis of the financial markets because both involve the interpretation of repeating patterns found in human nature. He is the founder of iGold Advisor, providing independent research and analytics on all aspects of the precious metals markets.
He speaks regularly on the cyclical patterns found within the financial markets and on international policy. He has been featured in the New York Times and NPR news amongst other financial publications.


