Gold Mining Stocks: Finding the Midas Touch?


Gold Mining Stocks
Analytically, we continue to see a number of signs that give strong evidence that an important bottom is in the process of forming on both Gold and the Gold Stocks. Fundamentally, we believe the Trump Administration is very close to imposing trade tariffs on Chinese made steel, and that a potential trade war could soon be in the wind. That would have profound bullish implications for gold and an announcement along those lines could be hitting the tape as breaking news literally any day now. We plan on doing a deep dive into the fundamental analysis of trade protectionism and how it could soon be contributing to a major turn in another report soon. For now, the thrust of this report is that of a medium-term technical update with an eye on the gold and gold mining charts.
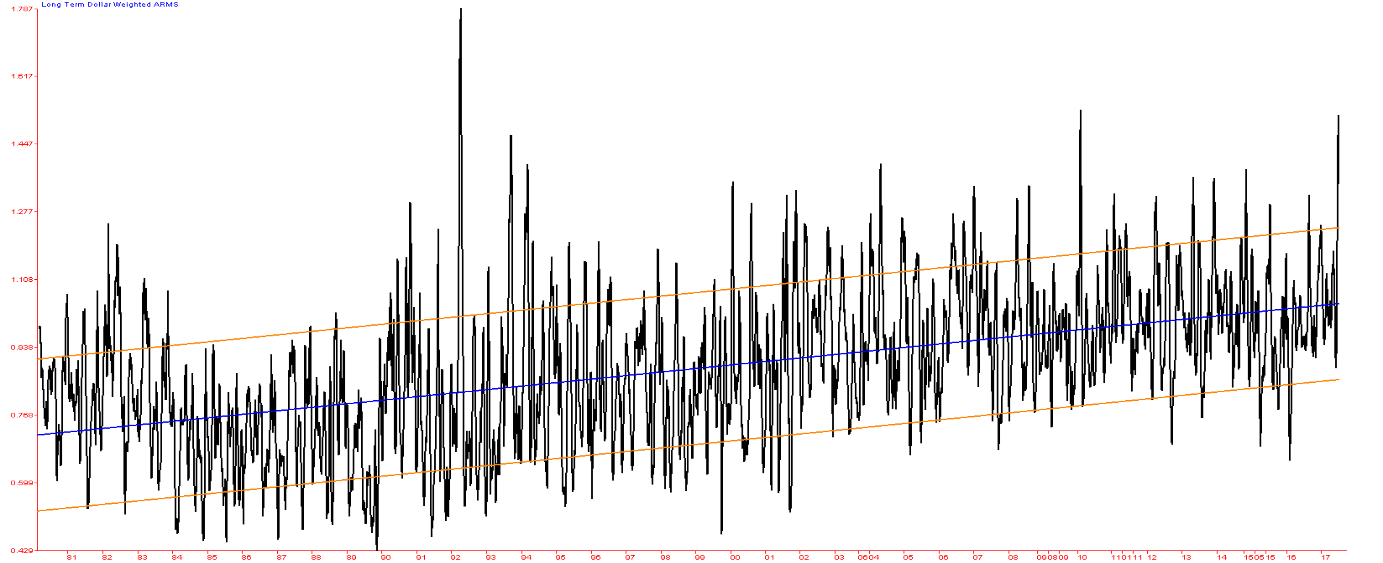
Above: Volume Weighted ARMS Index
To that end, we will start with the chart above, which plots the daily data for an indicator we call the Volume Weighted ARMS Index. This is an intermediate term gauge and the chart you see above goes back to 1979 and thus covers a period of 38 years. What you can see on the far right is that readings on this gauge over the last week or so have been among the highest values ever seen, specifically the third highest cluster of oversold readings ever seen. That, in and of itself, is no small trick. But there is much more to understand about this graph.
Notice that from the left side of the chart to the right side of the chart, the middle horizontal line is upward sloping and that the data set has embedded within it, an upward long-term bias. The reason for this is that over long periods of time, trading volume on the exchanges has tended to consistently increase and the volume in Gold Stocks has followed a similar path, especially with the advent of the very popular GDX and GDXJ ETFs. Thus, to help make more sense of this data, we plotted a least squares linear regression line through the data and that is the middle line. We then plotted regression boundary lines two standard deviations around the middle line. Mind you, on the ARMS Index, high readings, as have been seen over the last few days, are indications that there has been a great deal of selling taking place on the stocks within the group that have been going down relative to buying pressure on the stocks within the same group that have been going up. High ARMS Index values imply an oversold market condition, while low readings suggest an overbought market condition. In general, the ARMS Index is a much better bottom finder than a top finder, and high ARMS Index values are often coincidental to important lows.
To take the indicator to its next level, and make the data easier to compare over time, we then detrended the data as a percentage oscillator above and below the long term least squares regression line. What we see is the resulting gauge plotted against the XAU Gold and Silver Mining Index shown in the top clip.
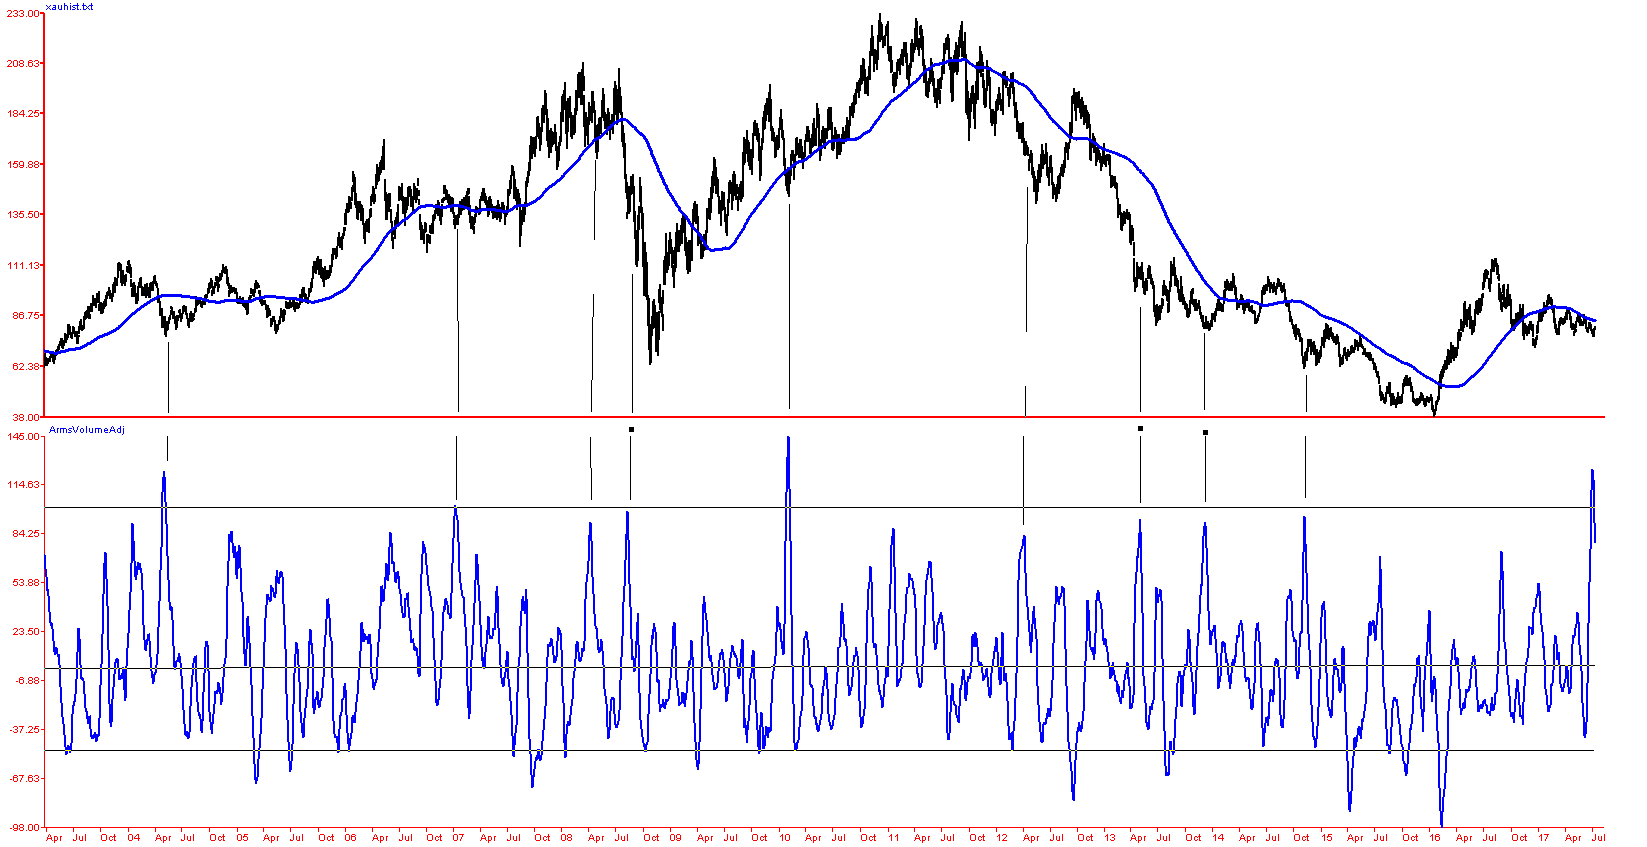
Above: Volume Weighted ARMS Detrend Oscillator.
In this context, we see that the recent oversold values were (even on a volume adjusted basis), very high and suggest that a wash out bottom may have been seen in the last few days. In addition to the ARMS Index, we also keep tabs on just a straight ratio of Up to Down Volume. On this gauge, readings on the 100-day ratio at or near .80 have been a good overall indication that a bottom could be near. In bear markets, selling pressure tends to be more severe, so values as low as .65 to .70 can be seen. However, in bull markets, and especially corrective waves within bull markets, the .80 threshold has captured its share of meaningful intermediate term bottoms. Our base case right now, is that the Gold Mining stocks are ending an Intermediate Wave (2) corrective move down and getting ready for a much larger, extended third wave up.
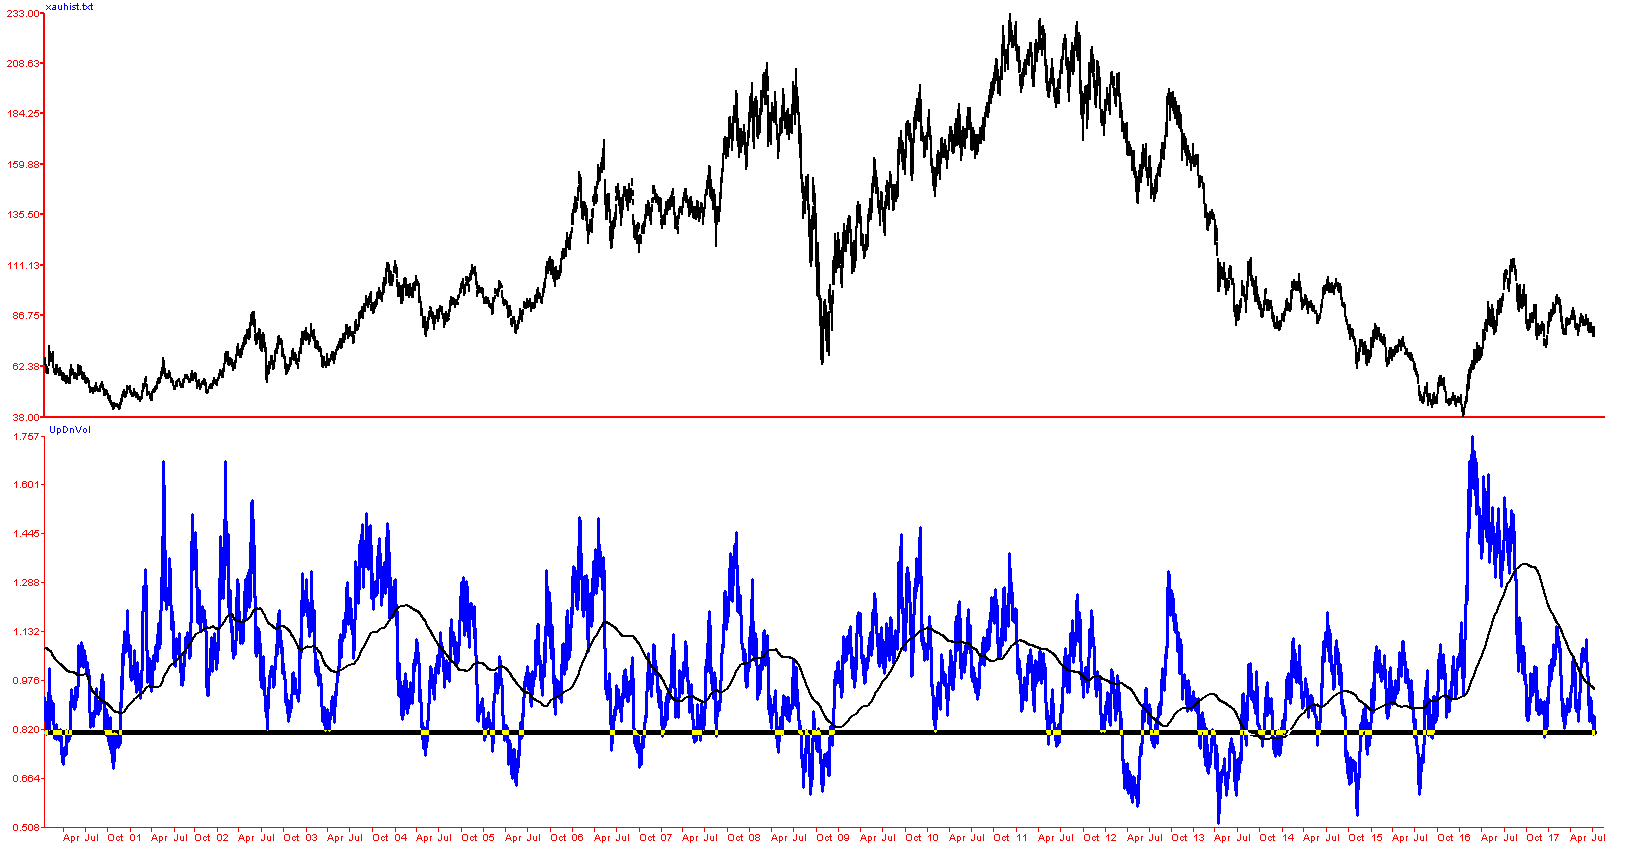
Above: Intermediate Up to Down Volume Ratio with 200 day Avg. and .80 lower oversold Boundary.
Moving along, on the next page, we have a more complicated chart. (Apologies in advance, if this one is hard to read, but we tried to pack alot of information in one graph). The chart shows the Weekly XAU Index from 1996, along with a 14 week RSI in the middle clip and a 50 Week (nearly one year) Slowed Stochastic gauge at the bottom. Both RSI and Stochastic are overbought and oversold momentum gauges. Of the two, RSI is the much better tool. We seldom use Stochastics but when we do we use the slow stochastic as it smooths out the results.
Starting with RSI, the traditional overbought and oversold boundaries are +70 and +30. However, in bull markets that scale for RSI tends to go through an upward shift with readings near +80 as overbought and near +40 as oversold. That is “80/40 Rule” for bull markets on RSI. At the same time, because bear markets will plumb the depths of deeper oversold territory, RSI tends to shift down from 70 & 30 to readings of 60 & 20. That is the ”60/20 Rule” for RSI in Bear Markets. In our view, last year’s stunning upside reversal in Gold stocks moved them, out of bear market territory and into a larger bull market trend.
The pull back that has been taking place these last many months is a standard Elliott Wave retracement of the preceding wild advance – a Wave (2). So far, that retracement has been largely contained at the 50% level using a weekly logarithmic chart. This is shown in the close up view at the top of page 5. Getting back to RSI, we note that both the December low of last year and the recent July lows have seen the weekly RSI decline to levels near +40, having peaked the preceding up wave near +80. In other bull markets, this type of 80/40 behavior was very common and frequently produced important intermediate term lows. We highlight these with the blue ellipse.
It is also worth pointing out that the two-year moving average of about 100 weeks is currently rising (in bull configuration) and prices are pulling back to it from above. The yellow rectangles highlight RSI action during bull phases of the last two decades.
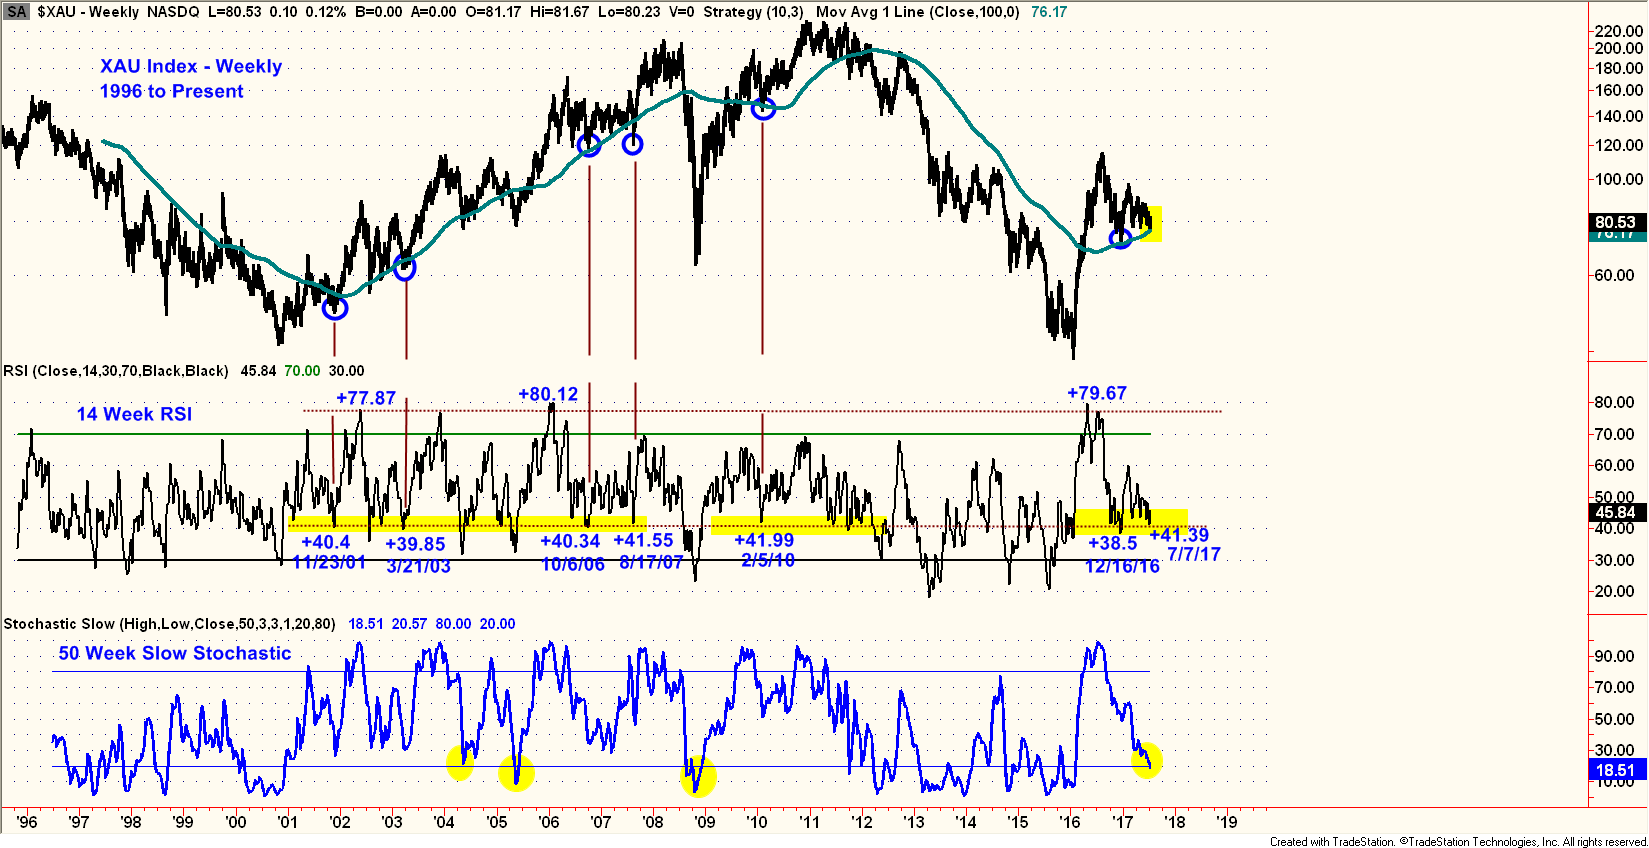
On the lower clip, Stochastic is also now down to “oversold” values near +20. Generally, we are not a big fan of stochastics and rarely use them because they tend to get pinned rather easily at bullish or bearish extremes when big trending moves in either direction get started. A 50-week stochastic really simply tells you where you are relative to the range of the last 50 weeks.
Yet sometimes these gauges can be useful in spotting turning points and right now, because this large counter trend corrective move has been in progress for a long period of time, coming up on one year, we think there’s a good chance it is throwing an accurate spotlight on what could be a major inflection point. Note that this is one of only a few periods in the last two or so years, where within the confines of a rising 100 week moving average, we have
seen both RSI near +40 and Stochastic near +20. That combination hints that this could be the end of a large A-B-C correction coming down from the highs last year at $114.70 on the XAU and $31.80 on the GDX.
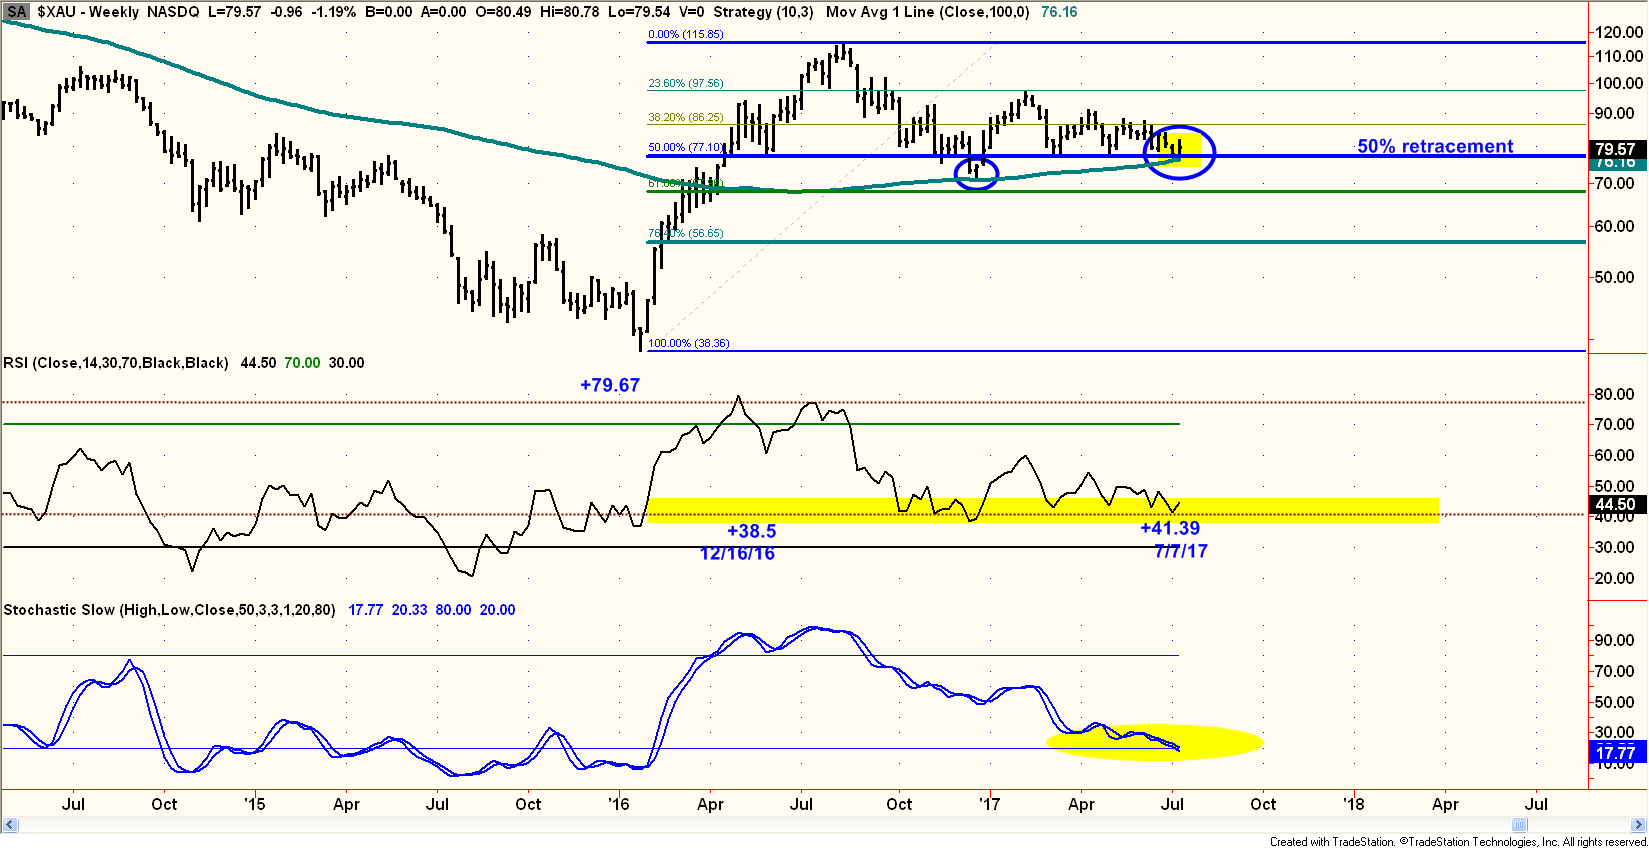
Above: Close up view of weekly XAU with RSI and Stochastic.
Switching from XAU weekly to GDX Weekly, for a moment longer, we can point out that on the GDX Weekly chart, there is a well-defined horizontal support level present at the $21 to $21.10 zone and that includes the lows of July, May and March 2017. Below that is the more major support at $18.60 which is defined by the December 2016 lows. We currently believe that it would take a serious break down in the Gold price below $1200 to bring that kind of retest about, and that seems fairly unlikely. In addition, as we have pointed out in other recent updates, the Producer space of the Gold Mining sector, names like Barrick Gold, Goldcorp, Newmont etc. are already down to levels very close to those equivalent December lows. It is the presence of other stocks that are not as correlated to
Gold directly, such as royalty companies and a few strange producers that have unusual characteristics that have managed to keep the XAU and GDX up above the former December lows. Our Salem Producers Only Index shows a better picture of the current situation and is virtually down to a test of the December lows right now.
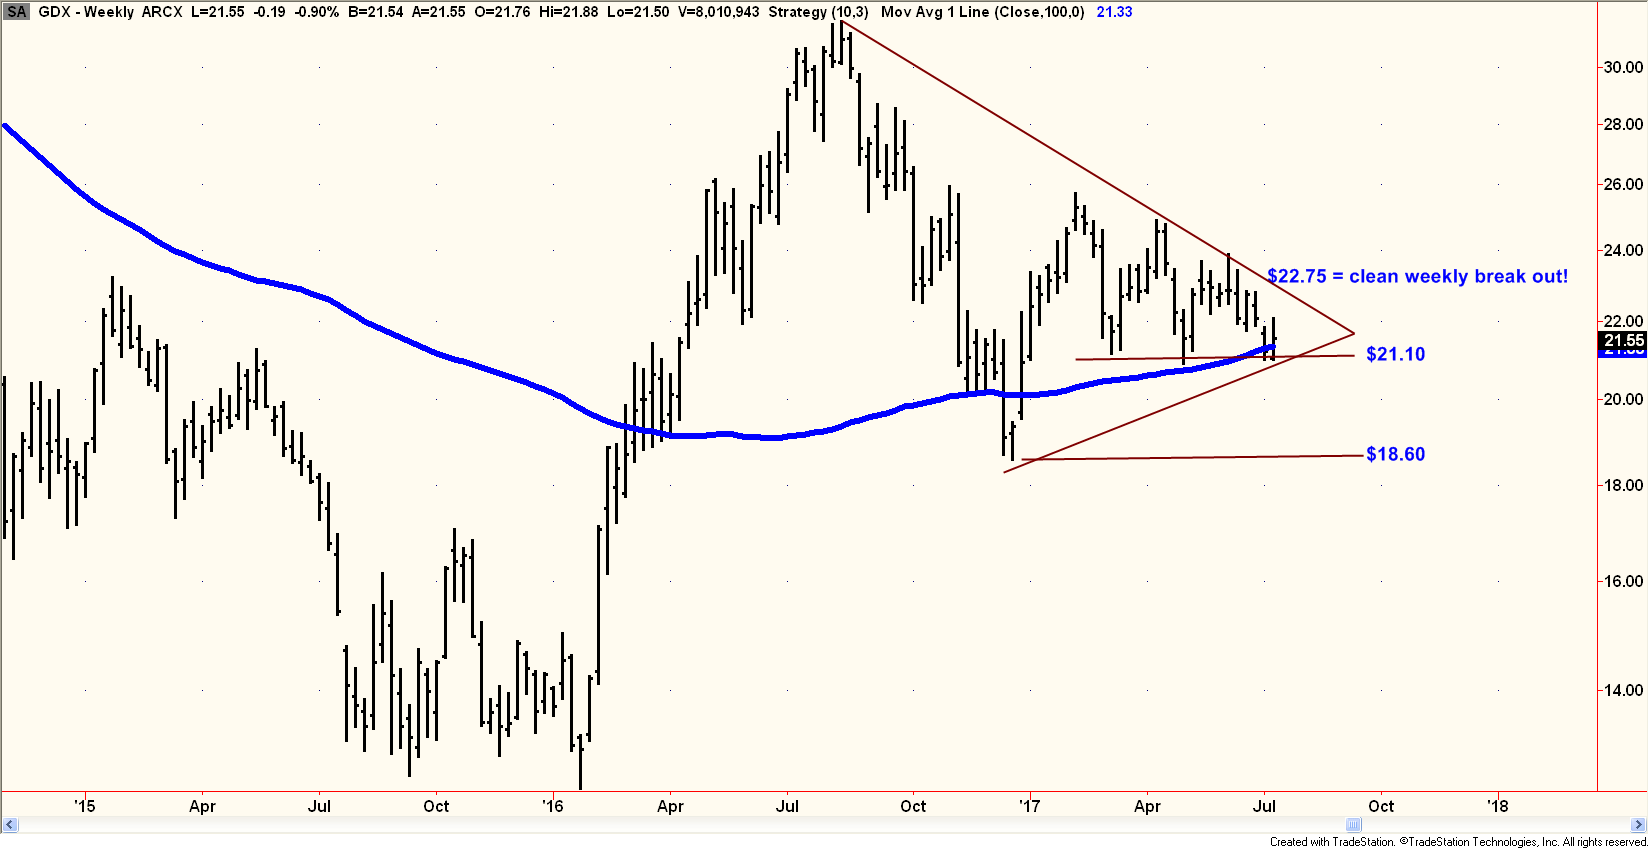
Above: GDX Weekly chart with horizontal support and resistance trend line
Above: Salem High Correlation Producers Only Index which is already down to area of December 2016 lows.
For the GDX ETF, any weekly close going forward above $22.75 would be a clean upside break out of the long down trend line that has governed the corrective pattern of the last 12 months. It is also worth pointing out that on a Relative Strength basis, the Gold stocks versus the S&P 500, that ratio is also right now down to an important support zone and appears to be trying to turn up.
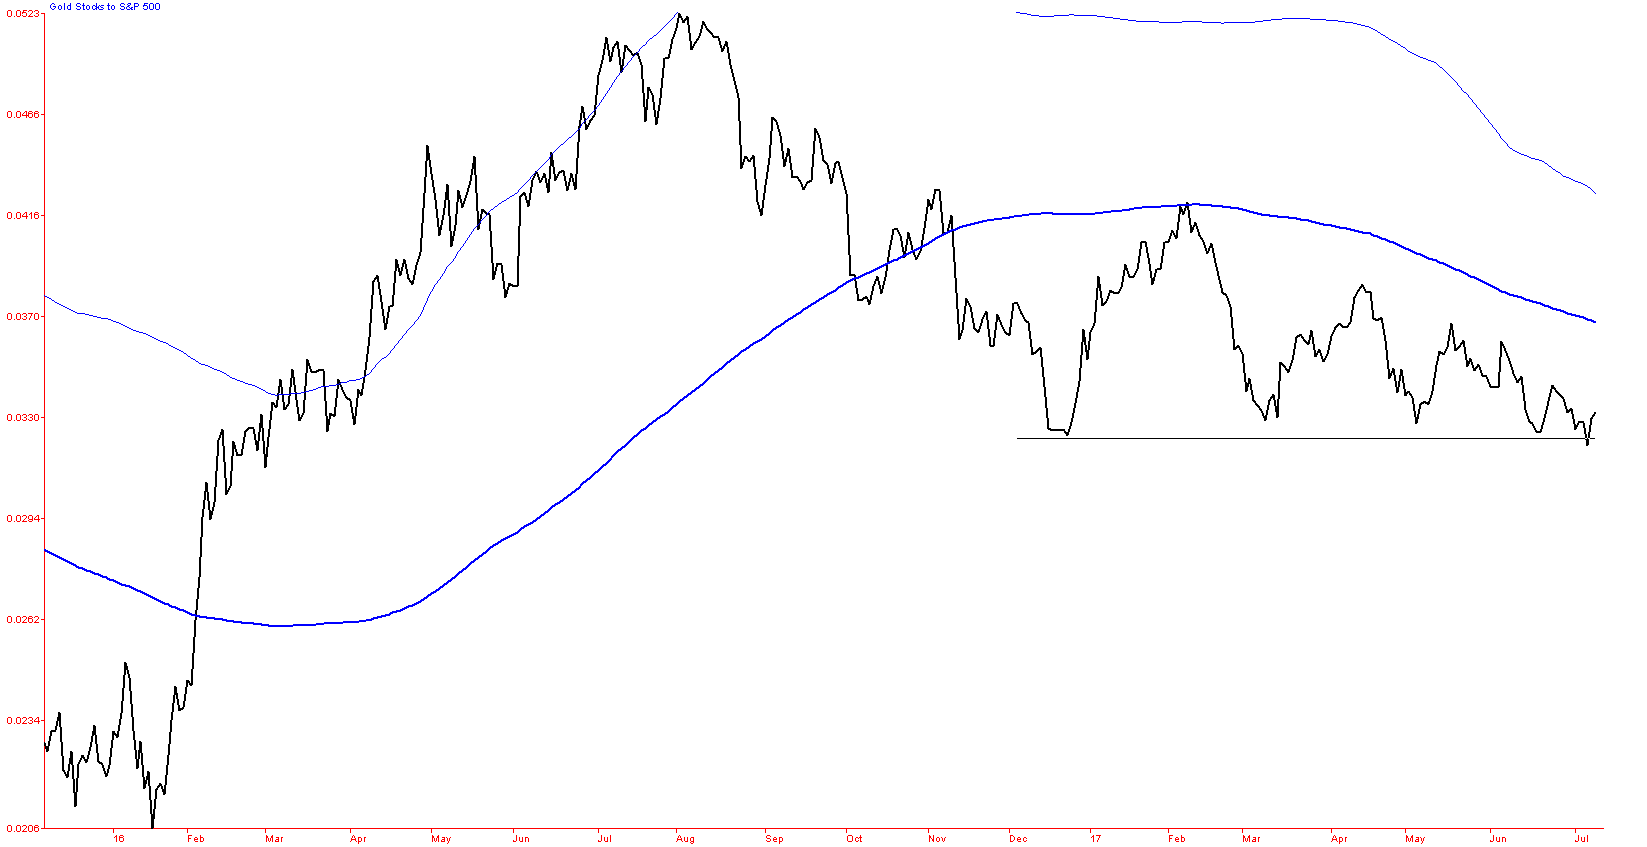
Above: Relative Strength of Gold Stocks to S&P 500. This ratio is down to the former lows and a key support threshold.
Other gauges that are also pointing the way to a potentially major low in the Mining sector at this time are both the Medium-Term Advance-Decline Oscillator and the NEW TRIN. Starting with the A/D Oscillator, this indicator includes a broad spectrum of gold and silver mining companies and takes the net plurality of advances less declines each day. It then uses this data to create an oscillator that ranges between +30 and -30. When the gauge is down to -30 or lower, it is a solid bet that the Gold stocks are deeply depressed. Sometimes, the extreme oversold value is actually seen a bit in front of the actual final low and the actual final price low comes in at an oscillator reading that is less negative. In recent years, some of the prior important bottoms were seen at values of -37.22 on 3/9/17, -28.90 on 12/15/16, -23.58 on 3/11/16, -12.29 on 11/17/15, -39.08 on 5/28/14, -16.14 on 12/20/13, and -22.21 on 6/26/13. The most recent oversold value was seen on July 7th, 2017 at a value of -30.22 and that was Friday of last week.
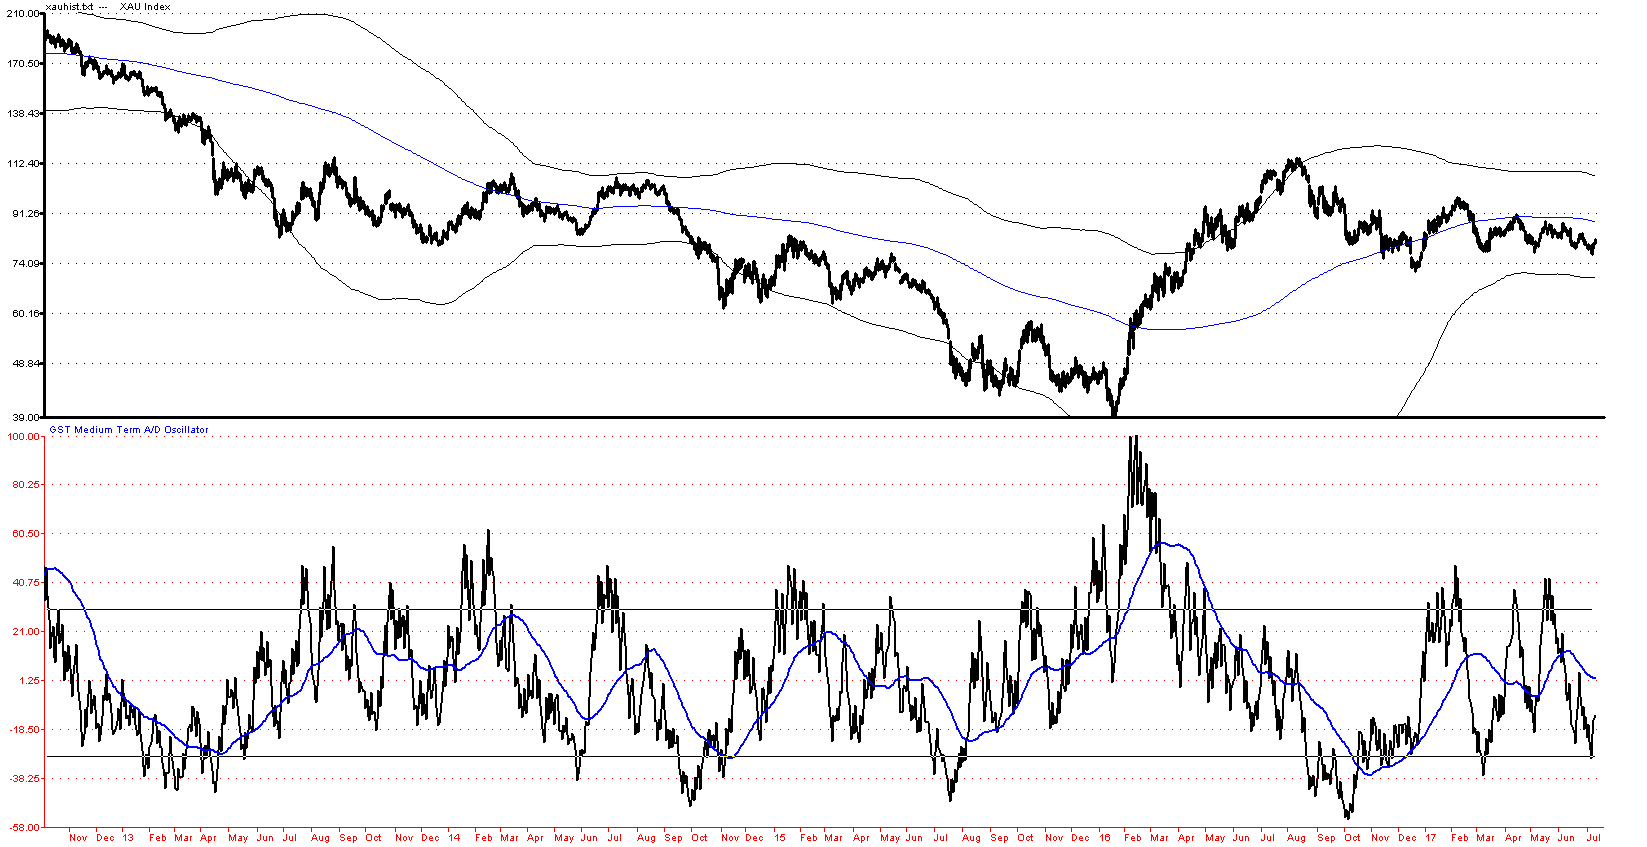
Above: Medium Term Advance-Decline Oscillator
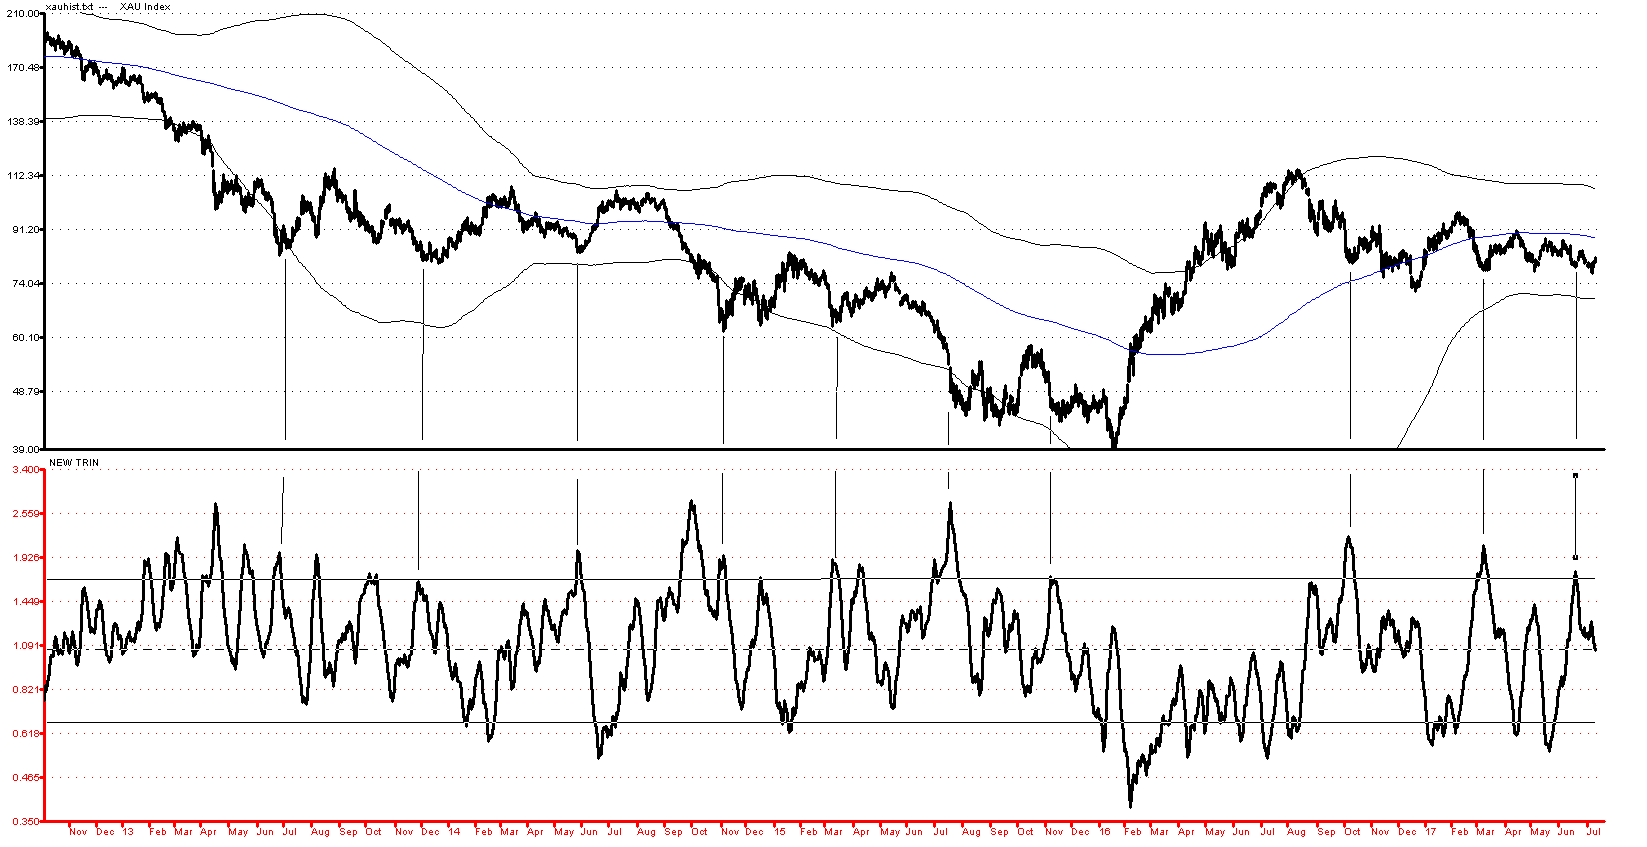
Above: The Intermediate Term NEW TRIN
The last gauge for Gold Stocks, which I consider to be one of my most important is the ARMS Index that I call the NEW TRIN. This is a slightly different formulation than the similar indicator shown at the beginning of this report, but of all my medium-term gauges, this is probably my favorite and most trusted tool. The NEW TRIN hit a bell ringing oversold value of 1.752 on June 20th, 2017 and was a primary motivator for me to begin writing these reports once again. It motivated me to pen, the very next day, one of the first articles on Gold Stocks in many years. We then posted that article on the website of our good friends at Financial Sense.com http://www.financialsense.com/frank-barbera/gold-mining-stocks-back-up-truck
Since late June, NEW TRIN has come down off the highs, which is not surprising at those levels because it takes very concerted selling to (A) achieve, and (B) to sustain. At a reading of 1.05 last night this is still a long way from overbought and does not preclude the potential for a major twenty to thirty percent move higher in the group. What it really tells us is that the bottom near June 20th, had panicky levels of fear associated with it, and then the subsequent low on July 7th also generated high levels of fear rippling through and reflecting in the Volume Weighted ARMS shown on page one and two of this report. Together they paint a picture of a kind of slow rolling bottom, replete with fear and nervousness, the key contrary elements necessary for a potentially major turn.
In addition to the technical indicators, we also note that GDX has not hit its upper 100-day Bollinger Band in many weeks. Through last night’s close, it has been 236 days since GDX last closed outside its 100 day upper Bollinger Band. That band is presently at a reading of $24.38 and should be in the area of $23.70 to $24 over the next few
weeks. In the past, in non-bear market environments, we have seen typical turns to the upside which have ended the time span counter tally as follows: In May 2009, a streak ended at 291 days, in July 2007 a streak ended at 291 days, in August 2005 a streak ended at 183 days, in September 2004 - 178 days, September 1994 - 165 days, April 1985 -272 days, February 1984 - 185 days, February 1989 - 169 days, July 1992 - 257 days, and January 2002 - 157 days. These were 10 of the longest streaks measuring 150 days or more going back to 1979. The average of the ten was 214.80 trading days. At 236 trading days right now, one can make a solid case that the Gold Stocks are in the zone time wise for a potentially important bullish reversal.
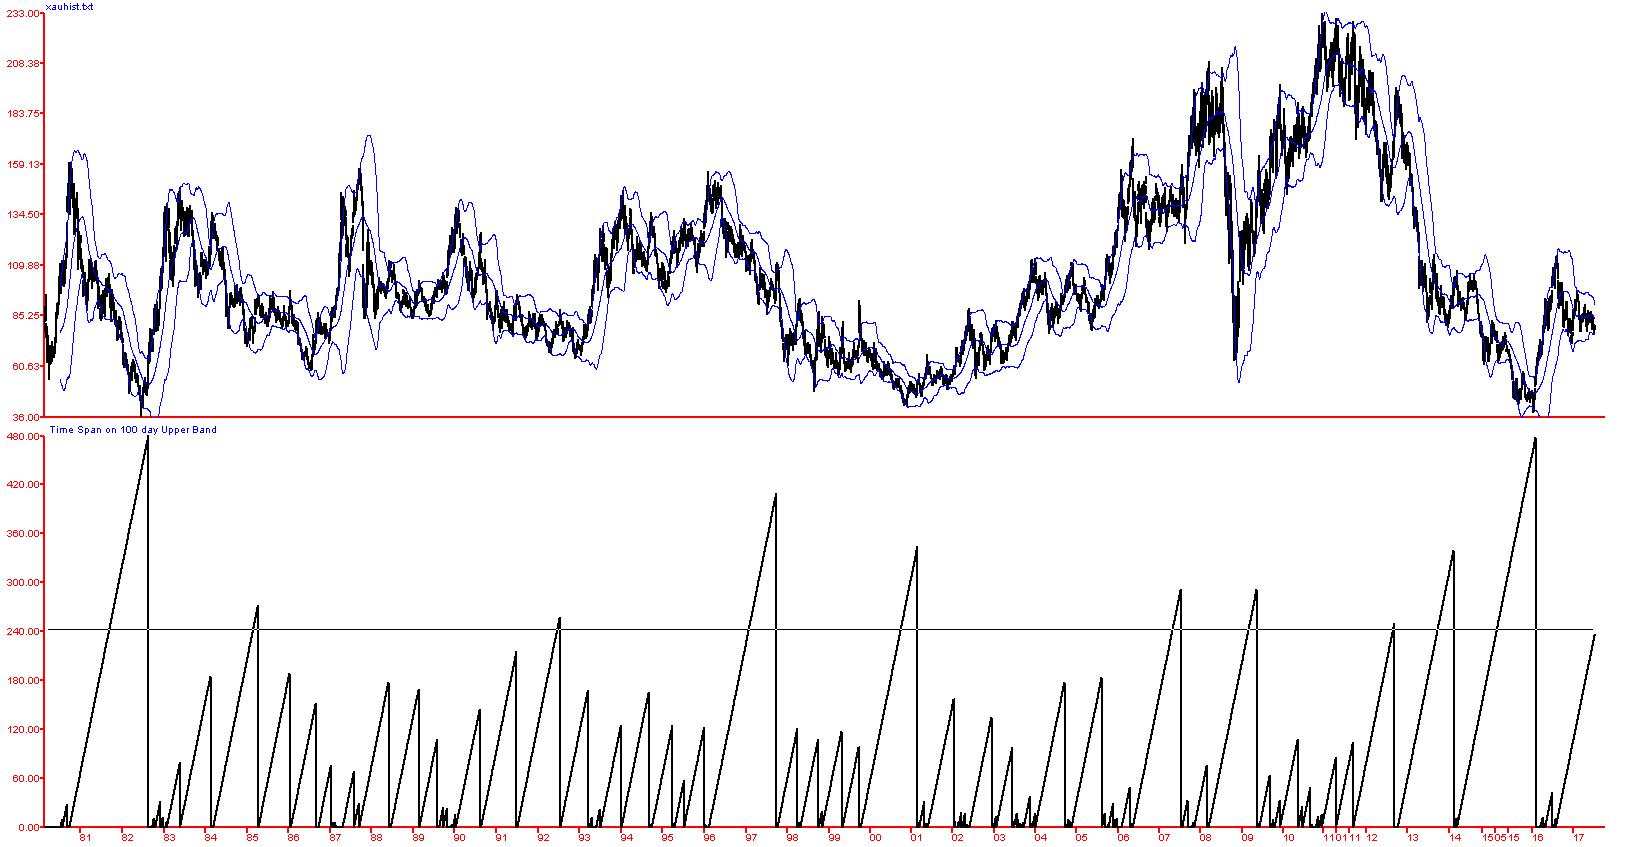
Above: XAU Index with Time Span counter showing # of days with no contact on 50 day upper band.
Physical (Spot) Gold
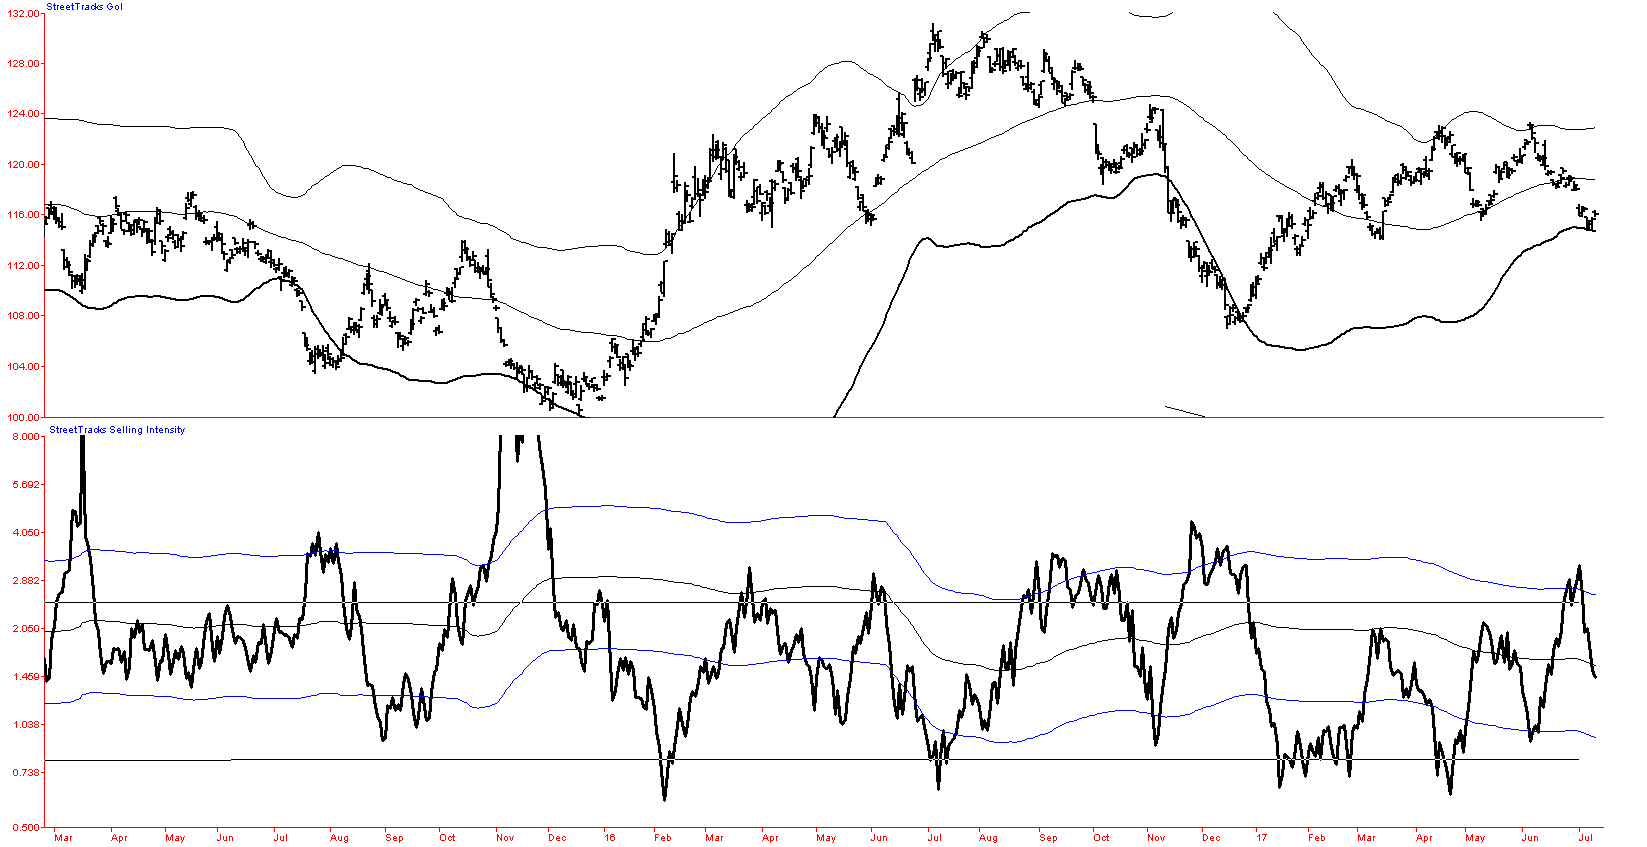
We continue to believe that Gold prices are also near a major bottom as they are holding support at key Bollinger Bands. Just a few days back, we saw deep medium term oversold readings on our Selling Intensity gauge (see below) for GLD, the widely held Gold ETF
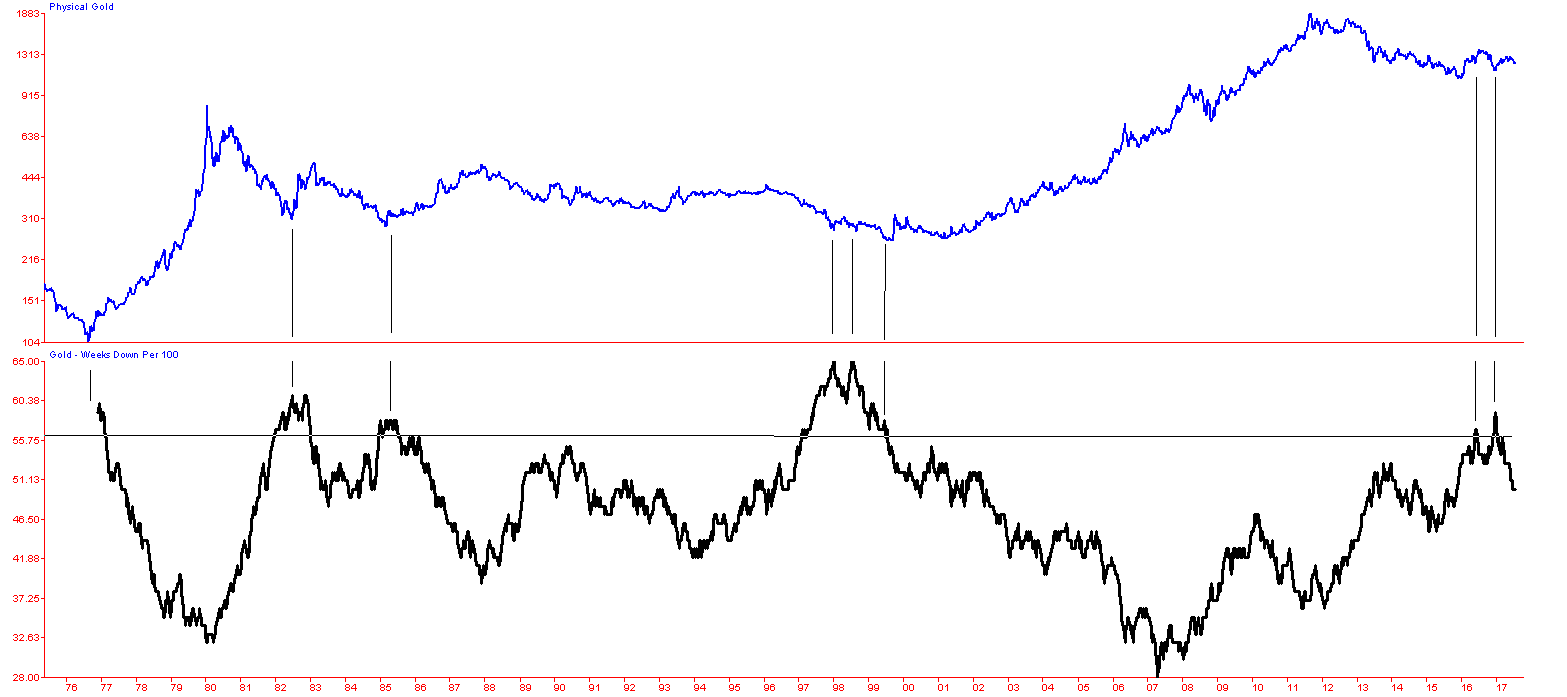
Above: Physical Gold - Weekly 1970 to Present with Weeks Down Per 100 Gauge
In addition to medium term signals, we want to update and remind readers that last year, at the very important December low, we saw values that pulled us back into the market for Gold and Gold Stocks. Unfortunately, at the time, we were not in a place where we were able to restart these reports. Yet, one of the gauges that spoke loudly to us back then was the Down Days per 100 Week Gauge on Spot Gold. Usually, large trending down moves - Bear markets in Gold, will drive this gauge up to readings above 55. That means that on a rolling 100 week basis there has been 55 down weeks out of the past 100 total weeks. In December, the “Gold Down Weeks per 100” gauge paked at 59 weeks, and that is consistent with a number of other bear market ending values.
The prior bear market bottom between January 1998 and July 1999 recorded a whole string of weekly closes above 55, with values of +63 on 1/23/1998, +65 on 7/31/1998, and +57 on 7/9/1999. Prior to that, a value of +58 weeks was seen on 3/1/1985 with Gold at $287.50 per Ounce, and that marked a major low. By December 1987, Gold was trading at $496.25 per Ounce, up 72.6% from the March 1985 lows.
In 1982, we saw a reading of 61 weeks with Gold at $305.50 per oz on June 25th 1982 and that gave rise to a major advance that reached $504.50 per oz by February 1983. Finally, way back in late November 1976, Gold had been declining for almost two years, and Down Weeks per 100 moved up over 55 with a value of 59 weeks on 11/26/76 with Gold at $130.25 per oz. By 1/18/1980, Gold was trading at $835 per oz. All in all, we continue to believe that this sector is now ripe and probably in the middle of a major reversal to the upside. Please follow the link below to sign up for future complimentary Salem Capital Markets Outlook Newsletters.
********
Disclosures:
Salem Partners Wealth Management and the Salem Capital Markets Outlook is sent to our clients and friends to share some of our views on current markets. Materials in this report are copyrighted and proprietary to Salem Partners Wealth Management (SPWM) and may not be reproduced or distributed without our expressed written approval. All rights are reserved. Past performance is no guarantee of future results. All opinions expressed constitute Salem Partners Wealth Management’s judgment as of the date of this report and are subject to change without notice.
This information should not be used as the primary basis for investment decisions. It should not be assumed that any security transactions, strategies, holdings or sectors discussed were or will be profitable, or that future recommendations will be profitable or will equal the investment performance discussed herein. Investing in equities and other securities involves risk to your principal. Individual client account performance will vary and no guarantee of any kind is made as to the results that may be obtained from using these reports. These reports are impersonal and do not provide, nor are they intended to provide, individualized advice or recommendations for any specific audience or portfolio. To the maximum extent permitted by law, Salem Partners LLC, Salem Partners Wealth Management and the authors of these reports disclaim any and all liability in the event that any information, commentary, analysis, opinions or advice contained in these reports proves to be inaccurate, incomplete or unreliable, or result in losses on any investment. The information provided in these reports is obtained from sources which the author believes to be reliable. However, the author has not independently verified or otherwise investigated all such information. Neither the author, nor SPWM guarantees the accuracy of any such information.

Frank A. Barbera, Jr. CMT joined Salem Partners Wealth Management in 2015 and has over 28 years of experience in the global capital markets. Prior to joining Salem, Mr. Barbera was an Executive Vice President and Co-Portfolio Manager for the Sierra group of mutual funds including the Sierra Core Retirement Fund (SIRIX) and the Sierra Strategic Income Fund (SSIIX) where he helped managed more than $2 Billion in assets. Prior to Sierra, Mr. Barbera worked with Caruso Affiliated Holdings where he successfully managed the Caruso USA Hedge Fund LLC navigating successfully through both the 2001-2002 and 2007-2008 bear markets. In 2007, Mr. Barbera penned a long series of weekly articles on Financial Sense.com, which remain archived online, forecasting in advance many of the major corporate failures that were seen in 2008, along with much of the breadth and scope of the 2008 global financial crisis.
In 2003, Mr. Barbera was featured in the popular book published by the New York Institute for Finance entitled “Master Traders: Strategies for Superior Returns from Today’s Top Traders” Over the last two decades, Mr. Barbera has functioned in the role of Investment Strategist, Global Macro Economist, Portfolio Manager and Market Technician. From 1994 to 2012, he edited the bi-monthly newsletter, “The Gold Stock Technician” which focused on the technical outlook for equity and metals markets with a special focus on mining stocks. Mr. Barbera specializes in rules based trend following systems for both high and low volatility securities.
From 1991 to 2000, Mr. Barbera hosted two daily live television shows on the Business Channel, “ChartWatch” and “Technically Speaking”. From 1998 to 2013, Mr. Barbera acted as a consultant to several large scale institutional trading desks including Bel Air Capital in Los Angeles as a trading advisor on their multi-billion dollar Core Equity portfolio.
A student of Austrian School Economics and Minsky Boom/Bust credit market dynamics, Mr. Barbera has been widely quoted in the media and on TV including Fox Business News, CNBC, The Wall Street Journal, Investor’s Business Daily, Money Magazine, the Washington Post and Barron’s, Mr. Barbera is a frequent guest speaker at Investment Conferences across the United States, where he remains in high demand.


