Gold Price Forecast: The Gold Bulls Are Back In Town


Last week's trading saw gold forming its low in Monday's session, here doing so with the tag of the 1873.30 figure. From there, a sharp rally was seen into late-week, with the metal running all the way up to a Friday peak of 1961.80 - before backing slightly off the same into the weekly close.
Gold, Short-Term
For the short-term picture, as mentioned last weekend our smallest-tracked wave - the 10-day component - was at or into bottoming range, and with that was expected to see a sharp short-term rally. Here again is that 10-day cycle:
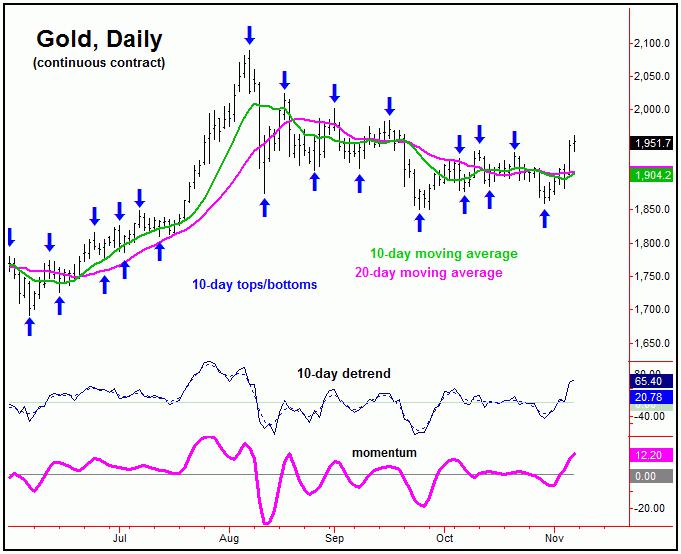
In terms of patterns, the upward phase of this 10-day wave did play out as expected into last week. The rally phase of this wave was originally expected to end up as countertrend, holding below the 1939.00 swing top.
Having said that, in our Gold Wave Trader report, we noted the 1941.00 figure (December, 2020 contract) as being our upside ‘reversal point’ for the larger 72-day cycle - and thus the entire swing down.
Shown again below is that 72-day cycle component:
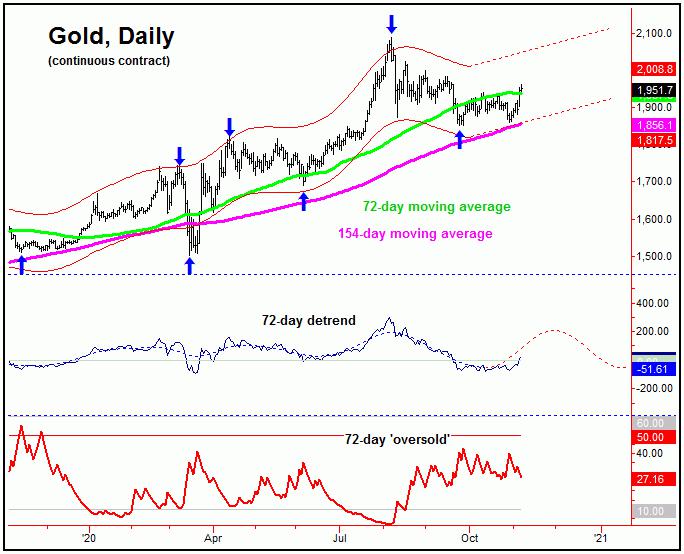
The fact that gold was able to take out the 1941.00 figure in Thursday's session is now our best indication/confirmation that the 72-day cycle bottomed out back in late- September - and with that is headed back to the upside in the coming months.
In terms of price, while many analysts were calling for a sub-1700's for gold into September-October, we noted back in late-August that the 1830's (plus or minus) as being a key support level for the metal. Take a look at our next chart:
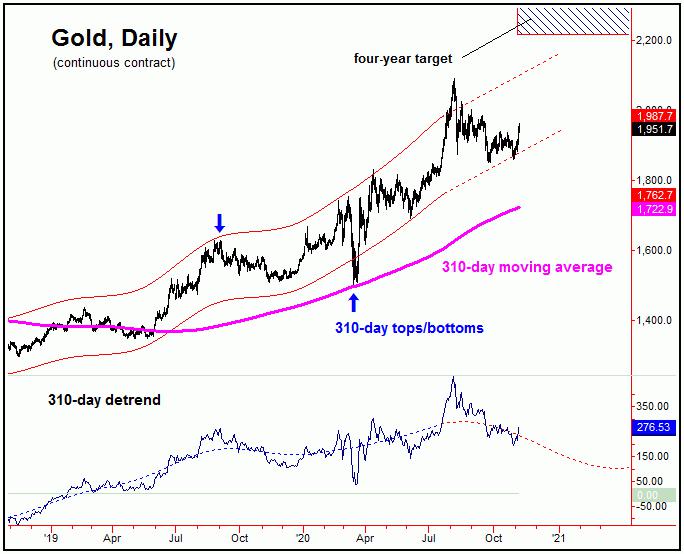
The chart above shows one of our largest-tracked cycles, the 310-day wave - which is next projected to low-out around the Spring of next year. In-between, however, the expectation is looking for one more push back to new all-time highs, with the decent potential for that move to reach up to the 2200-2300 region, before setting up the price peak for this 310-day cycle.
From my August 30th, 2020 article: "our 310-day chart offers up some key additional information. That is, the channel that encloses the action comes from this same 310-day cycle, and - for this channel to remain pointing higher - any price decline would need to hold at the bottom of the same (plus or minus). The bottom of this 310-day cycle channel is currently around the 1830's for gold (December, 2020 contract). In other words, if this level should be tested at any point going forward, it would be the most ideal re-entry for the long side of the market."
As mentioned above, the lower 310-day channel line (noted at the 1830's back in August) was a key support level for gold. The actual bottom came in at the 1851.00 figure back in late-September, which was right into this range - as the lower 310-day channel line is always a 'moving' support level.
Gold's Mid-Term Picture
With the above said and noted, last week's reversal back above the 1941.00 figure is our best indication that the larger swing down from the August highs is complete - and that a push back to new all-time highs is next stop. With that, traders with a mid-term mindset should now be looking at buying correction phases into smaller-degree lows - such as with the aforementioned 10-day cycle, which is looking for its next downward phase to soon materialize.
Stepping back, the next mid-term peak is expected to come from our 310-day cycle in the coming months. That peak - once set in place - is favored to give way to a larger- degree decline into the Spring of next year, one which is anticipated to end up as a bigger countertrend retracement - inside a much larger (bullish) upward phase within the four-year cycle in gold.
The Bottom Line
The overall bottom line is that gold's countertrend correction looks complete with the decline into late-September. If correct, the ideal path is looking for new all-time highs in the weeks/months ahead, though with the decent potential for that move to reach up to the 2212.00 - 2340.56 region into early next year - before setting up our next mid-term peak for the metal. More on all as we continue to move forward.
Jim Curry
The Gold Wave Trader
http://goldwavetrader.com/
http://cyclewave.homestead.com/


