Gold Price Forecast: Gold Cycle And (Key) U.S. Stock Market Update


Last week's trading saw gold forming its high in Monday's session, here doing with the spike up to the 1966.10 figure. From there, a sharp decline was seen into later that same day, with the metal dropping all the way down to a low of 1848.00 - before spending the balance of the week in an upside consolidation off the same.
Gold Market Update
For the short-term picture, the last smaller-degree peak was expected to come from our smallest-tracked wave, the 10-day cycle:
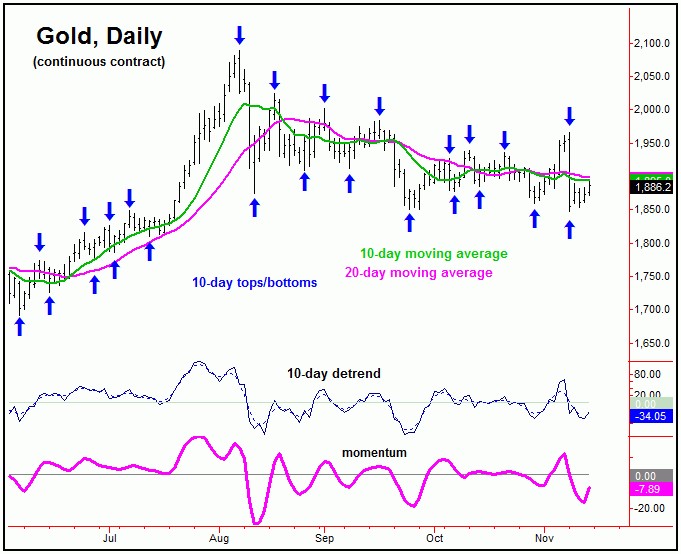
With the action seen into Monday of last week, this wave obviously topped out at the 1966.10 figure. Having said that, though a decent correction with this 10-day cycle was favored to play out, we wanted to see that correction holding above the 1851.00 swing low (from late-September).
As mentioned in my prior article, the November 5th reversal above the 1941.00 figure (December, 2020 contract) was our best indication that the larger swing down had bottomed - and with that the probabilities favored a push back to new all-time highs in the coming weeks/months.
Thus, with the recent drop back to lower lows into early last week, we either saw an extremely left-translated peak for the 34 and 72-day cycles - or else are still in the correction phase with these waves.
Shown again below is the 34-day cycle for gold:
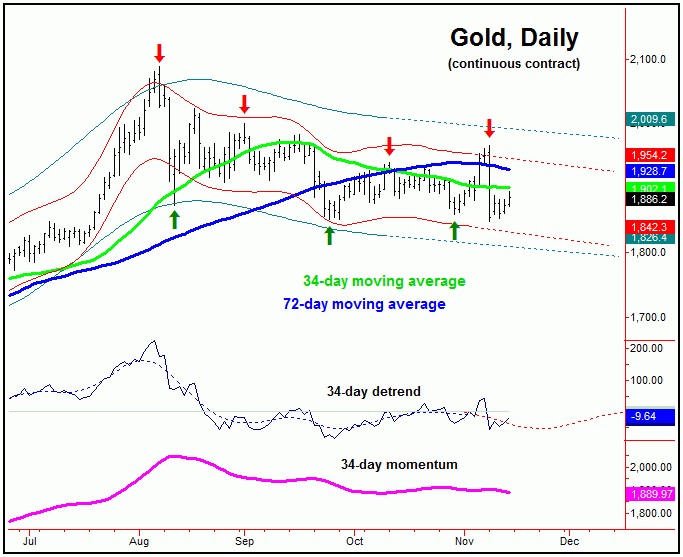
With the action into last week, we are (tentatively) labeling the 1966.10 swing high as a left-translated peak for both the 34 and 72-day cycles. I note this as tentative, due to the fact that the 1851.00 swing low was not taken out on a closing basis - though obviously it was violated intraday.
Adding to the notes above, if the 34 and 72-day cycles did see left-translated peaks at the 1966.10 swing high, then a drop back to lower lows can still be seen in the days/weeks ahead, before the next larger swing low forms with gold. Either way, our assumption is that the swing down will end up as an eventual countertrend affair, holding above the June, 2020 trough of 1691.00.
In terms of trading, in our Gold Wave Trader report, we were able to go long the GLD (Gold ETF) within 2 trading days of the late-September low, and were able to exit that with the strength into November 5th - within 2 trading days of the recent peak. We then re-entered a small position into the most recent decline into early last week, and are looking for technical indications to add to this in the days/weeks ahead.
Gold's Mid-Term Cycles
Stepping back, with the action seen into last week, the larger 154-day wave has now come back into dominance, with that cycle shown on the chart below:
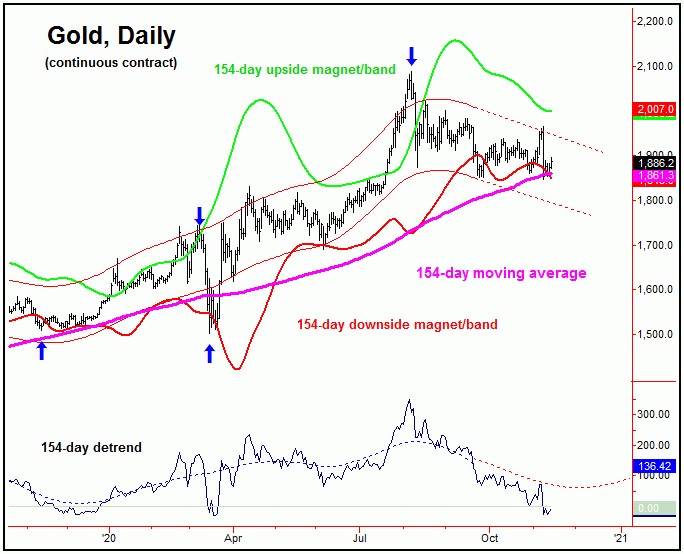
With the above chart, this 154-day cycle is projected to trough at anytime - and was ideally projected to low-out with the recent downward phase of the smaller 72-day cycle. However, with the potential left-translation with the smaller 34 and 72-day cycles, the low for this 154-day wave could still be out there - made at some point in the coming weeks, though from what price level is unclear.
For the longer-term picture, as mentioned earlier the overall assumption is that the recent decline phase will end up as countertrend, giving way to new all-time highs, upon completion. This is due again to the configuration of the larger four-year cycle, which is shown below:
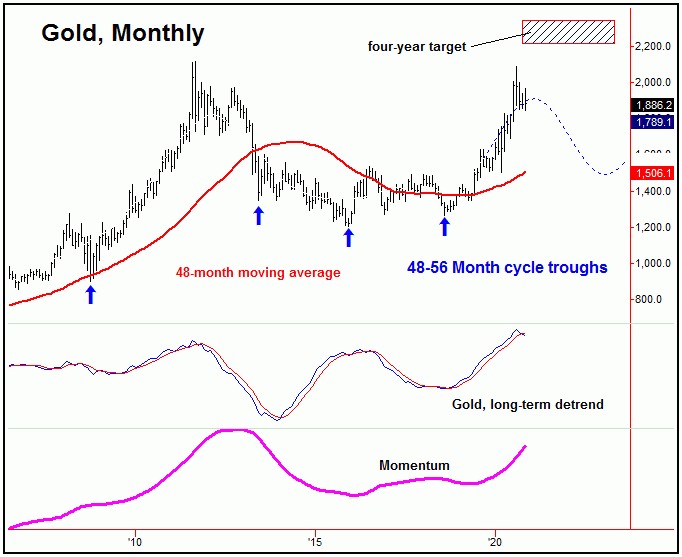
In terms of price, there is an open upside target from this four-year wave to the 2212.00 - 2340.56 region for gold, and with that we are continuing to favor buying opportunities into near-term weakness, in the anticipation of an eventual push into this target zone in the coming months.
Gold Market Technicals
In terms of technical action, of note this weekend is that the recent break to new price lows is being accompanied by a divergence in our Mid-Term Breadth index:
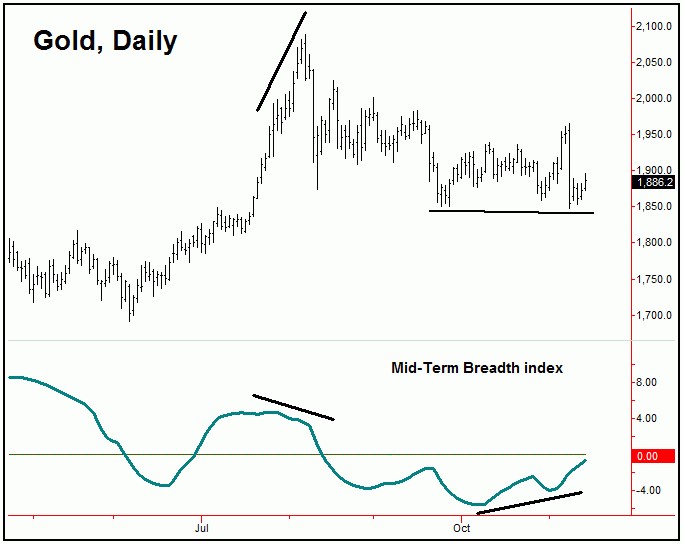
Our Mid-Term Breadth index for gold actually turned higher earlier this month, and is still pointing upward - in spite of the recent price weakness. This is seen as a firm technical positive going forward, as divergences in this indicator are normally seen prior to mid-term price bottoms for the metal.
The Bottom Line for Gold
The overall bottom line is that we may well have seen left-translated peaks with the 34 and 72-day cycles at the 1966.10 swing high. However, this is by no means clear-cut, due to the fact that the 1851.00 swing low was able to hold the action on a closing basis. Even said, for the mid-term picture I am still looking for the overall move down to end up as an eventual countertrend affair - to be followed by new all-time highs in the coming months.
U.S. Stock Market Update
The last key low for U.S. stocks was made back in late-September, coming as a result of the 45-day cycle, shown below:
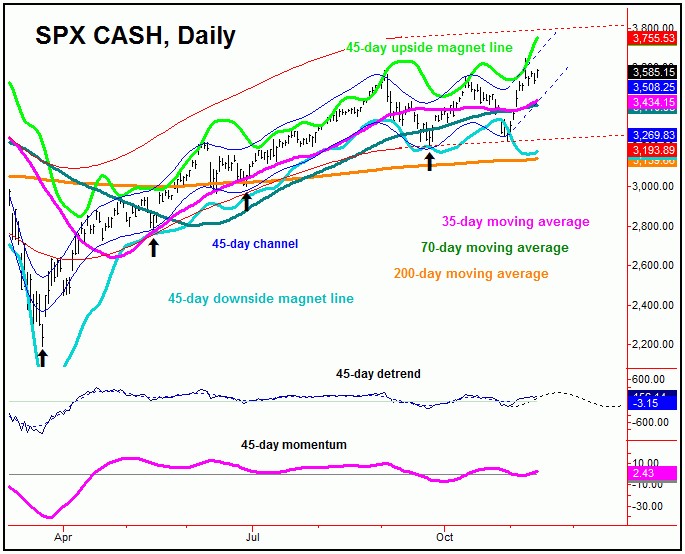
In terms of patterns, the decline phase of this 45-day wave was expected to end up as a countertrend affair - as it did do. In-between, there was another 45-day trough made back in late-October, which ended up as a contracted bottom for this wave, primarily coming as a result of the recent presidential election.
In terms of price, the strength seen into last week saw the SPX (S&P 500 index) making new all-time highs for the larger swing - which was eventually expected to materialize, due to the configuration of our larger 360-day cycle, which is shown again below:
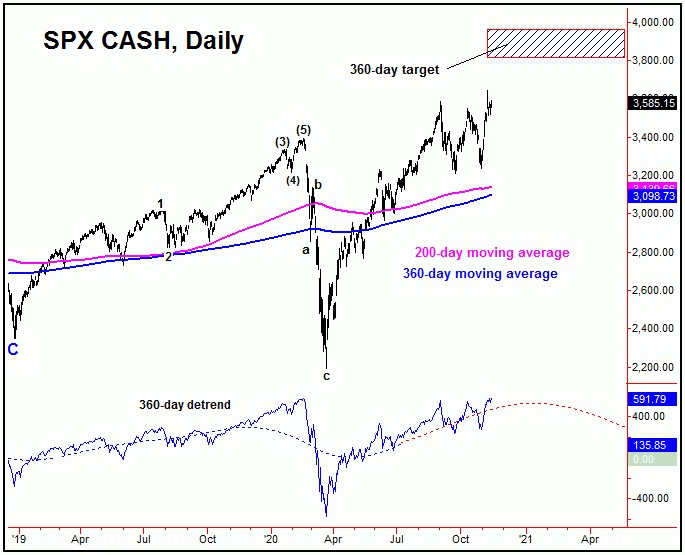
In terms of time, 360-day this wave last bottomed back in March, and with that is projected higher into late-Spring to mid-Summer of 2021. In terms of price, as pointed out in past articles, the ideal path is looking for a push into our open 360-day target zone of 3812.56 - 3960.44 SPX CASH in the coming months, with the upper-end of this range also acting as major resistance to the upward phase of this component.
Going further with the above, the next mid-term peak should come from this same 360-day wave. From whatever high that forms with the same, we are expecting a multi-month decline of sizeable proportions - with more exact details noted in our Market Turns report, which covers the U.S. stock market.
In terms of trading, in spite of the difficult year for the market, we have closed nearly all our index ETF trades with a gain, and are currently long from late-September. Having said that, there are some problems with the recent rally, with the biggest of these being the larger net shorts currently held by the commercial hedgers:
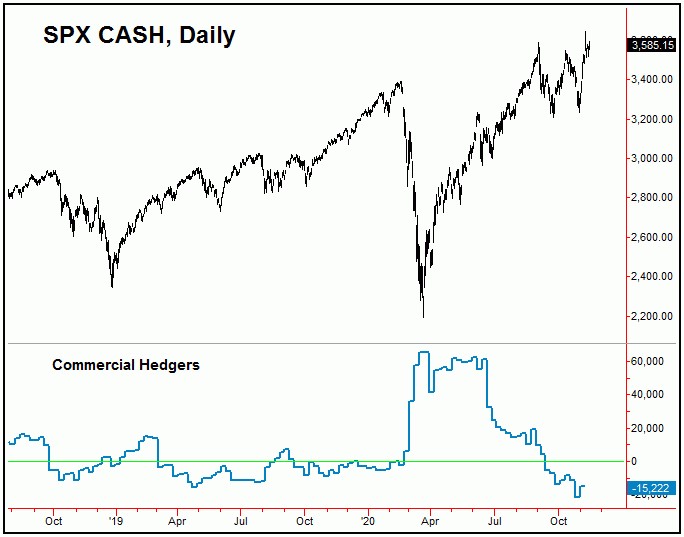
With last week's Veteran's day holiday, we won't get the latest numbers from the CFTC regarding the commercial hedgers until Monday of this week. However, the data that we currently have shows the hedgers holding a fairly large net short position of some 15,222 contracts, which is normally a bearish indication for the market..
With the above said and noted, the position of the hedgers has us very cautious here, as there is the risk to a larger decline phase in the days/weeks ahead. Even said, should that decline phase present itself, we would be looking at it as an indication to add to existing longs - in the anticipation of an eventual push up to our open 360-day target zone in the months to follow. Stay tuned.
Jim Curry
The Gold Wave Trader
http://goldwavetrader.com/
http://cyclewave.homestead.com/


