Gold Price Forecast: Gold Fails At Key Dividing Line


 Last week's trading saw gold rallying into Wednesday's session, with the metal running up to a high of 1835.90. From there, however, a sharp decline was seen into late-week, here dropping all the way down to a Friday low of 1759.50 - also ending both the day and week at or near the same.
Gold, Short-Term
For the very short-term, the most dominant smaller-degree cycle for the gold market is the 10-day wave, which is shown on the chart below:
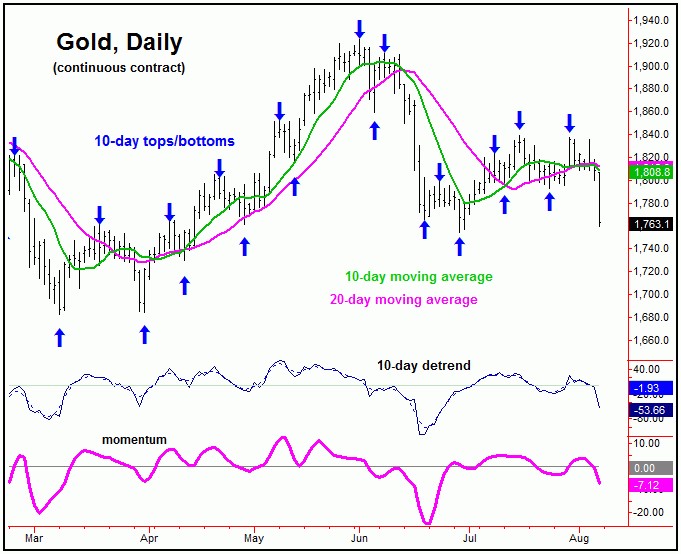
In terms of time, with Friday's new low in price, this 10-day wave is now some 10 trading days along from its last labeled trough - and with that is at or into normal bottoming range. Once the next low for this wave is in place, a sharp short-term bounce/rally is likely to materialize, one which sees the 10-day moving average acting as the ideal magnet.
Having said the above, in our recent Gold Wave Trader outlooks, we noted the 1793.00 figure to the downside as being the key level for the larger 34-day wave, which is shown on the next chart:
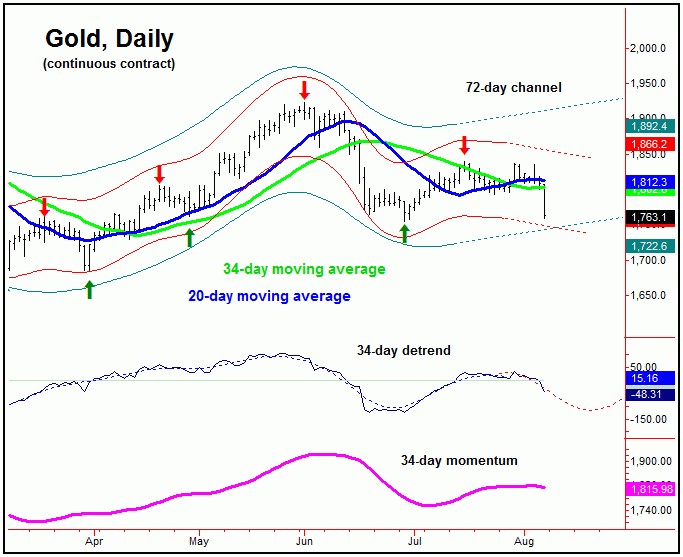
With Friday's reversal below the 1793.00 figure (December, 2021 contract), the downward phase of this 34-day cycle was confirmed to be back in force, which we noted put the risk back to the June bottom of 1754.30 - an action nearly met with Friday's sharp selloff.
In terms of time - if made on schedule - this 34-day wave is next projected to trough around the third week of this month. With the newly seen position of this 34-day component, the probabilities should favor the next upward phase of the smaller 10-day wave to end up as a countertrend affair, with resistance around the 1790's - a prior level of support for the metal.
Gold Rally Fails at Key Dividing Line
As mentioned in past weeks, gold's key dividing line was the 1839.80 figure on a daily closing basis. That is, a daily close back above that figure - if seen - would have triggered a final spike higher into the late-August to early-September timeframe, while below that level and the metal would remain in its current (weaker) configuration.
With the above said and noted, until a lower level materializes, the 1839.80 figure (closing basis) will remain as our mid-term dividing line going forward, with the downward phase of the 34-day wave now confirmed to be in force. Going further, that action should favor additional weakness into later this month, before bottoming this wave for another rally into September.
Stepping back, based on the action seen on Friday - as well as the new configuration of the 34-day cycle - the probabilities tend to favor the downward phase of the larger 154-day cycle to be back in force. Here again is that 154-day wave:
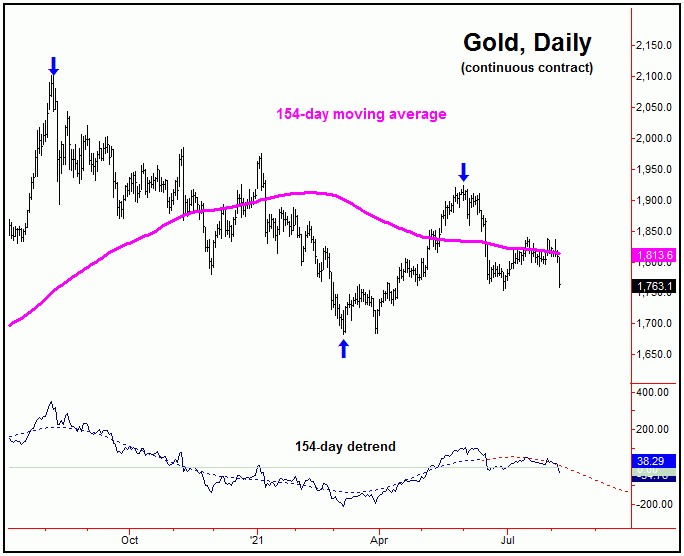
Going further with the above, taking out the June low of 1754.30 - if seen in the near-term - will be the best confirm of a turn south with this 154-day cycle. In terms of time, this cycle is next projected to trough around the mid-to-late November timeframe, but with a fairly large plus or minus variance in either direction - due to the size of this wave.
In terms of price, more key for the coming weeks is whether the March, 2021 trough of 1682 will be able to hold the current correction. In other words, if it is taken out in the days/weeks ahead, then the odds will also favor a topped 310-day cycle, which would tell us to expect the next 154-day upward phase into February or March of next year to end up as a countertrend move.
Summing It Up
The overall bottom line with the above is that gold is in the range for at least a short-term low following Friday's decline, with the next smaller-degree rally expected to come from the smallest-tracked wave, 10-day cycle. The patterns favor that move to end up as a countertrend affair (due to the position of the larger 34-day wave), giving way to lower lows into later this month, before a better-looking low attempts to form. From there, a decent short-term rally is likely to materialize into September, before turning south again into the Autumn months for a trough with the 154-day wave. Stay tuned.
Jim Curry
The Gold Wave Trader
http://goldwavetrader.com/
http://cyclewave.homestead.com/
*********


