Gold Price Forecast: Gold Into Mid-Term Bottoming Range


Last week's trading saw gold forming its high in Tuesday's session, here doing so with the tag of the 1913.80 figure. From there, a sharp decline was seen into later in the week, with the metal dropping all the way down to a Thursday low of 1859.20 - before bouncing off the same into Friday's session.
Gold, Short-Term
For the very short-term, the smallest-tracked cycle is the 10-day wave, which is some 12 trading days along in Friday's session - and with that is looking for a quick rally of a few days. Here is a chart of our 10-day cycle:
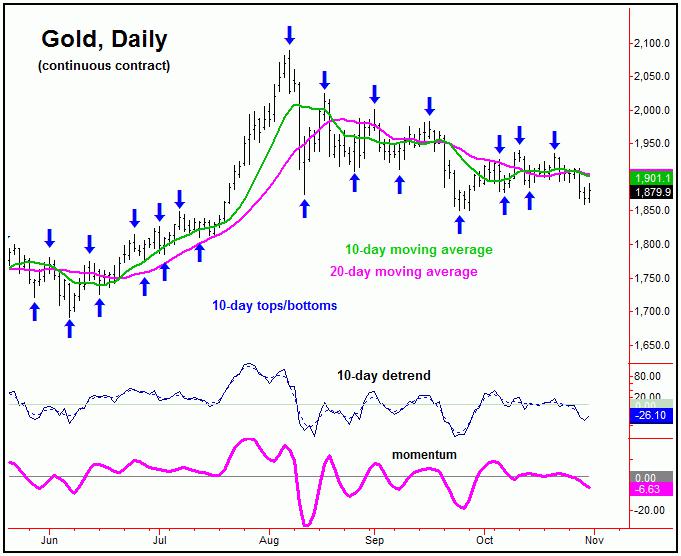
With the action seen in recent days, the downward phase of the 10-day cycle was confirmed to be back in force, and noted market report. As mentioned above, this wave is at or into bottoming territory - and with that is looking for a quick rally in the coming days, with the 10 and 20-day moving averages acting as normal price magnets.
Stepping back, the action seen into early last week also confirmed the downward phase of the larger 34-day cycle to be back in force:
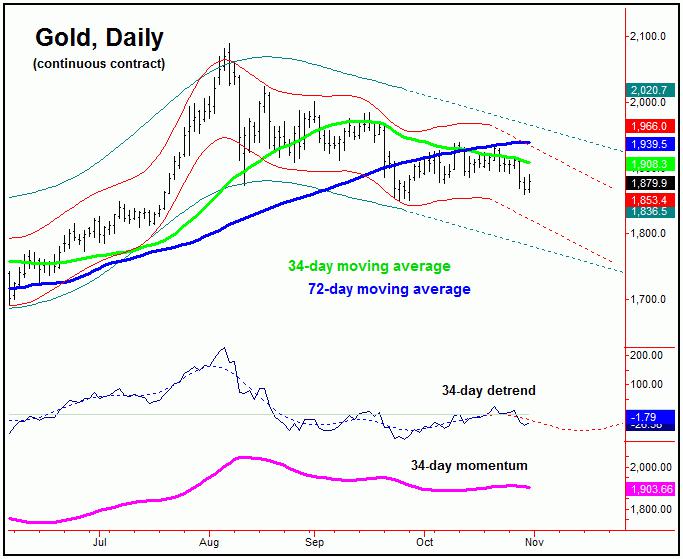
As mentioned in my article posted last week, the 34-day cycle was at or into topping range, with the action seen into last week confirming its peak to be set in place at the 1939.40 swing high, registered back in mid-October.
With the recent upward phase of this 34-day wave able to remain below higher (72-day) channel resistance, there was still the potential for lower lows before the larger swing down bottomed out. In terms of time, the next key focus is now on the mid-November region, which is where the next trough for this 34-day wave is projected. Going further, we also have a key 'reversal date' coming up soon, which is the early odds-on favorite to bottom the move.
With the above said and noted, while the near-term path is looking for a quick rally with the 10-day cycle, the probabilities will favor that rally to end up as countertrend - due to the position of the larger 34-day wave. If correct, lower lows should try and follow, before looking for our next key bottom - expected to come from the combination of the 34 and 72-day cycles.
Gold into Mid-Term Bottoming Range
For the medium-term picture, as mentioned in past articles, the next low of significance for Gold has been due to materialize with the 72-day cycle, which is shown again on the chart below:
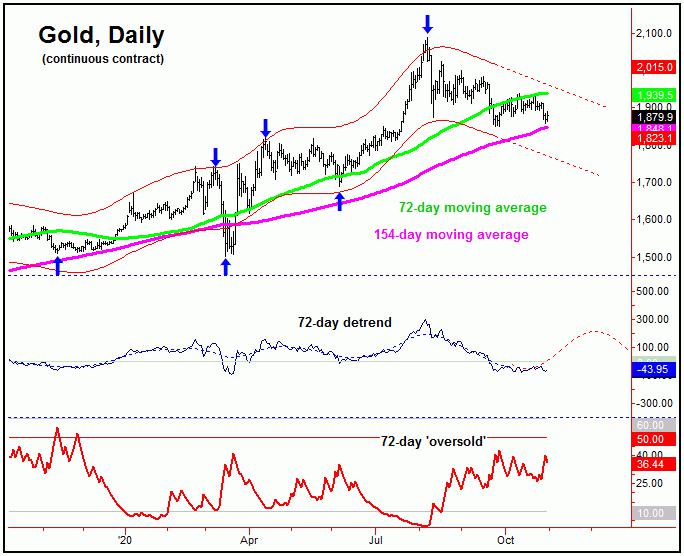
As noted in past weeks, our 72-day cycle was originally projected to trough into the late-September region, but, due to the larger plus or minus variance, there was at least the even-odds potential that a lower low was still out there for this wave.
From last weekend: "as long as the current upward phase of the 34-day cycle is able to remain below noted channel resistance, then a drop back to or below the 1851.00 swing bottom can still materialize in the coming weeks - with a focus on the mid-November timeframe for this to occur. Alternately, any firm push above higher 72-day channel resistance - if instead seen - would be our first clue that the larger swing down has bottomed."
As mentioned above, with gold able to remain below our 72-day channel resistance line, there was still the potential for a drop back to lower lows on the next swing down with the smaller 34-day wave, which we are obviously now in. With that, we will be on the close lookout for technical indications of the next key bottom for gold, as what follows should be a very strong rally on the next upward phase of these waves.
Going further with the above, we have a key price reversal figure, one which - if taken out to the upside at any point going forward - would be our best indication that the larger correction phase has in fact bottomed out, with the exact details noted in our thrice-weekly Gold Wave Trader market report.
The Bottom Line
The overall bottom line is that gold is at or into key bottoming territory, and with that we are now on the lookout for this low to be confirmed. Once complete, the overall assumption is that a push back above the August peak of 2089.20 will materialize, though with the bigger-picture outlook favoring an eventual move up to the 2200-2300 region, due to the position of our largest-tracked component, the four-year cycle. More on all as we continue to move forward.
Jim Curry
The Gold Wave Trader
http://goldwavetrader.com/
http://cyclewave.homestead.com/
More from Gold-Eagle


