Gold Price Forecast: Intraday Highs In Silver And Miners Bring Déjà Vu To Mind


 Silver and mining stocks reached intraday highs only to pull back before the end of the day. It all happened on quite big volume – another sign of a market top.
The price moves we’ve seen so far this week are particularly interesting. And I don’t mean the boring action in the GDX (which serves its own purpose as a signal), but the reversals in gold and silver.
What Can History Teach Us?
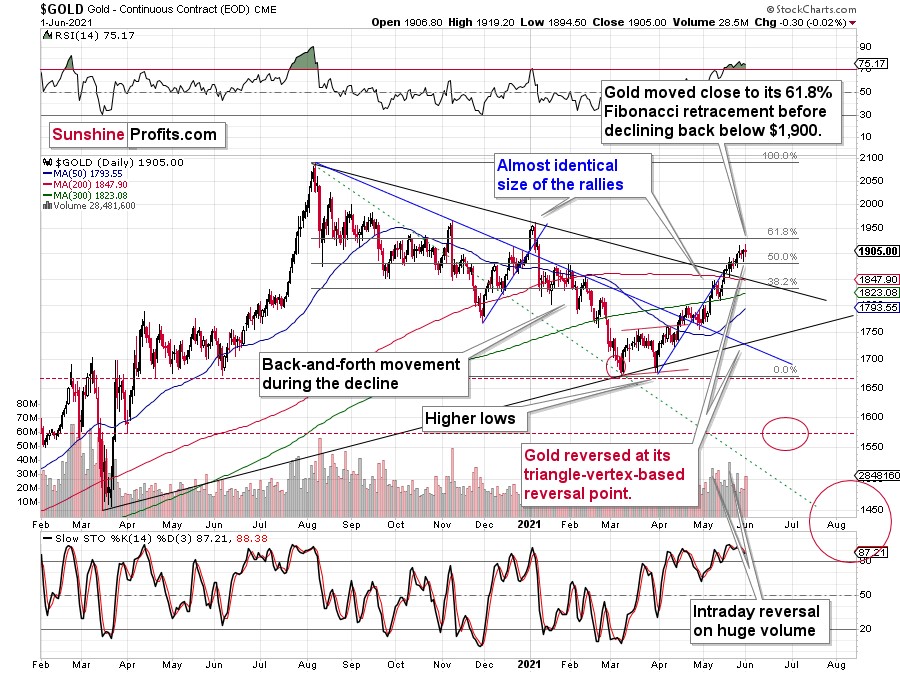
In the case of gold, the reversal took gold – temporarily – to new highs, but then gold declined once again. At the moment of writing these words (Jun. 2), gold is trading back below $1,900.
This price action took place on relatively significant volume (not as significant as the price action in silver, though), which suggests that the reversal is important. Moreover, that’s only a confirmation, as we knew that the reversal was important all along – based on the triangle-vertex-based reversal we recently saw. Combination of this with highly overbought RSI, a sell signal from the stochastic indicator, and, most importantly, the analogies to how the situation in gold developed in 2008 and 2012, provides us with an extremely bearish outlook for gold.
Many other factors are pointing to these similarities, and two of them are the size of the correction relative to the preceding decline and to the previous rally. In 2012 and 2008, gold corrected to approximately the 61.8% Fibonacci retracement level. Gold was very close to this level this year, and since the history tends to rhyme more than it tends to repeat itself to the letter, it seems that the top might already be in.
In both years, 2008 and 2012, there were three tops. Furthermore, the rallies that took gold to the second and third top were similar. In 2008, the rally preceding the third top was bigger than the rally preceding the second top. In 2012, they were more or less equal. I marked those rallies with blue lines in the above chart – the current situation is very much in between the above-mentioned situations. Also, the current rally is bigger than the one that ended in early January 2021 but not significantly so.
Since I realize that it’s most difficult to stay on track right at the top, let me remind you about two key facts:
- We have open-ended QEs – money is being pumped into the system at an unprecedented pace, even when stocks are well beyond their all-time highs. The world has been in a pandemic for over a year, and the economies were hit hard. And yet, gold – the king of safe hedges – did not manage to soar above its 2011 highs and then stay above them. Given how extremely positive the fundamental situation is, gold’s reaction is even more extremely bearish. This market is simply not ready to soar without declining significantly first. The bull market and bear markets move in stages, and the final slide was postponed multiple times, but it’s clear that gold is not ready to soar to new highs without completing this final stage – the downswing.
- Remember what happened when gold previously attempted to break above major long-term highs? It was in 2008 and gold was breaking above its 1980 high. Gold wasn’t ready to truly continue its bull market without plunging first. This downswing was truly epic, especially in the case of silver and mining stocks; and now even gold’s price patterns are like what we saw in 2008.
My previous comments on the analogies to 2008 and 2012 remain up-to-date.
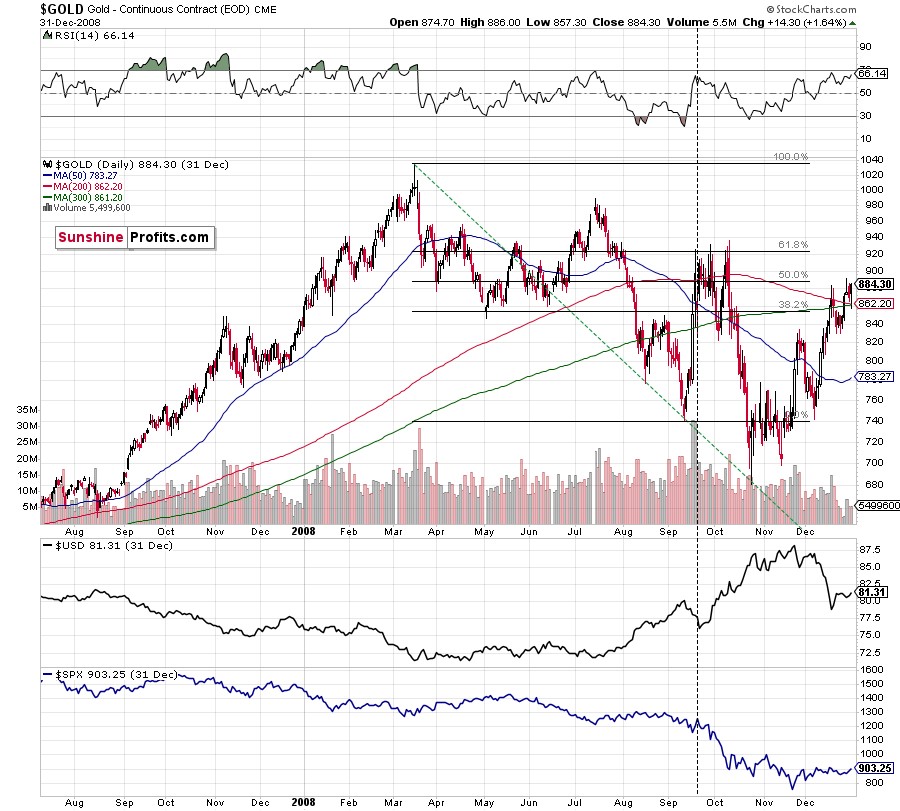
Back in 2008, gold corrected to 61.8% Fibonacci retracement, but it stopped rallying approximately when the USD Index started to rally, and the general stock market accelerated its decline.
Taking into consideration that the general stock market has probably just topped, and the USD Index is about to rally, then gold is likely to slide for the final time in the following weeks/months. Both above-mentioned markets support this bearish scenario and so do the self-similar patterns in terms of gold price itself.
What would change my mind with regard to gold itself? Perhaps if it broke above its January 2021 highs and confirmed this breakout. This would be an important technical indication on its own, but it would also be something very different from what happened in 2008 and 2012. If that happened along with strength in mining stocks, it would be very bullish. Still, if the above happened, and miners didn’t react at all or they declined, it would not be bullish despite the gains in the gold price itself.
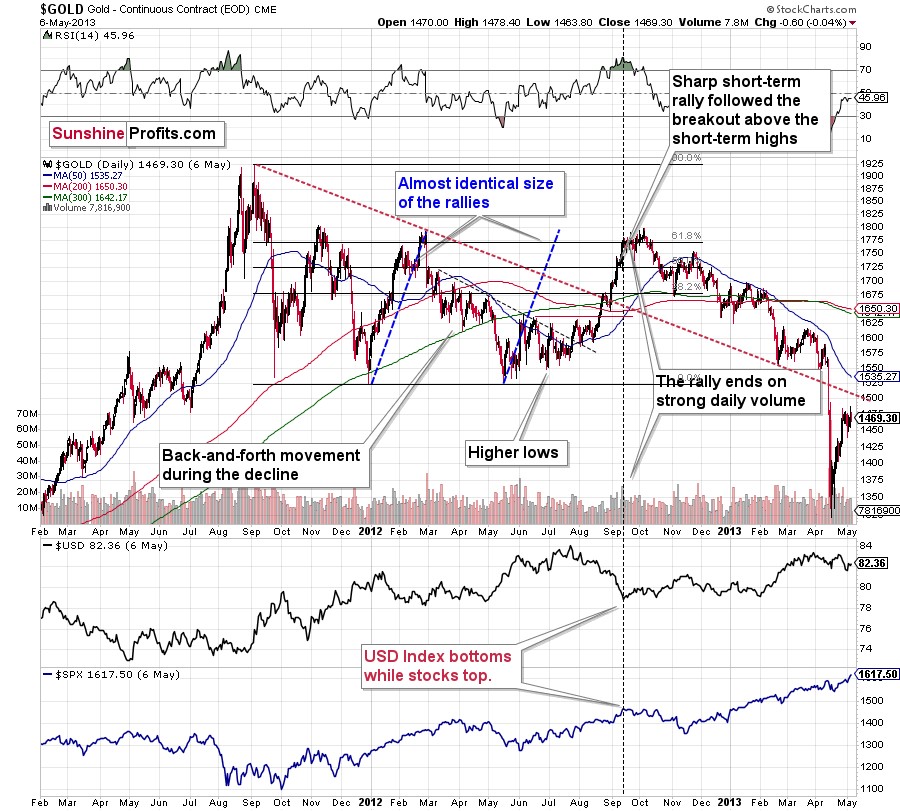
The March 2021 low formed well below the previous low, but as far as other things are concerned, the current situation is similar to what happened in 2012.
The relatively broad bottom with higher lows is what preceded both final short-term rallies – the current one, and the 2012 one. Their shape as well as the shape of the decline that preceded these broad bottoms is very similar. In both cases, the preceding decline had some back-and-forth trading in its middle, and the final rally picked up pace after breaking above the initial short-term high.
Interestingly, the 2012 rally ended on huge volume, which is exactly what we saw also on May 19 this year. Consequently, forecasting much higher gold prices here doesn’t seem to be justified based on the historical analogies.
The thing I would like to emphasize here is that gold didn’t form the final top at the huge-volume reversal on Sep. 13, 2012. It moved back and forth for a while and moved a bit above that high-volume top, and only then the final top took place (in early October 2012).
The same happened in September and in October 2008. Gold reversed on huge volume in mid-September, and it was approximately the end of the rally. The final top, however, formed after some back-and-forth trading and a move slightly above the previous high.
Consequently, the fact that gold moved a bit above its own high-volume reversal (May 19, 2021) is not an invalidation of the analogy, but rather its continuation.
There’s one more thing I would like to add, and it’s that back in 2012, gold corrected to approximately the 61.8% Fibonacci retracement level – furthermore, the same happened in 2008 as you can see in the below chart. Consequently, the fact that gold moved above its 50% Fibonacci retracement doesn’t break the analogy either. And even if gold moves to $1,940 or so, it will not break it. It’s not likely that it is going to move that high, as in both cases –in 2008 and 2012 – gold moved only somewhat above its high-volume reversal before forming the final top. So, as this year’s huge-volume reversal took place close to the 50% retracement and not the 61.8% retracement, it seems that we’ll likely see a temporary move above it, which will create the final top. And that’s exactly what we see happening so far this week.
The lower part of the above chart shows how the USD Index and the general stock market performed when gold ended its late-2012 rally and was starting its epic decline. In short, that was when the USD Index bottomed, and when the general stock market topped.
Also, please note that while it might seem bullish that gold managed to rally above its declining black resistance line recently (the one based on the 2020 top and the 2021 top), please note that the same happened in 2012 – I marked the analogous line with red. The breakout didn’t prevent gold from sliding. When the price reached the line, we saw a short-term bounce, but nothing more than that – the gold price fell through it in the following weeks.
Silver and Mining Stocks
Having said that, let’s check what silver and mining stocks did.
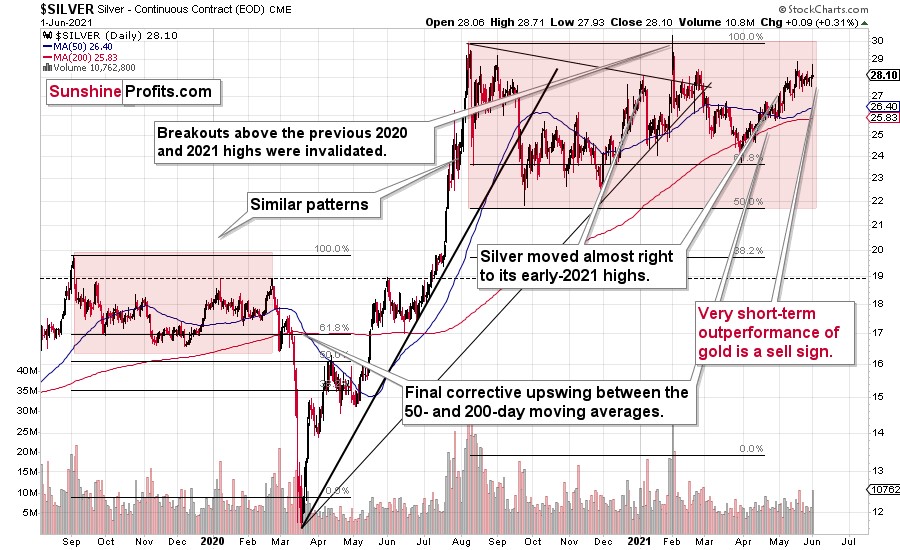
Silver has barely moved in terms of the closing prices. However, it has rallied significantly on an intraday basis – more than gold did; and the volume on which it happened was more notable than the one in gold.
In other words, silver did exactly what it tends to do at market tops. And we can say the same thing about the mining stocks.
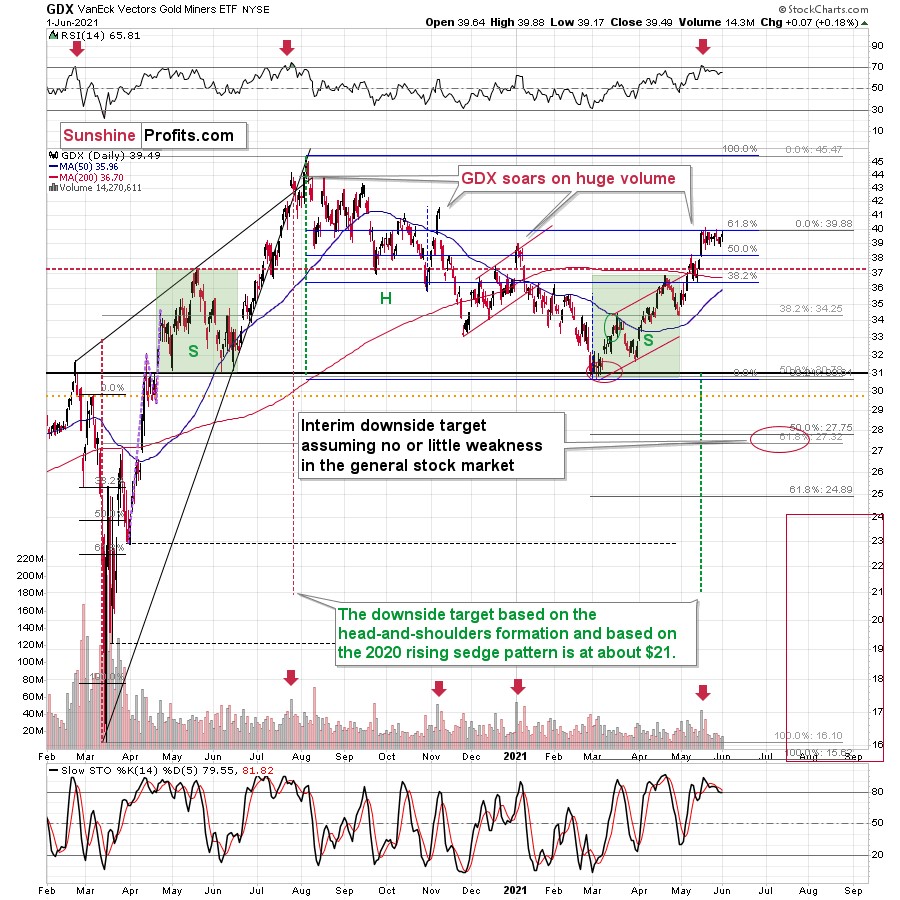
Gold miners moved higher, but the move took place on relatively low volume, so it was nothing to write home about. Miners refused to follow gold higher, but they seem likely to follow it lower as soon as they get a good trigger for it (a decline in gold). Actually, gold stocks can decline even without a decline in gold, at least initially – that’s how the 2012-2013 decline started, after all.
The clearest of the recent signs coming from mining stocks is the fact that gold rallied by almost $30 last week, and the HUI Index (flagship proxy for gold stocks) went down slightly. This is extremely bearish.
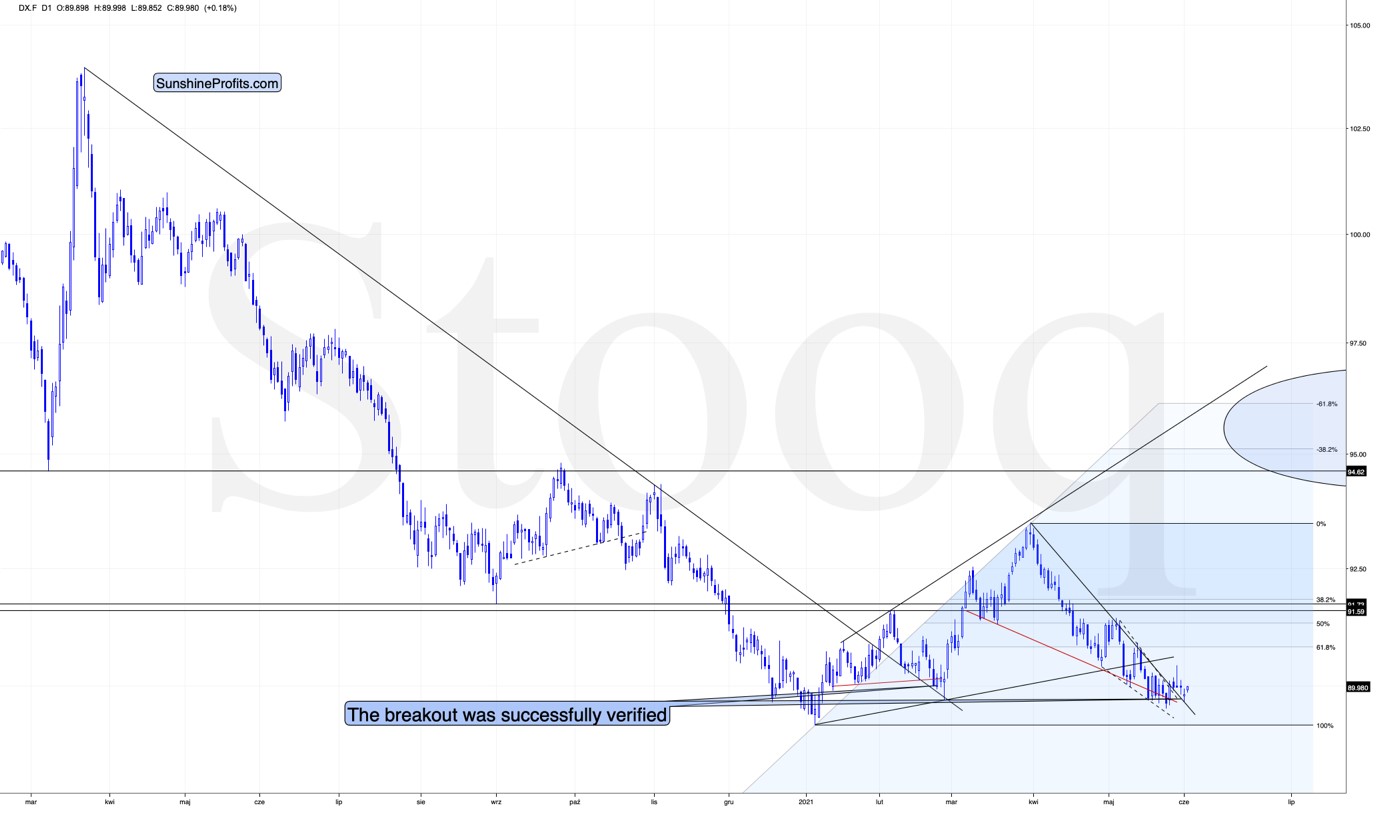
Meanwhile, the USD Index has just confirmed its short-term breakout, suggesting that the analogy to 2016 and the similarity to how it bottomed (triple bottom with lower lows) in mid-2020 remains intact. And so does the bullish outlook for the universally-hated-and-massively-shorted U.S. currency.
Summary
To summarize, even though it doesn’t seem to be the case based on this month’s price change in gold, it seems that the yellow metal’s days are numbered. This is based not only on the excessively oversold USD Index and its 2016 self-similar pattern but also on what’s happening in the stock market, silver’s recent outperformance and price levels reached throughout the precious metals sector. From the long-term point of view, the current situation seems similar to what we saw in the second half of 2012, and in 2008.
Taking that into consideration, gold’s corrective action is pretty much over (or just about to be), and the weeks that follow are not likely to be pleasant times for anyone who jumps on the bullish bandwagon just because prices moved higher in the previous days or months or based on some forum posts. Tread carefully.
What’s profitable is rarely the thing that feels good initially. As silver often moves in close relation to the yellow metal, forecasting gold’s longer term rally without a bigger decline first is thus likely to be misleading. Silver is likely to slide as well. The times when gold is continuously trading well above the 2011 highs will come, but they are unlikely to be seen without being preceded by a sharp drop first.
Thank you for reading our free analysis today. Please note that it is just a small fraction of today’s all-encompassing Gold & Silver Trading Alert. The latter includes multiple premium details such as the outline of our trading strategy as gold moves lower.
If you’d like to read those premium details, we have good news for you. As soon as you sign up for our free gold newsletter, you’ll get a free 7-day no-obligation trial access to our premium Gold & Silver Trading Alerts. It’s really free – sign up today.
Przemyslaw Radomski, CFA
Founder, Editor-in-chief
Sunshine Profits - Effective Investments through Diligence and Care
* * * * *
All essays, research and information found above represent analyses and opinions of Przemyslaw Radomski, CFA and Sunshine Profits' associates only. As such, it may prove wrong and be subject to change without notice. Opinions and analyses are based on data available to authors of respective essays at the time of writing. Although the information provided above is based on careful research and sources that are deemed to be accurate, Przemyslaw Radomski, CFA and his associates do not guarantee the accuracy or thoroughness of the data or information reported. The opinions published above are neither an offer nor a recommendation to purchase or sell any securities. Mr. Radomski is not a Registered Securities Advisor. By reading Przemyslaw Radomski's, CFA reports you fully agree that he will not be held responsible or liable for any decisions you make regarding any information provided in these reports. Investing, trading and speculation in any financial markets may involve high risk of loss. Przemyslaw Radomski, CFA, Sunshine Profits' employees and affiliates as well as members of their families may have a short or long position in any securities, including those mentioned in any of the reports or essays, and may make additional purchases and/or sales of those securities without notice.
********
 Przemyslaw Radomski, CFA, is the founder, owner and the main editor of SunshineProfits.com. You can reach Przemyslaw at: http://www.sunshineprofits.com/help/contact-us/.
More from Gold-Eagle


