Gold Price Forecast: Keep The Focus On The Larger Trend


Last week's trading saw gold forming an early-week high, with its peak registered with Monday's tag of the 1939.40 figure. From there, a sharp decline was seen into Wednesday's session, with the metal dropping all the way down to a low of 1885.00 - before bouncing off the same into Friday.
Gold's Stepped-Back View
For the mid-term picture, we know that the next low of significance for gold has been due to materialize with the 72-day wave, which is shown again on the chart below:
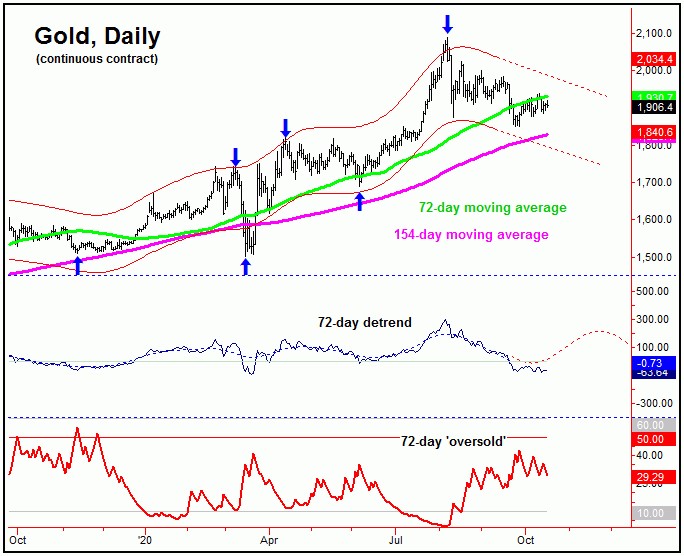
In terms of time, this 72-day cycle was projected to trough into the late-September region, but does have a good plus or minus variance in either direction. Though there is now the potential that the expected trough for this cycle is already set in place at the 1851.00 figure, it is still too early to actually confirm.
With the above said and noted, until a lower level materializes, gold (December, 2020 contract) would currently need to see a reversal back above the 1985.10 figure to confirm our 72-day bottom in place. In other words, while there is the chance that this particular wave troughed at the 1851.00 figure back in late-September, there is still about an even-shot that a lower low is still out there for the same.
The good news is that our upside ‘reversal point’ of 1985.10 could drop sharply in the days ahead, with the latest numbers always reported in the latest edition of our Gold Wave Trader market report.
The Longer-Term Picture
Stepping back then, any reversal above the 1985.10 figure (December, 2020 contract) - if seen at any point going forward - would infer our 72-day cycle to have bottomed, and thus the larger swing down. From there, the probabilities would favor a push back above the 2089.20 swing top in the days/weeks to follow, though with the more ideal (and eventual) magnet being the 2212.00 - 2340.56 region, which is our open target from the larger four-year wave, shown below:
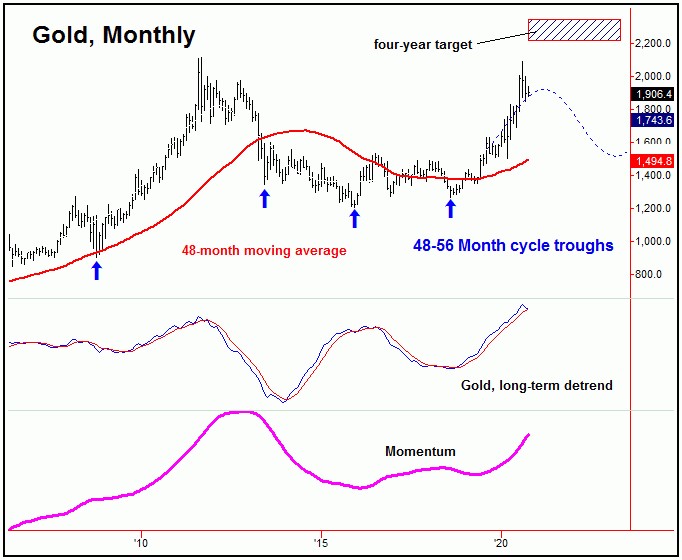
With higher targets still out there for the four-year cycle, traders are advised to keep the focus on the bigger-picture, with the aforementioned target zone in mind. In other words, with higher highs eventually favored, traders should be looking for technical reasons to buy into shorter-term correction phases - which we have obviously been in the process of since the early-August peak.
For the longer-term view, our ideal peak for the four-year wave will come later next year, following a correction in-between, coming from the slightly-smaller 310-day component, which is shown again on the chart below:
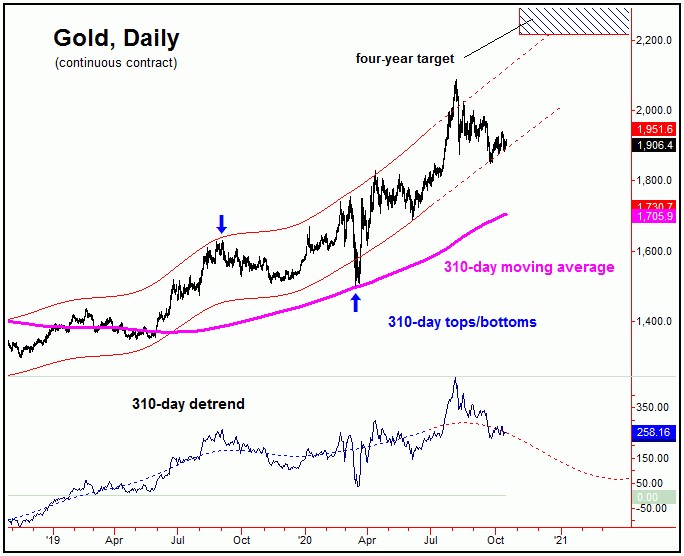
As mentioned in prior articles, the next upward phase of the smaller 72-day cycle should be the final rally phase into the next mid-term peak - which should come from the larger 310-day component. In terms of price, the ideal path is looking for an eventual push up to the open four-year target zone to 2212.00 - 2340.56 for gold, with the upper-end of this range acting as a major resistance level.
Gold Seasonality
Adding to the notes above, it should be mentioned that gold is currently in its bullish seasonal period, which lasts from September through February, where the metal has recorded an average gain of around 15%. Interestingly, a gain of this percentage - if seen in the current seasonal period - would favor gold to make it back to new all-time highs in the coming months, then to be on the lookout for technical indications of the next mid-term peak - coming from our aforementioned 310-day wave.
The Bottom Line
The overall bottom line remains as it has in past weeks. That is, the correction phase off the August peak has either bottomed with the late-September tag of 1851.00 - or else has a marginally lower low still out there. Regardless of which path is seen, the odds do favor the correction phase to end up as a countertrend affair, giving way to new all-time highs into the late-2020 to early-2021 timeframe. From there, a larger-degree decline is expected to unfold into next Spring, though, until proven otherwise, is also favored to end up as countertrend - giving way to higher highs again on the next swing up.
Jim Curry
The Gold Wave Trader
http://goldwavetrader.com/
http://cyclewave.homestead.com/
More from Gold-Eagle


