Gold Price Forecast: Taking A Beating But Still On Track For New Highs


Gold took a pounding in the past weeks as even safe havens sold off in a market with record high volatility across most asset classes. Treasuries sold off sharply from their peak, and the full metals complex from gold, silver, palladium, and platinum fell hard.
However, it’s important for investors to remember that gold is still positive over the past year. It has had a nice run despite recent pressure. There are a variety of ways to save and invest in the precious metals space, as my guide on the topic covers.
In fact, the Gold/SPX ratio recently broke out above its 50-month moving average. In other words, starting in September 2018 when the ratio bottomed, gold began a trend of outperformance over the S&P 500, and the trend recently broke out:
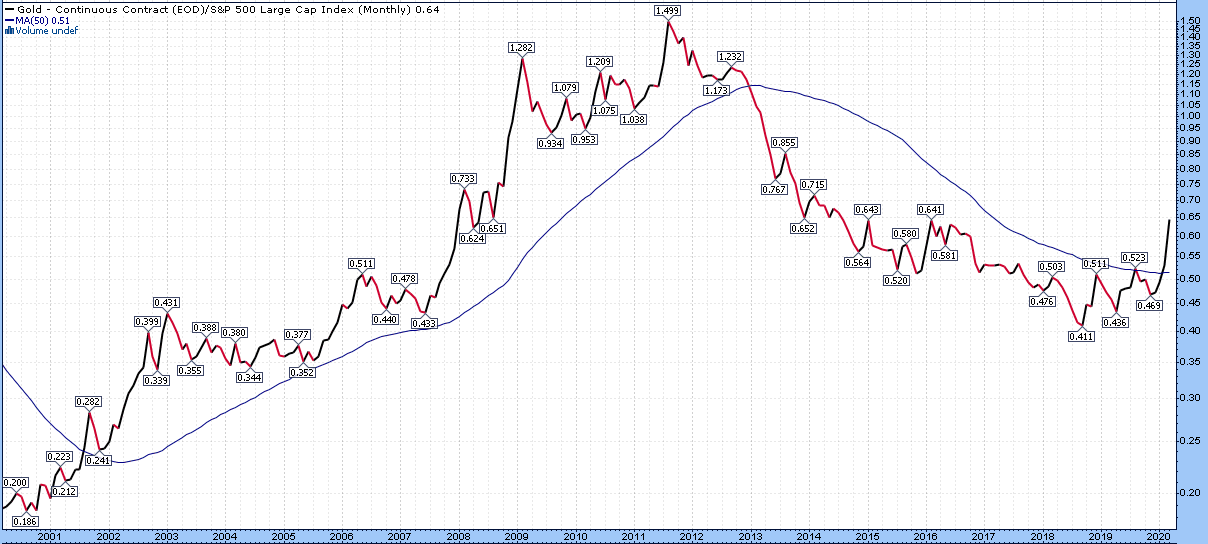
Chart Source: StockCharts.com
The last time this ratio broke out over the 50-month moving average was in 2001, when gold went on to have an epic decade-long rally to all-time highs. On the other hand, the last time gold broke below the 50-month moving average was in 2012, when it went on to have an 8+ year bear market.
The ratio of gold to broad money supply per capita remains in a reasonable range. Over the long run, gold tends to increase in price at about the same pace as broad money supply per capita, which does make intuitive sense.
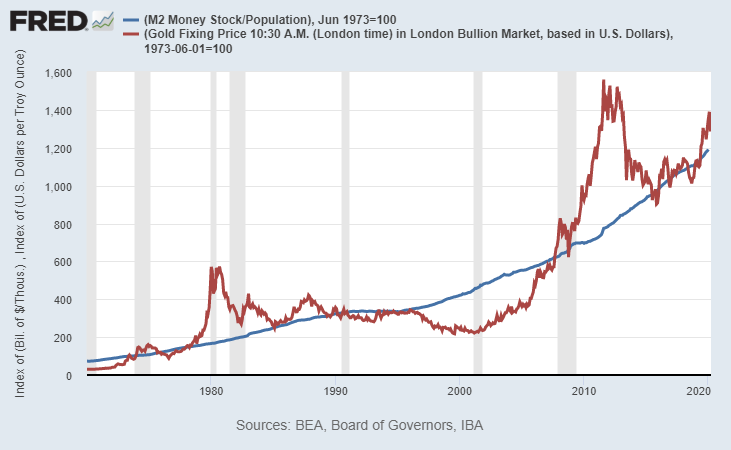
Chart Source: St. Louis Fed
Gold historically tended to break out above the money supply growth trend during periods of low real interest rates, and tended to fall well below the trend during rarer periods of high real interest rates.
When real rates are high, investors have an incentive to store money in cash or bonds, and get paid an interest rate that is above the inflation rate. On the other hand, when real rates are low or negative, there’s little incentive to hold cash and bonds, and gold becomes a more attractive option. As such, the year-over-year percent change in the gold price has a strong history of inverse correlation to real interest rates:
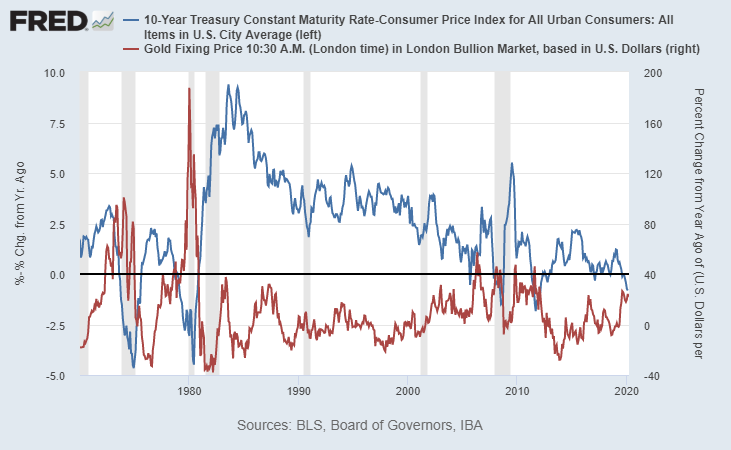
Chart Source: St. Louis Fed
What makes the sell-off in precious metals even more interesting, was that at the same time it is happening, precious metal physical dealers are experiencing record physical metal buying. Large dealers like APMEX, JM Bullion, and many others put notices on their websites saying that due to extreme order volume, there would be long shipping delays, higher minimum orders, and so forth. As the weeks went by, many of them went out of stock, and drastically raised the premiums on whatever stock they had left.
The U.S. mint sent out a note to its authorized dealers saying that they were out of stock on American silver eagle coins due to excessive sales volume:
“This is to inform you that we have temporarily sold out of American Eagle silver eagle bullions. Our rate of sale in just the first part of March exceeds 300% of what was sold last month. West Point is working diligently to produce additional inventory and once additional inventory is produced, we will again begin allocations.” -US Mint
This divergence between the physical market and the paper market can only last for a finite time, and will resolve in one direction or the other. Precious metals prices in the larger and leveraged paper (futures) market are under selling pressure during this time of deflationary shocks, liquidity shortages, and margin calls while physical demand surges, and I think precious metals will be a good holding for the patient during the fiscal and monetary response to this deflationary/illiquidity event.
Monetary Base Vertical Move
From 2008 to 2014, the Federal Reserve performed three rounds of quantitative easing, meaning they expanded the monetary base to buy Treasuries and other assets. Then from 2014 to 2019, they were able to stop doing that, and even shrink the monetary base slightly.
Starting in September 2019, after five years of a flat-to-down monetary base, in response to a sudden spike in overnight lending (“repo”) rates, the Federal Reserve began rapidly expanding the monetary base to buy short-term Treasuries and perform short-term repo loans.
Then from January through February, there was a brief 2-month window where they were able to stop again, although it was clear at the time that it wouldn’t last long.
In the past three weeks, the Fed’s balance sheet has grown extremely rapidly, at over $500 billion, including $356 billion in the past week alone:
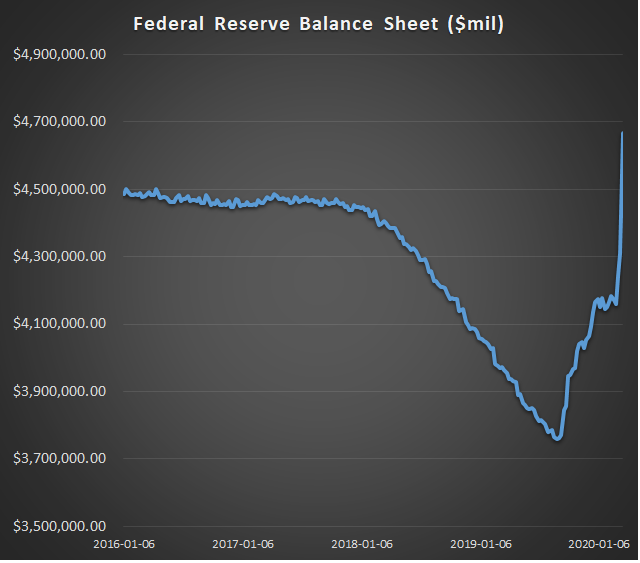
Data Source: U.S. Federal Reserve
This trend will likely persist for some time. During these past three weeks of extreme volatility, liquidity dried up in the interbank lending system and in the global dollar market, and even in the Treasury market. The Fed began dramatically ramping up its daily QE amount to upwards of $100 billion per day in recent days, along with over a dozen crisis operations to backstop money markets, municipal bonds, corporate paper, and foreign dollar markets.
The next thing to watch is dollar strength. A stronger dollar can briefly push down the price of gold in dollar terms. The dollar initially fell vs the euro and yen during the broad market crash, but when interbank liquidity started to dry up, the dollar began an epic spike back up:
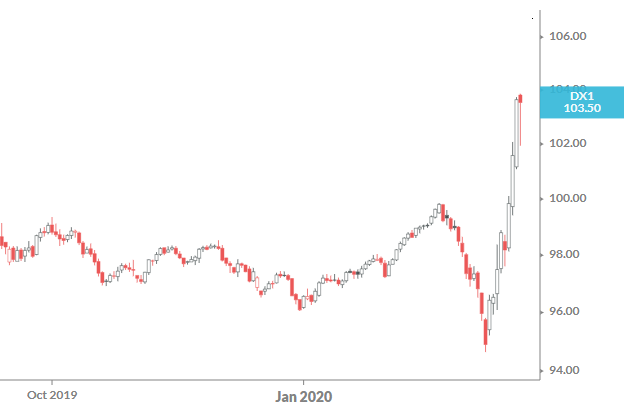
Chart Source: Koyfin
There is a global dollar liquidity shortage on one hand that puts a lot of upward pressure on the dollar. Counteracting that is the Fed’s response to provide liquidity as needed. This is an unusually volatile period for currency pairs, and we’ll see in the next few weeks how the Fed’s actions influence the dollar.
In 2000 and 2008, gold sold off by 15% and 30% respectively at the leading edge of each recession, but then turned around and rebounded to new highs faster than the S&P 500 when various monetary and fiscal measures were taken to support the economy.
It’s important to manage expectations, but so far, gold is reacting similarly to how it performed in 2000 and 2008. It typically sells off during liquidity shortages and deflationary crunches, but should respond positively to all of the fiscal and monetary responses that the United States and other countries will throw at this virus-induced global slowdown. The coming few years should be a prime environment for precious metals.
Lyn Alden


