Gold Price Forecast: Twice Per Century Signal Says Depression Ahead


A signal has just appeared in the global financial markets which has only been witnessed one other time in recorded history – and it foretells of immense trouble for the world economy ahead.
What is the signal?
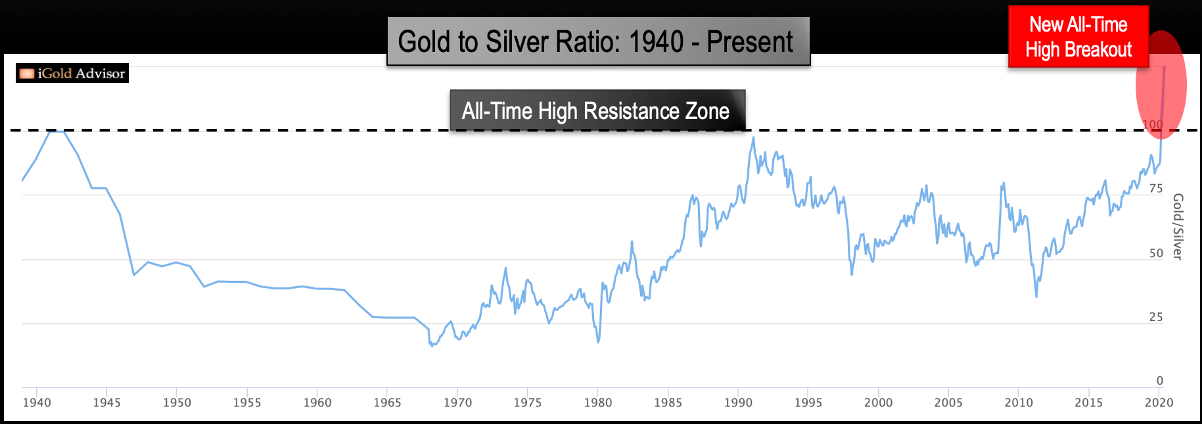
The gold to silver ratio – it has just shattered its former all-time highs.
Specifically, the ratio surged up to 125 ounces of silver required to purchase one ounce of gold during the midst of the Coronavirus panic in March. It has since come back to near 100 as this article is going to press, but the ratio remains above the previous all-time high resistance zone shown in black. Below we show a quarterly close of the gold to silver ratio dating back to 1940:
When is the only other time in history that the gold to silver ratio has broken out to a new all-time high?
At the start of the Great Depression, in 1930.
Party Like It’s 1929
Let us rewind back one century in our history books.
The 1920’s, so-called the Roaring 20’s, were a time of great technological innovation around the world. The widespread adoption of electricity in urban areas, commercial radio broadcasting, and the liquid fueled rocket are just some of the advances that occurred during the 1920’s and which have had lasting impacts on our lives.
Of course, throughout the decade, the US stock market rose to reflect these advances in productivity.
Yet by the end of the 1920’s, the stock market, which had previously been a gauge of increasing industrial productivity, morphed into a speculative mania. Stocks were bought with little regard to the fundamental health of the underlying companies, and traders sought quick profits in a market which seemingly could not fall. Buying beget more buying, and greed ruled the psychology of market participants by late 1929:
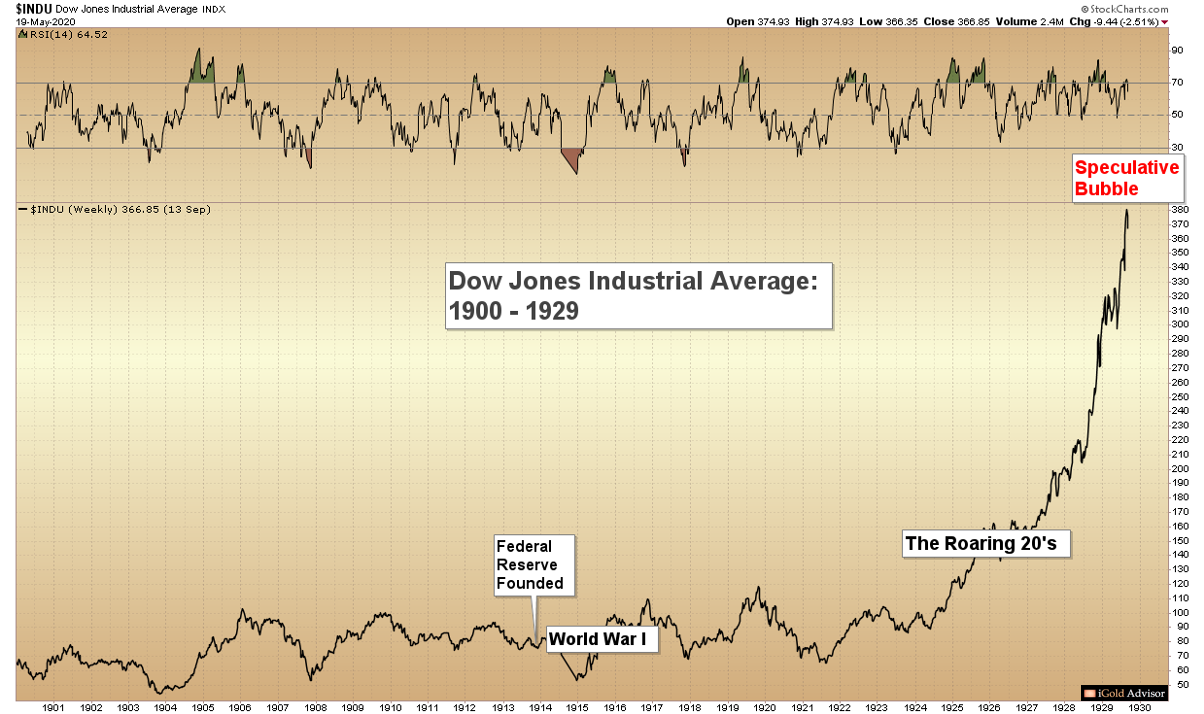
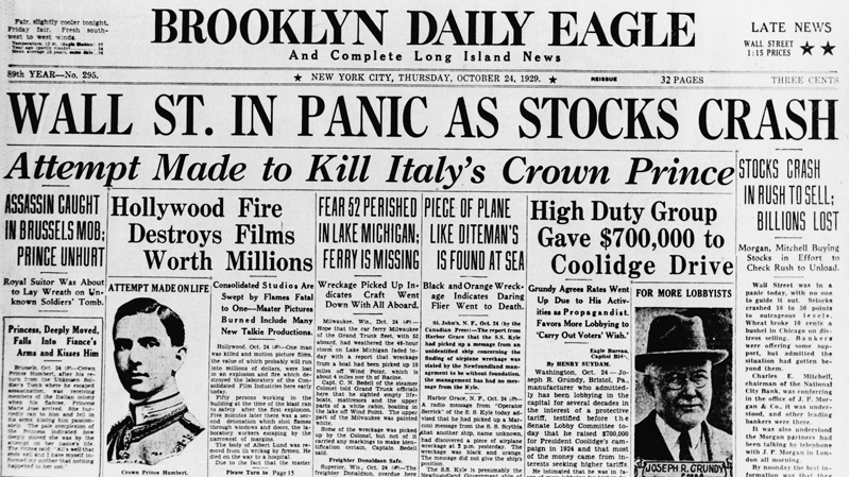
The Crash of 1929
Of course, nothing moves higher in a straight line forever. After the very last of the speculators had been sucked into the bubble, in October 1929 the stock market crashed, falling nearly 48% in the first two months alone:
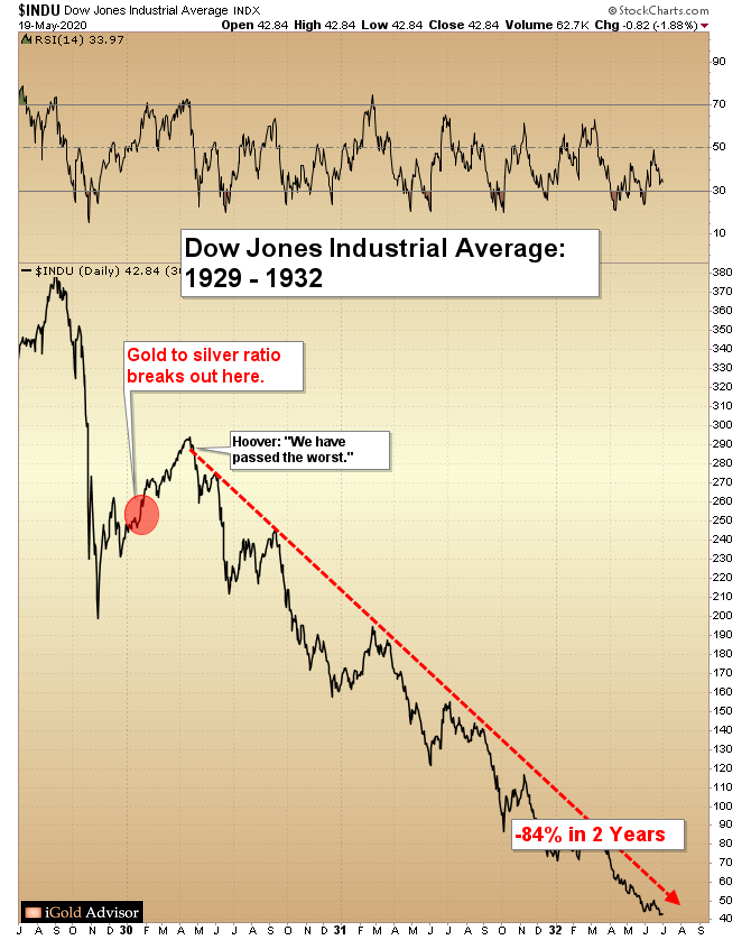
1930: Was The Worst Over?
Despite the panic in late 1929, by April of 1930 the stock market had recovered over 50% of its crash, and indeed many around the world believed that the worst was over. President Herbert Hoover himself is quoted as saying in May, 1930:
"While the crash only took place six months ago, I am convinced we have now passed the worst and with continued unity of effort we shall rapidly recover. There is one certainty... that is prosperity."
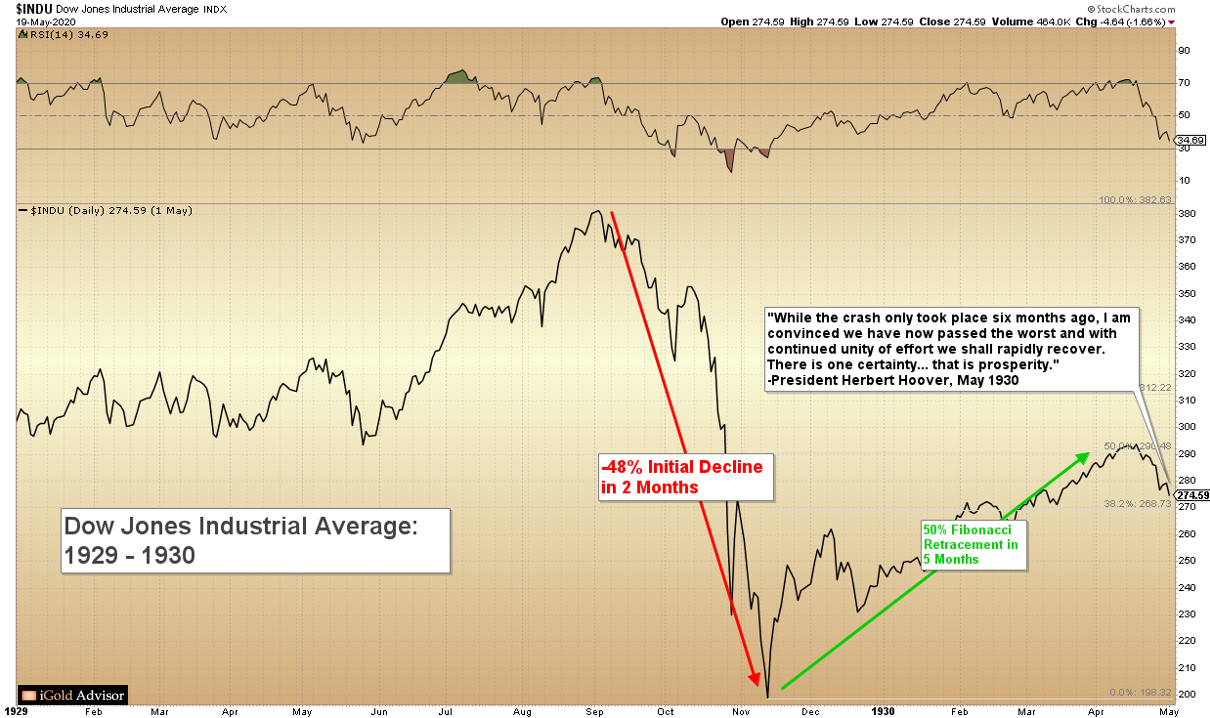
Let us fast forward the Dow Jones Industrial Average by another two years. Was the worst over as President Hoover predicted?
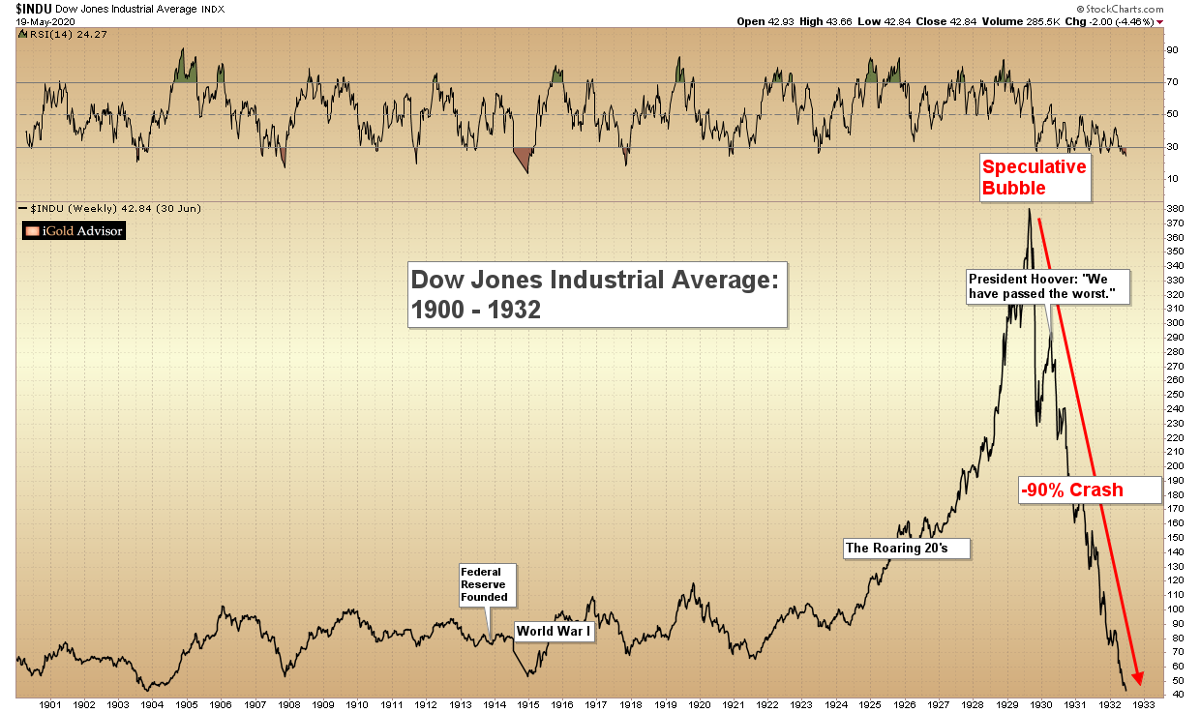
Clearly, Hoover and others who hoped that the worst would be in the past by 1930 were painfully wrong.
Was There a Warning?
Was there a warning signal in early 1930 that perhaps President Hoover was incorrect, and that monumental further losses were in store for the markets?
After all, those who sold into the 1930 recovery would have avoided an 84% further collapse in stock prices over the next two years.
In fact, there was such a warning signal, if one paid attention: the gold to silver ratio, or the number of ounces of silver required to purchase one ounce of gold, was breaking out to a new all-time high.
Gold to Silver Ratio Up to 1929
Between 1895 and 1929, the gold to silver ratio oscillated in a range between 17 to 40 ounces of silver required to purchase one ounce of gold.
Of course, at the time the US dollar was tied to gold, at the exchange rate of just over $20 per ounce.
Thus, changes in the gold to silver ratio primarily reflected changes in the price of silver. When silver rose in price due to inflation, the ratio compressed lower. Conversely, when silver fell in price due to deflationary conditions, the ratio rose.
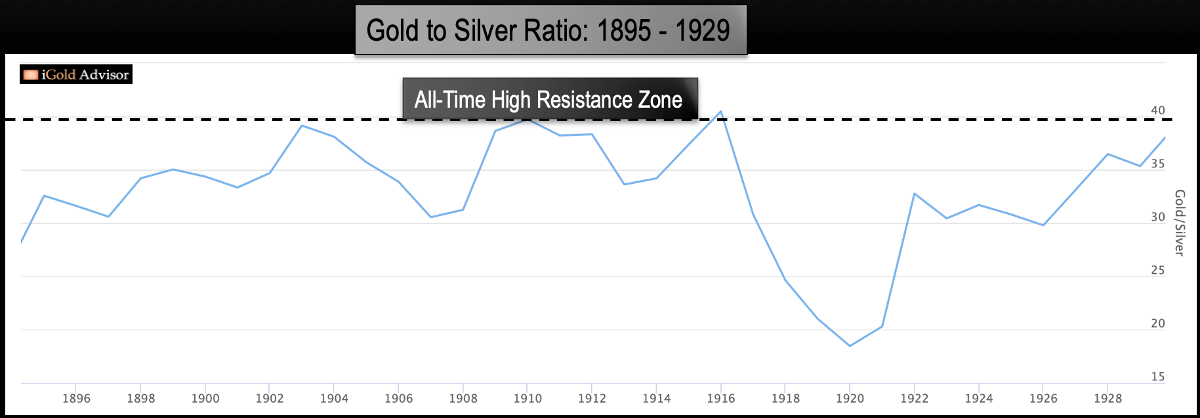
It is important to note that up until this point in time, the ratio had never previously risen above 40 in the history of human civilization. Up until 1929, 40 was a level which always meant that deflationary forces had run their course, and that inflation was set to return.
The only problem? In 1930 something unprecedented happened: the ratio broke above 40 for the first time ever:
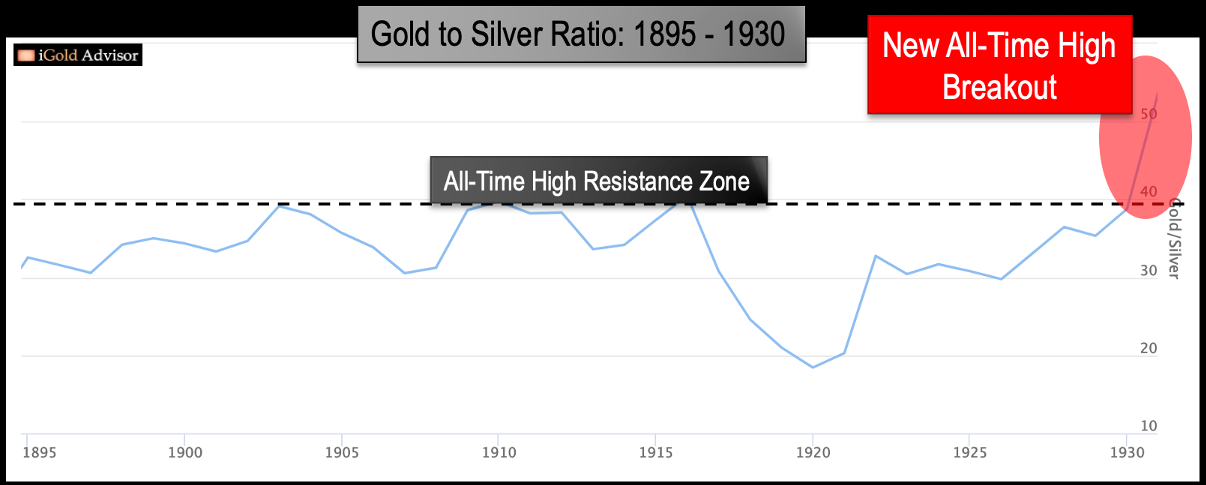
Meaning of the Ratio Breakout
The gold to silver ratio is like a thermometer for the world’s financial health.
When the ratio rises, it signifies that silver – which has a dual monetary and industrial role – is losing value relative to gold – which is primarily a monetary precious metal.
In other words, when the ratio rises we are seeing that industrial assets are suffering relative to monetary assets.
And when industrial metals suffer, you had better believe that industry itself is suffering.
The Result of Industrial Slowdown
When the wheels of industry stop turning, price deflation is often the result, as the value of goods and services fall.
Yet we must ask: fall relative to what?
Relative to money, of course!
Remembering that in 1930 gold served as money by backing the dollar, what was witnessed in early 1930 by the gold to silver ratio breaking out was a warning that the most severe deflation in the history of the United States was about to occur.
In other words: the Great Depression was just beginning.
Was the signal a correct warning? You be the judge;
Back to the Present
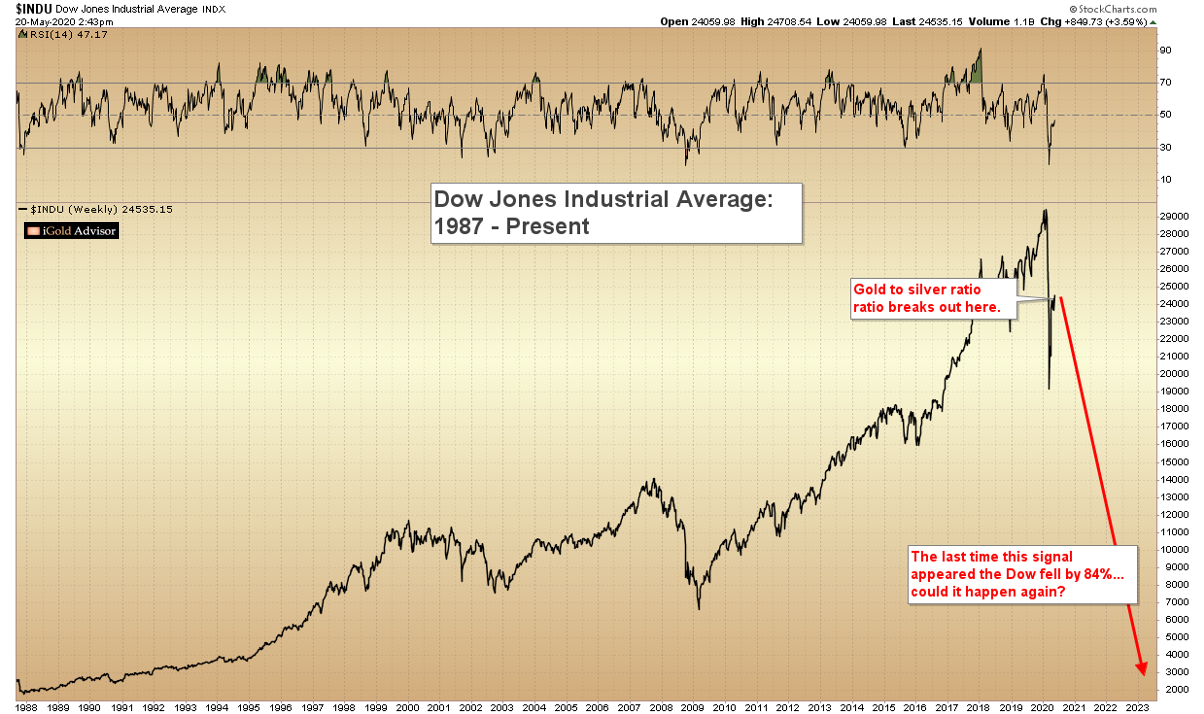
The same signal which last appeared in early 1930 at the start of the Great Depression has just appeared again – the gold to silver ratio has, in March 2020, broken out to a new all-time high. To review the chart from the first page again:

The only difference this signal and the one in 1930?
Presently the ratio is breaking out above an 80-year consolidation (1940 – 2020), whereas in 1930 it only broke out above a 35-year consolidation (1895 – 1930).
In other words: this time the signal is more ominous than in 1930.
What is the signal forecasting?
Severe deflation ahead – although we cannot be certain on why it will manifest. It could be that the second wave of the Coronavirus to come this fall is going to be much worse than the first wave. It could be that the lockdowns of business across the world will be even more severe. It could be something we cannot even fathom at this point.
Remember, not even the President of the United States was able to correctly foresee that the greatest economic depression in the history of the country was about to start in 1930.
However, ultimately the goal of our work is not to spend hours debating the causes of economic depressions – the goal is to protect ourselves and to profit during these times.
Profiting During the Great Depression
What rose in value amidst the 90% decline in the Dow Jones Industrial Average which kicked off the Great Depression?
Gold.
In 1933, President Roosevelt outlawed the private ownership of gold. He then revalued it 75% higher, in effect devaluing the US dollar by an equal amount.
Instead of costing just over $20 for an ounce of gold, Roosevelt declared it would now be worth $35.
That is a handsome 75% return for those individuals who refused to turn in their gold, in violation of the law. (According to most historians, few were ever prosecuted.)
Importantly, that 75% gain was certainly much better than the 50% loss in value in real estate during the Great Depression, or the even more catastrophic 90% loss in stocks during the period.
The owner of gold could have scooped up an impressive array of assets on the cheap following the 1929 – 1932 crash.
Do Not Underestimate This Signal
The same signal which last appeared in early 1930 has just appeared for a second time in the history of financial record keeping.
The gold to silver ratio has shattered previous all-time highs, exactly as it did during the first wave of the Great Depression.
Once again as in the Great Depression, most are convinced that the worst is behind us.
Yet the gold to silver ratio is loudly signaling that something is wrong with the quick recovery attempt seen in global markets over the last two months.
While the world is a vastly different place than it was back in 1930, ratio signals have a way of cutting through the noise of such narratives. Ratios are unemotional data points which simply indicate whether or not industry is suffering or thriving.
And in March 2020, this signal spoke loud and clear that industry is on financial life support.
Could stocks fall 84% again from this point, as they did in early 1930?
Perhaps.
Let us remember, however, that the US dollar is no longer backed by gold, and so the government need not officially revalue gold as it did in 1933.
This time, the free market may do that on its own.
Takeaway
Prudent investors should not ignore a twice per century signal which has not appeared since the start of the Great Depression.
Prudent investors should own gold.

Christopher Aaron began his career as an intelligence analyst for the CIA and Department of Defense. He served two tours to Afghanistan and Iraq between 2006 - 2009, conducting pattern-of-life mapping for military leaders.
Mapping shares similarities with technical analysis of the financial markets because both involve the interpretation of repeating patterns found in human nature. He is the founder of iGold Advisor, providing independent research and analytics on all aspects of the precious metals markets.
He speaks regularly on the cyclical patterns found within the financial markets and on international policy. He has been featured in the New York Times and NPR news amongst other financial publications.


