Gold Price Forecast: Valid Support Leads to $2,471 Target


Gold has just witnessed a successful support test of a critical level which keeps the technical model bullish until proven otherwise. In this article, we will detail the technical test just witnessed, and what the expected outcome will be for gold as long as support continues to hold.
First a look at the support test which has just occurred within the last two weeks.
Gold Support Holds
Note the primary rising support for gold (blue line), which began exactly four years ago, at $1,180 per ounce in August 2018. This rising trend of buying pressure was tested on no less than four occasions through mid-2019, after which gold began to rise more aggressively toward its 2020 peak of $2,074 per ounce.
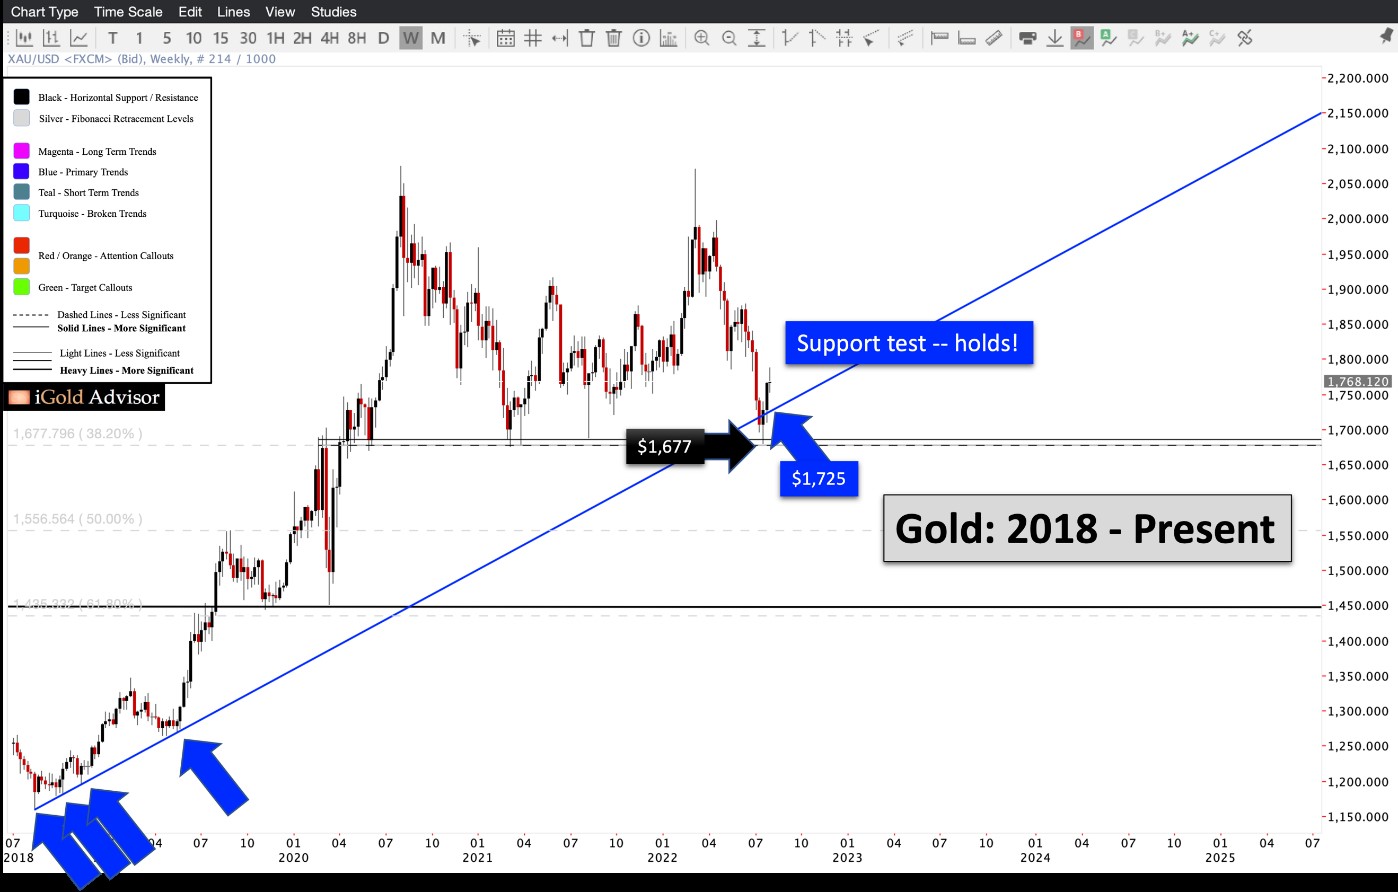
Markets have a way of coming back to test long-term trends, and this is exactly what gold has done over the past two weeks. Certainly expectations for a peak in the Federal Reserve’s interest rate hike cycle are already factoring into gold, as the market attempts to be forward-looking by approximately 6 – 12 months. Regardless of the reasons why, gold has bounced at a confluence of support which dates back to 2018, and thus keeps our bullish model alive.
So what is next for gold?
Gold Price Forecast
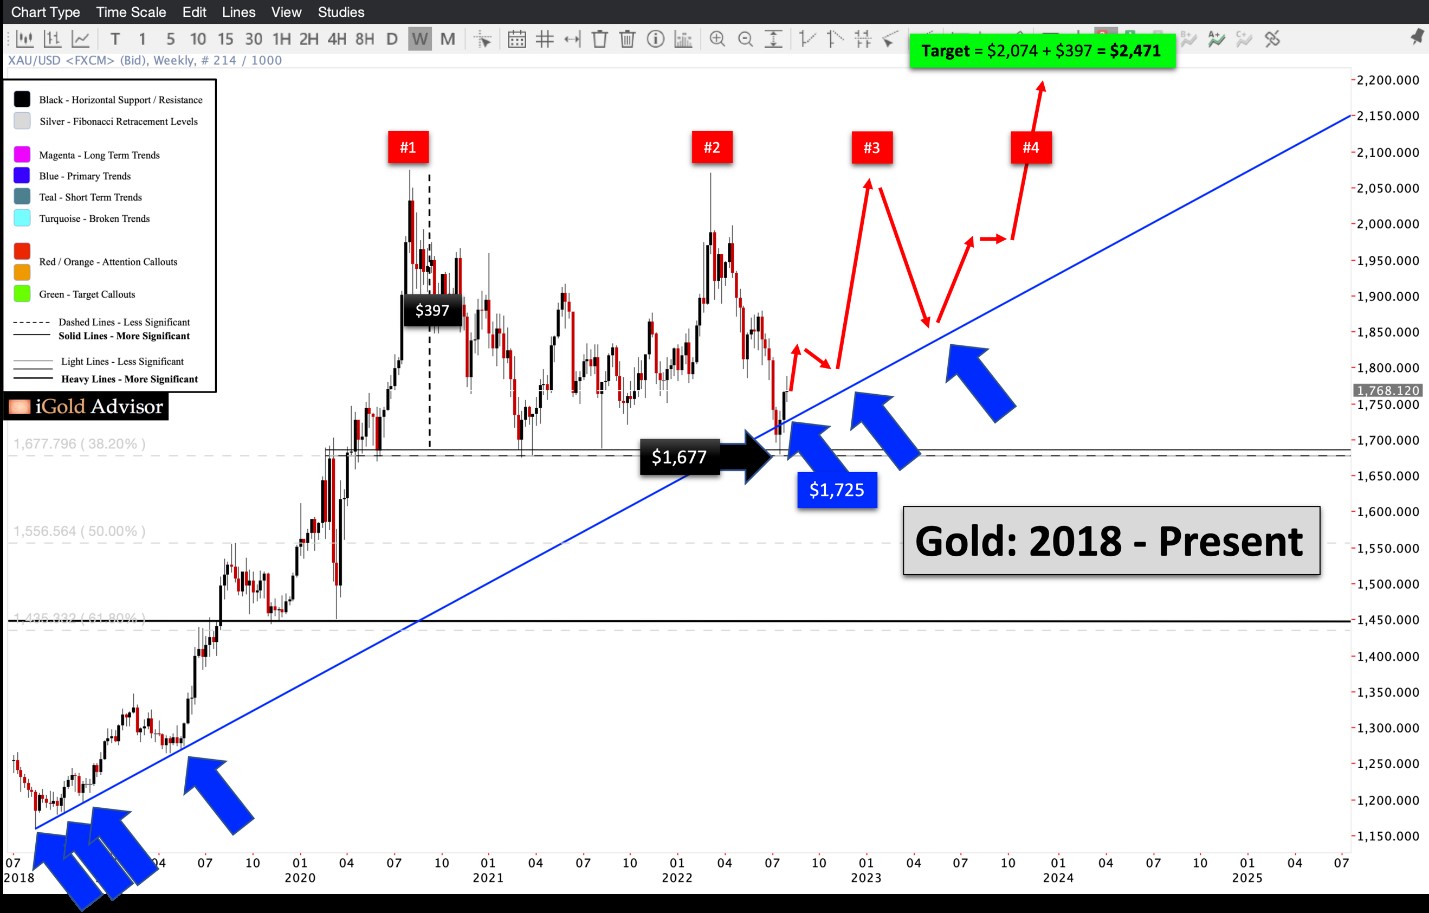
The following projection assumes that rising primary support (blue), which has now held on five occasions since 2018, continues to hold. At present, the level which must hold is $1,725. Typically, for a trend this long, we are watching for dual-weekly closes above the price in question – any amount of time less than that and the breakdown would be suspect for a false signal.
It is critical to remember that primary support (blue) is indeed rising, and so while the level we are monitoring is $1,725 at present, as time moves forward this level will indeed be higher than it is today. Trends must be continuously monitored as they are often dynamic in nature.
Assuming that $1,725 holds, we will be looking for gold to rise over the remainder of 2022 back toward the two peaks labeled #1 and #2, at $2,074 and $2,070, respectively. Gold could realistically rise to any price approaching $2,000, and this would constitute a functional third test of the key resistance zone.
Based on a detailed study of markets throughout time, our highest-probability expectation is that gold will not be successful in breaking the $2,070 - $2,074 resistance zone on the third attempt. In an ascending consolidation, markets typically need four solid tests of resistance in order to break higher. Thus, our highest expectation is that gold’s ongoing consolidation will set the stage for a breakout in mid-late 2023.
Gold Price Target
What will be gold’s price target once it finally breaks above the 2020 – present resistance zone of $2,070 - $2,074?
In this instance, we will have a clear target calculation of $2,471 per ounce (green callout), which is defined as equal to the amplitude of the entire preceding consolidation ($397 per ounce), added onto the breakout point of $2,074.
Assuming a late-2023 breakout of resistance, we would expect this $2,471 target to be achieved in mid-late 2024.
The Importance of Support
We must reemphasize that the above target assumes that primary rising support, which has just successfully been tested, continues to hold as time progresses. A break of $1,725 for two consecutive weekly closes suggests that – for whatever reason – buyers are no longer present in the gold market in the way they once were. If gold were then still going to break the $2,070 - $2,074 resistance zone, it would have to do so on the opposite side of the broken trend. This would imply a breakout not until 2025 at the earliest as the bullish scenario, with a potential further decline of several hundred dollars as the bearish scenario. We will discuss these alternate scenarios in a future article if evidence for such a negative outcome were to materialize – for now, remember the rule: support is valid until proven otherwise.
We thus place a significant amount of importance on the validity of this primary rising trend.
Takeaway on Gold
Gold has just successfully tested 4-year rising support by recovering $1,725 on dual weekly closes. The market is seeing a valid trend of buyers emerging at higher and higher intervals throughout time. Meanwhile, sellers are determined in the $2,070 - $2,074 zone. This is a bullish pattern which argues for a breakout to the upside within 6 – 12 months.
On an upside breakout, gold will target $2,471. Only a failure of the support level would change this target expectation.
We encourage investors to follow this rising trend with us closely over the coming year. At www.iGoldAdvisor.com, we are preparing to purchase several precious metals-related investments. In addition to bullion, we plan to make highly-leveraged investments via private placements, which offer investors free warrants in gold mining companies in addition to their shares.
********

Christopher Aaron began his career as an intelligence analyst for the CIA and Department of Defense. He served two tours to Afghanistan and Iraq between 2006 - 2009, conducting pattern-of-life mapping for military leaders.
Mapping shares similarities with technical analysis of the financial markets because both involve the interpretation of repeating patterns found in human nature. He is the founder of iGold Advisor, providing independent research and analytics on all aspects of the precious metals markets.
He speaks regularly on the cyclical patterns found within the financial markets and on international policy. He has been featured in the New York Times and NPR news amongst other financial publications.


