Gold Price Forecast: Will The Golden Wedge Resolve Soon?


The pressure on the current monetary establishment has been building steadily. Just because gold and silver has not made a major move up, does not mean that the terminal illness of the international monetary system has now gone away. On the contrary, its imminent demise is now more certain, given the various financial confirmations over the last couple of years (see my other writings).
A rise in the gold price above $1 375 will confirm that the bull market is on. Below, is an important gold chart that I am tracking:
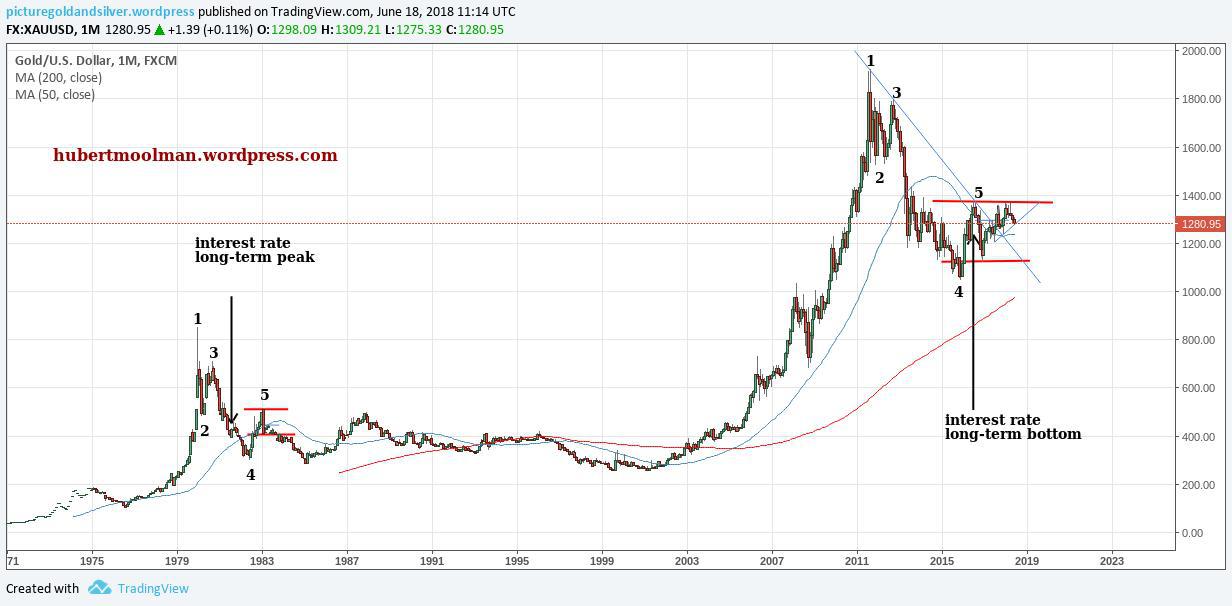
I have marked two fractals (patterns) 1 to 5, to show how they might be similar. I have also marked the point where interest rates peaked (in 1981), and where they probably bottomed (in 2016).
If the comparison with the 1980s pattern is justified, and the current pattern continues in a similar fashion, then gold will continue in a long bear market. However, there are just too many fundamental obstacles to such a scenario (interest rates being one of them), since gold appears to be ready for the next phase of the bull market which started around 2000.
A breakout at the top red line (the high at point 5 - $1 375) would almost certainly signal or confirm the bull market. This would be divergence from the 1980s pattern, and likely cause prices to rise really fast once the breakout is confirmed (when dealing with fractals, the biggest price movements occur when two fractals diverge).
This, in my opinion, is the most likely outcome.
A breakdown at the bottom red line, could mean that prices will continue to follow the 1980s pattern, and go lower than $1000. Which would mean we will have to wait many years (even a decade) for the next gold bull market (very unlikely).
Another way to look at the gold chart is the big bullish wedge highlighted:
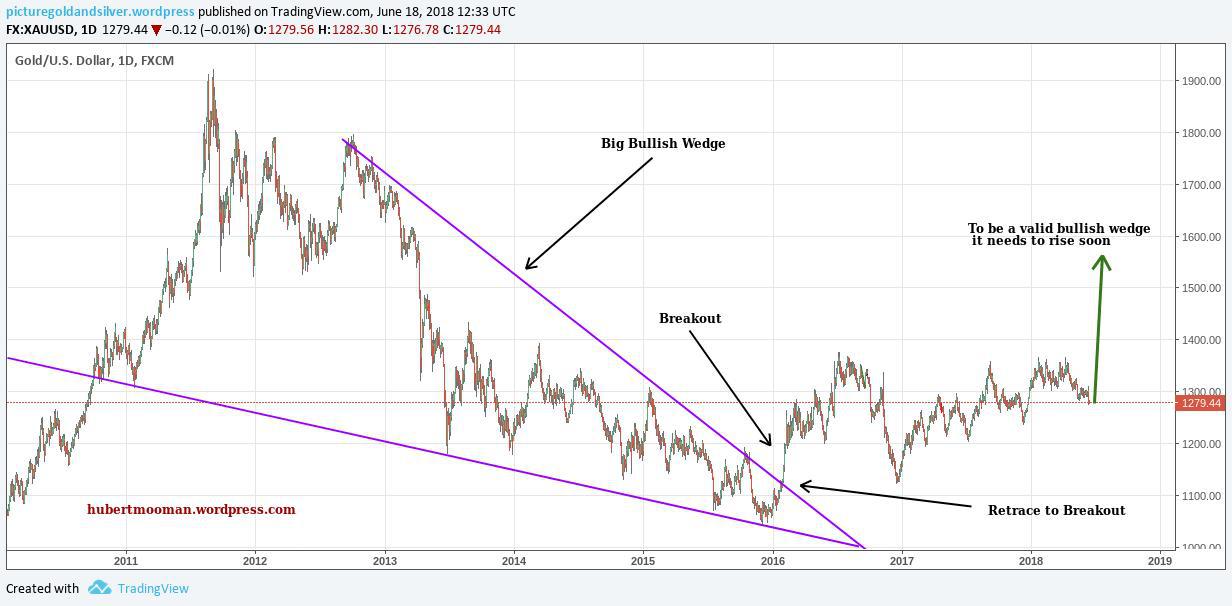
A bullish wedge pattern is nothing new for gold (For example, there is a massive bullish wedge that formed from 1980 to 2001).
On this chart, price has already broken out of the wedge (early 2016), as well as retraced to that breakout area. If the bullish wedge is to be valid, then price needs to spike soon.
********
For more on this and this kind of fractal analysis, you are welcome to subscribe to my premium service.
I have also recently completed a Silver Fractal Analysis Report as well as a Gold Fractal Analysis Report. You can also subscribe to this blog (enter email at the top right of this page) to get my regular free gold and silver updates.


