Gold Prices Face The Wall
 share
share
 share
share
 share
share
 share
share
 share
share

Walls have been in the news a lot lately. Walls which may be built, walls which may not be built.
Yet for all the talk of walls these days, there is one wall that precious metals investors should be focusing on foremost. And no, it has nothing to do with the southern US border.
Instead, the barrier we are referring to is the wall of sellers who will be showing up in the precious metals as gold approaches $1,300 per ounce.
What are we referring to, specifically?
Let us examine the visible data.
Gold Has Been Strong
For the week ended Friday, January 4, gold finished higher by $4 or 0.3% to close at $1,285 as of the final trade on the New York COMEX futures exchange. On Thursday night, the precious metal touched $1,300 before backing off by the end of the week.
Gold is now up 10% or $117 from its recent August low of $1,167.
With this recent strength evident, why do we believe that a large influx of selling is soon to emerge? What is this wall of sellers who will prevent gold from rising significantly above $1,300 over the months ahead?
They are contract holders from the 2018 peak – and there are lots of them.
2018 Peak – Highest Volume of All-Time
It is not simply that there many contract holders who purchased gold during the 2018 peak, but more specifically: 2018’s top saw the highest volume of contract holders ever witnessed in the history of gold trading. Ever.
Let us examine the chart:
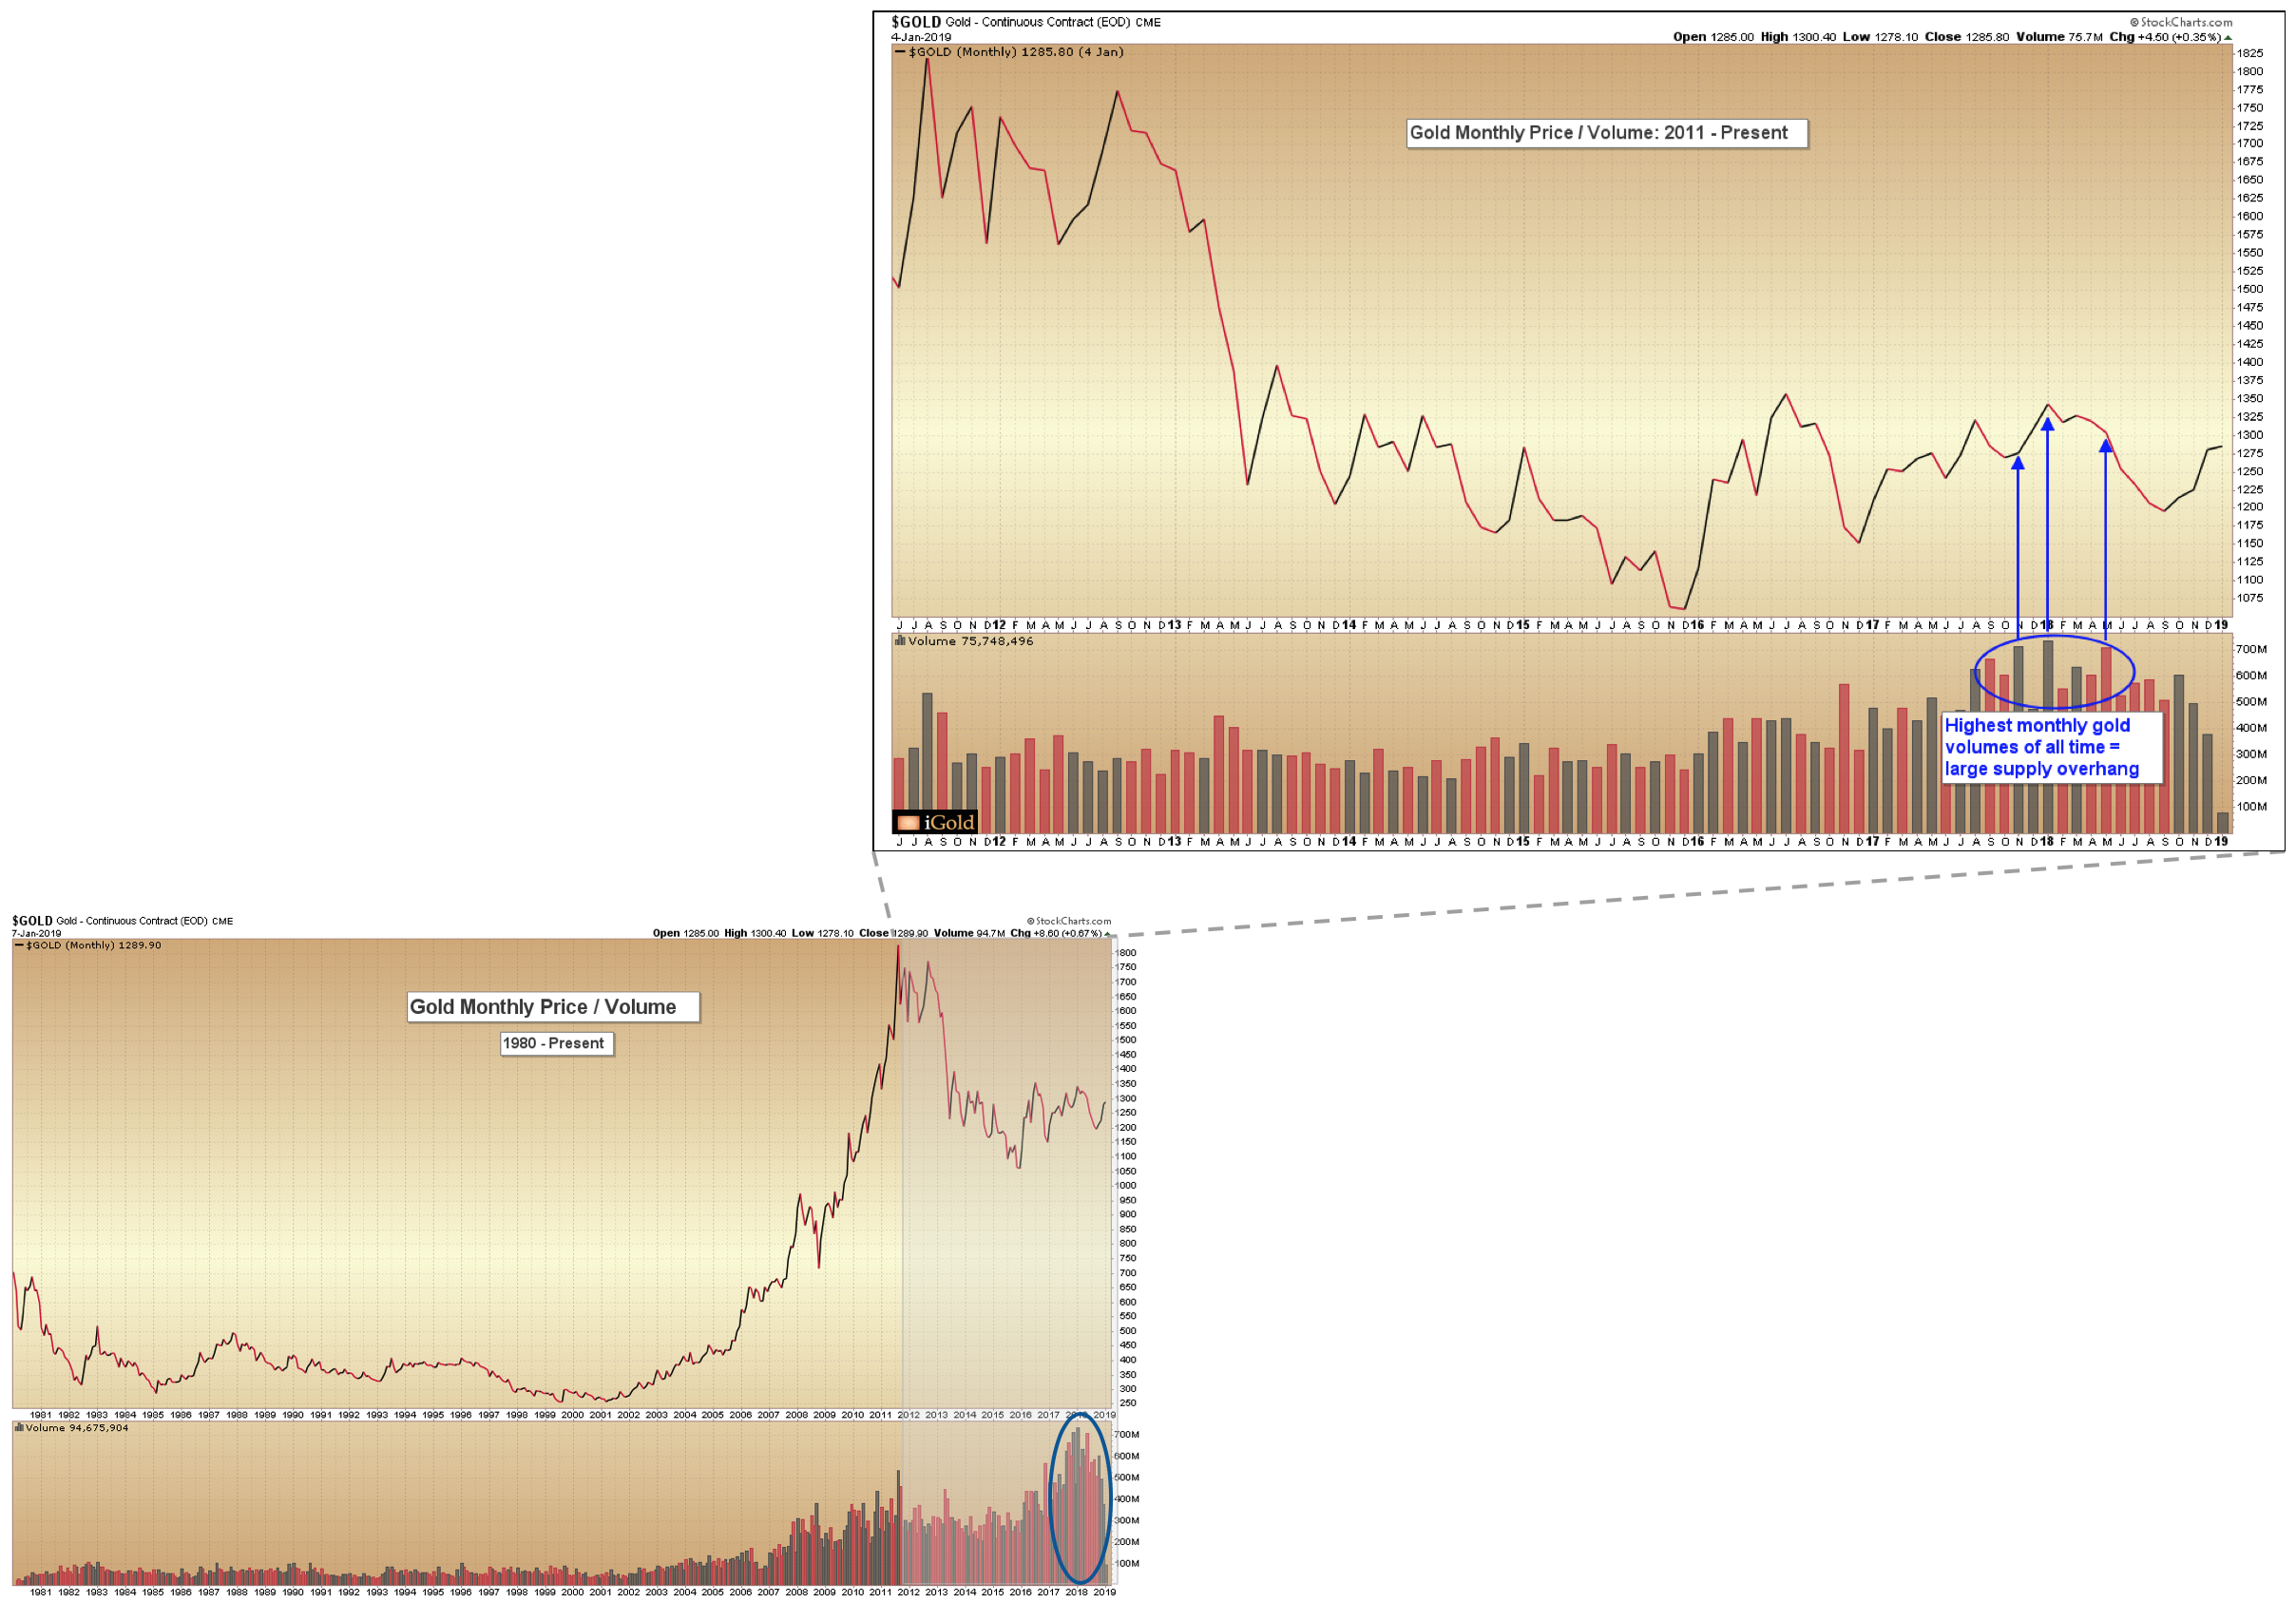
2018’s top was not a single-day high-volume reversal, as was seen, for example, on the night of Trump’s victory in 2016. No, this was a grinding affair lasting 5.5 months between January and mid-May featuring the highest sustained monthly volumes of all time.
Why do we believe so many contract holders will be selling now, as gold approaches $1,300 again? Because this record-breaking volume occurred at a relative peak for gold prices. In other words, a record number of traders who purchased gold above $1,300 in early 2018 have been underwater ever since. And so, when the price returns to near their break-even points, what is the one thing that most these traders are going to be relieved to do?
Sell.
Explaining the Volume Chart
Again, we must emphasize that the highest volumes ever recorded in gold trading history occurred during the five-month peak of 2018. Over 700 million contracts traded hands during two separate months from January through May. This exceeds the monthly volumes from 2011, when gold peaked at $1,923 per ounce. This also exceeds the volumes for the last major bottom in 2015 at $1,045 per ounce.
In other words, investors showed more conviction at the recent 2018 peak than at either the last major bottom or the last major top for gold.
It is only human nature that, when one purchases an asset which immediately drops in price, one then desires to sell when the asset approaches the break-even point again. This is even more true for traders and investors who utilize futures contracts, which is what we are discussing here. Physical bullion holders may be less likely to sell amidst such short-term volatility – but institutions and funds who operate in futures contracts are generally more oriented toward short-term performance.
Many of these institutions will be looking to sell as gold approaches their initial buy points.
So strong is this anticipated effect, that we are comfortable calling the forthcoming pressure a wall of selling which is set to emerge.
In the highest probability, gold will not be able to overcome this wall immediately. The metal should thus form an intermediate top and retreat at least back into the low $1,200’s, the next level of significant support, at which time we will then have to evaluate a host of indicators to judge the strength or lack thereof of the bottom attempt. We will be looking for this next low into the middle part of 2019.
Could the Wall Be Overcome?
Could an entirely new group of buyers now emerge and overwhelm those sellers?
Theoretically yes – but such would be an outlying probability. We see no evidence for a sizeable new cohort yet. In fact, volume has been declining on the price advance since October 2018.
The bias should be with the visible evidence, which sellers will begin to emerge as gold pushes toward $1,300. A hint of this pressure was witnessed at the end of last week, as gold briefly touched $1,300 but then retreated back to $1,285 by Friday.
While we always recommend that investors hold at least a portion of their wealth in gold as insurance, those already with a significant position should not chase this rally.
Gold will have to overcome the highest volume of sellers of all-time who previously purchased at the 2018 peak. Better buying opportunities should exist later in the year.
share
share
share
share
share

Christopher Aaron began his career as an intelligence analyst for the CIA and Department of Defense. He served two tours to Afghanistan and Iraq between 2006 - 2009, conducting pattern-of-life mapping for military leaders.
Mapping shares similarities with technical analysis of the financial markets because both involve the interpretation of repeating patterns found in human nature. He is the founder of iGold Advisor, providing independent research and analytics on all aspects of the precious metals markets.
He speaks regularly on the cyclical patterns found within the financial markets and on international policy. He has been featured in the New York Times and NPR news amongst other financial publications.


