Gold Reaches Critical Support, Near-Term Turnaround Expected
We believe gold has reached a critical major support level and its action over the next one-to-two weeks will determine whether it will break firmly beneath this level or rise to short-term highs.
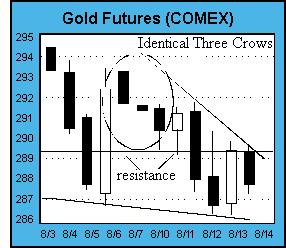
To reiterate our technical analysis of gold futures, we are following a developing "falling wedge" formation on gold's futures chart which portends higher prices in the days/weeks ahead, if our interpretation is correct. This would probably lead to a test of gold's near-term resistance of $298.50 on the December COMEX futures contract. This target, should it be achieved will bring gold to relieve the latest selling pressure that gold has experienced of late and will provide a great opportunity for sellers to go short once this level has been reached in anticipation of another fall to $289 or lower. For buyers (i.e., long-term and "crisis" investors) of numistmatic and semi-numismatic coins (such as the American Eagle), now is the time to buy gold at lower levels before the inevitable rally. Although lower buying opportunities should present themselves, near-term at least, this would provide the best opportunity for buying gold.
For now, gold's nearest resistance level is at approximately $289.50 (basis December). In the candlestick chart, note how this resistance level crosses the "real body" of the long white candle almost directly at its midpoint. Under a technique developed by Japanese candlestick expert Steve Nison, the nearest "long" candle can be divided by a line to provide a reasonably accurate near-term support/resistance level. In this case, gold's resistance level at $289.50 has provided an excellent guidepost as action in the gold market in recent days has failed successively to penetrate this overhead line. Further adding to the strength of the $289.50 level is the fact that for over two months that level served as a strong near-term support that was only penetrated (on a closing basis) twice. Clearly, $289.50 is the level to watch over the near-term. The next overhead resistance level for gold lies at $298.50, exactly $10 away. This level has also proven exceptionally strong in recent weeks and should not be ignored if gold manages a rally above $289.50.

Note also in the candlestick chart provided here the "Identical Three Crows" pattern we have circled. This formation is known in Japanese candlestick analysis as a bearish continuation pattern and we should expect further weakness in gold's price in the days ahead based on it before the expected turnaround.
Another very crucial technique under the Sakata method of candlestick analysis that must be considered in light of gold's ongoing bear market is the "Eight Price Lows" (the opposite of the "Eight Price Highs") method of interpretation that has been called the "backbone" of Japanese candlestick analysis. Under this method, a commodity (in this case gold) can be expected to register at least a minor rally once eight consecutive down days with successively lower closes have been registered. There exists some leeway under this method—there can be one or two "bullish," or up days between falling days, but the overall trend should be downward. And the falling days can sometimes number more than eight, but almost never more than 11. But our rule of thumb for almost any stock or commodity is that rarely will any market experience a downward trend exceeding 8-11 days without experiencing some sort of temporary "correction" before proceeding downward. Keep this truism in mind when watching gold's chart unfold. If we are heading into extreme bearishness in the gold market and gold falls on successive days as it has over the better part of two weeks, traders can time the expected short-term turnaround by counting the number of lower closes in gold's chart. This in conjunction with actual candlestick pattern analysis provides an excellent way to time market turns and manage risks when trading futures.
Back to our falling wedge formation mentioned at the beginning. If our interpretation is correct, gold's chart is indeed forming a bullish technical formation which portends slightly higher prices in the days ahead. Short-term traders should begin following this formation on their own charts and consider going long to the projected target in the $295-$298 area. As gold's price nears the apex of the triangle, positions should be entered.
To summarize our position, gold is technically overbought and should experience a minor rally at some point within the next two to three weeks with a projected upside target of approximately $289.50, an intermediate resistance level. However, our long-term forecast still calls for much lower prices in the weeks/months ahead as gold approaches the bottom of its 18-year bear market, a bottom that should be reached by the beginning of the next millennium.


