Gold, Silver and their Miners are Outperforming the Broad Market


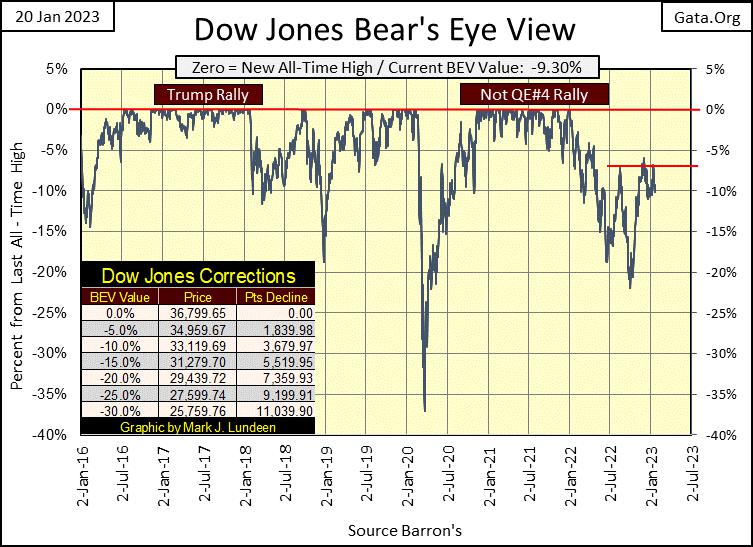
The Dow Jones continues having difficulty breaching its BEV -5% line in its Bear’s Eye View chart below. On Monday this week, it made its third failed attempt since last August to break above this level. Seeing the Dow Jones close the week with a BEV of -9.30%, just above its BEV -10% line is, in my opinion, an indication of exhaustion in the market.
What’s happening? Two sources of “liquidity” for the bulls are drying up;
the FOMC’s has been draining its “liquidity” from the financial system; $410.75 billion since May,
NYSE margin debt has declined $290 billion dollars since it peaked in October 2021.
I have more on this later in this article. This isn’t news to my readers, but I think it is to most people, and there isn’t any reason to believe these two very negative trends for the bulls will reverse anytime soon.
I suspect the problem with the Dow Jones’ BEV -5% line is, professional-money managers are longer-term bearish, so they are selling into market strength whenever they find it, like just below the Dow Jones BEV -5% line.
It’s nice having cash when the market becomes cheaper. If you never have cash to buy when the market becomes cheaper, maybe it’s because you never sold into strength at a top? And I believe we are at a top. Looking at the Dow Jones below, since its last all-time high of January 4th (2022), it’s been struggling.
That sounds like good advice I can pass on to my readers; raise some cash and don’t be in a hurry to come back into the market until the Dow Jones is somewhere below its BEV -30% line.
Now, that isn’t me! I’m all for raising cash at these levels. But I wouldn’t come back into this market until the Dow Jones is well below its BEV -60% line, because I believe we are heading into a historic-bear market. Why is that? The Federal Reserve and its banking system has fostered too much debt in government, business, and for individuals is one problem, and it’s not a small problem.
Then the hundreds-of-trillions in dubious derivatives the financial system has created for interest rates and bonds. Bond yields when they rise to some unknown level sometime in the future, will result in massive / overwhelming counter-party failures in the global banking system. That is never bullish for the stock market. But for gold, silver and the mining shares, well that is something totally different.
The nice thing about a big-bear market bottom, is at the bottom, Mr Bear and his cleanup crew will have picked up, and hauled out most of the garbage a financial system accumulates during the previous bull market. Debts (bonds & bank loans) that will never be serviced to term, assets trading at grossly overvaluations are either written down or totally written off balance sheets.
People exposed to this process; people exposed to market risk in a bear market will see a dollar of their capital become worth much less. There was a joke from the depressing 1930s; if you want to make a dollar in the stock market, its best to start with four.
At bottoms, the market is in shock for the devastation seen all around. The fear is real at a bear market bottom. But from a risk rewards perspective, keep in mind:
MARKET TOPS offer MIMIMUM REWARDS and MAXIMUM RISKS to invested funds,
MARKET BOTTOMS offer MAXIMUM REWARDS and MINIMUM RISK to invested funds.
The above two market axioms are as true today as they ever were.
Let’s look at the Bear Eye View values for the major market indexes I follow in the table below. Long ago, in the first week of November 2021, this table had 66 new all-time highs, with everything else (except for the XAU) in scoring position, less than 5% from making a new all-time high. Fourteen months later this table looks like this. The glamor issues in the NASDAQ are down 30%, or more (#17-19).
People are still holding on to them, hoping for a rebound. Maybe that will happen. But most likely people won’t sell these losers until Mr Bear convinces them of the errors of their way; of being bullish in a bear market. It’s sad, but long term, retail investors never make money in the stock market because they refuse to buy at a bottom, or sell at a top.
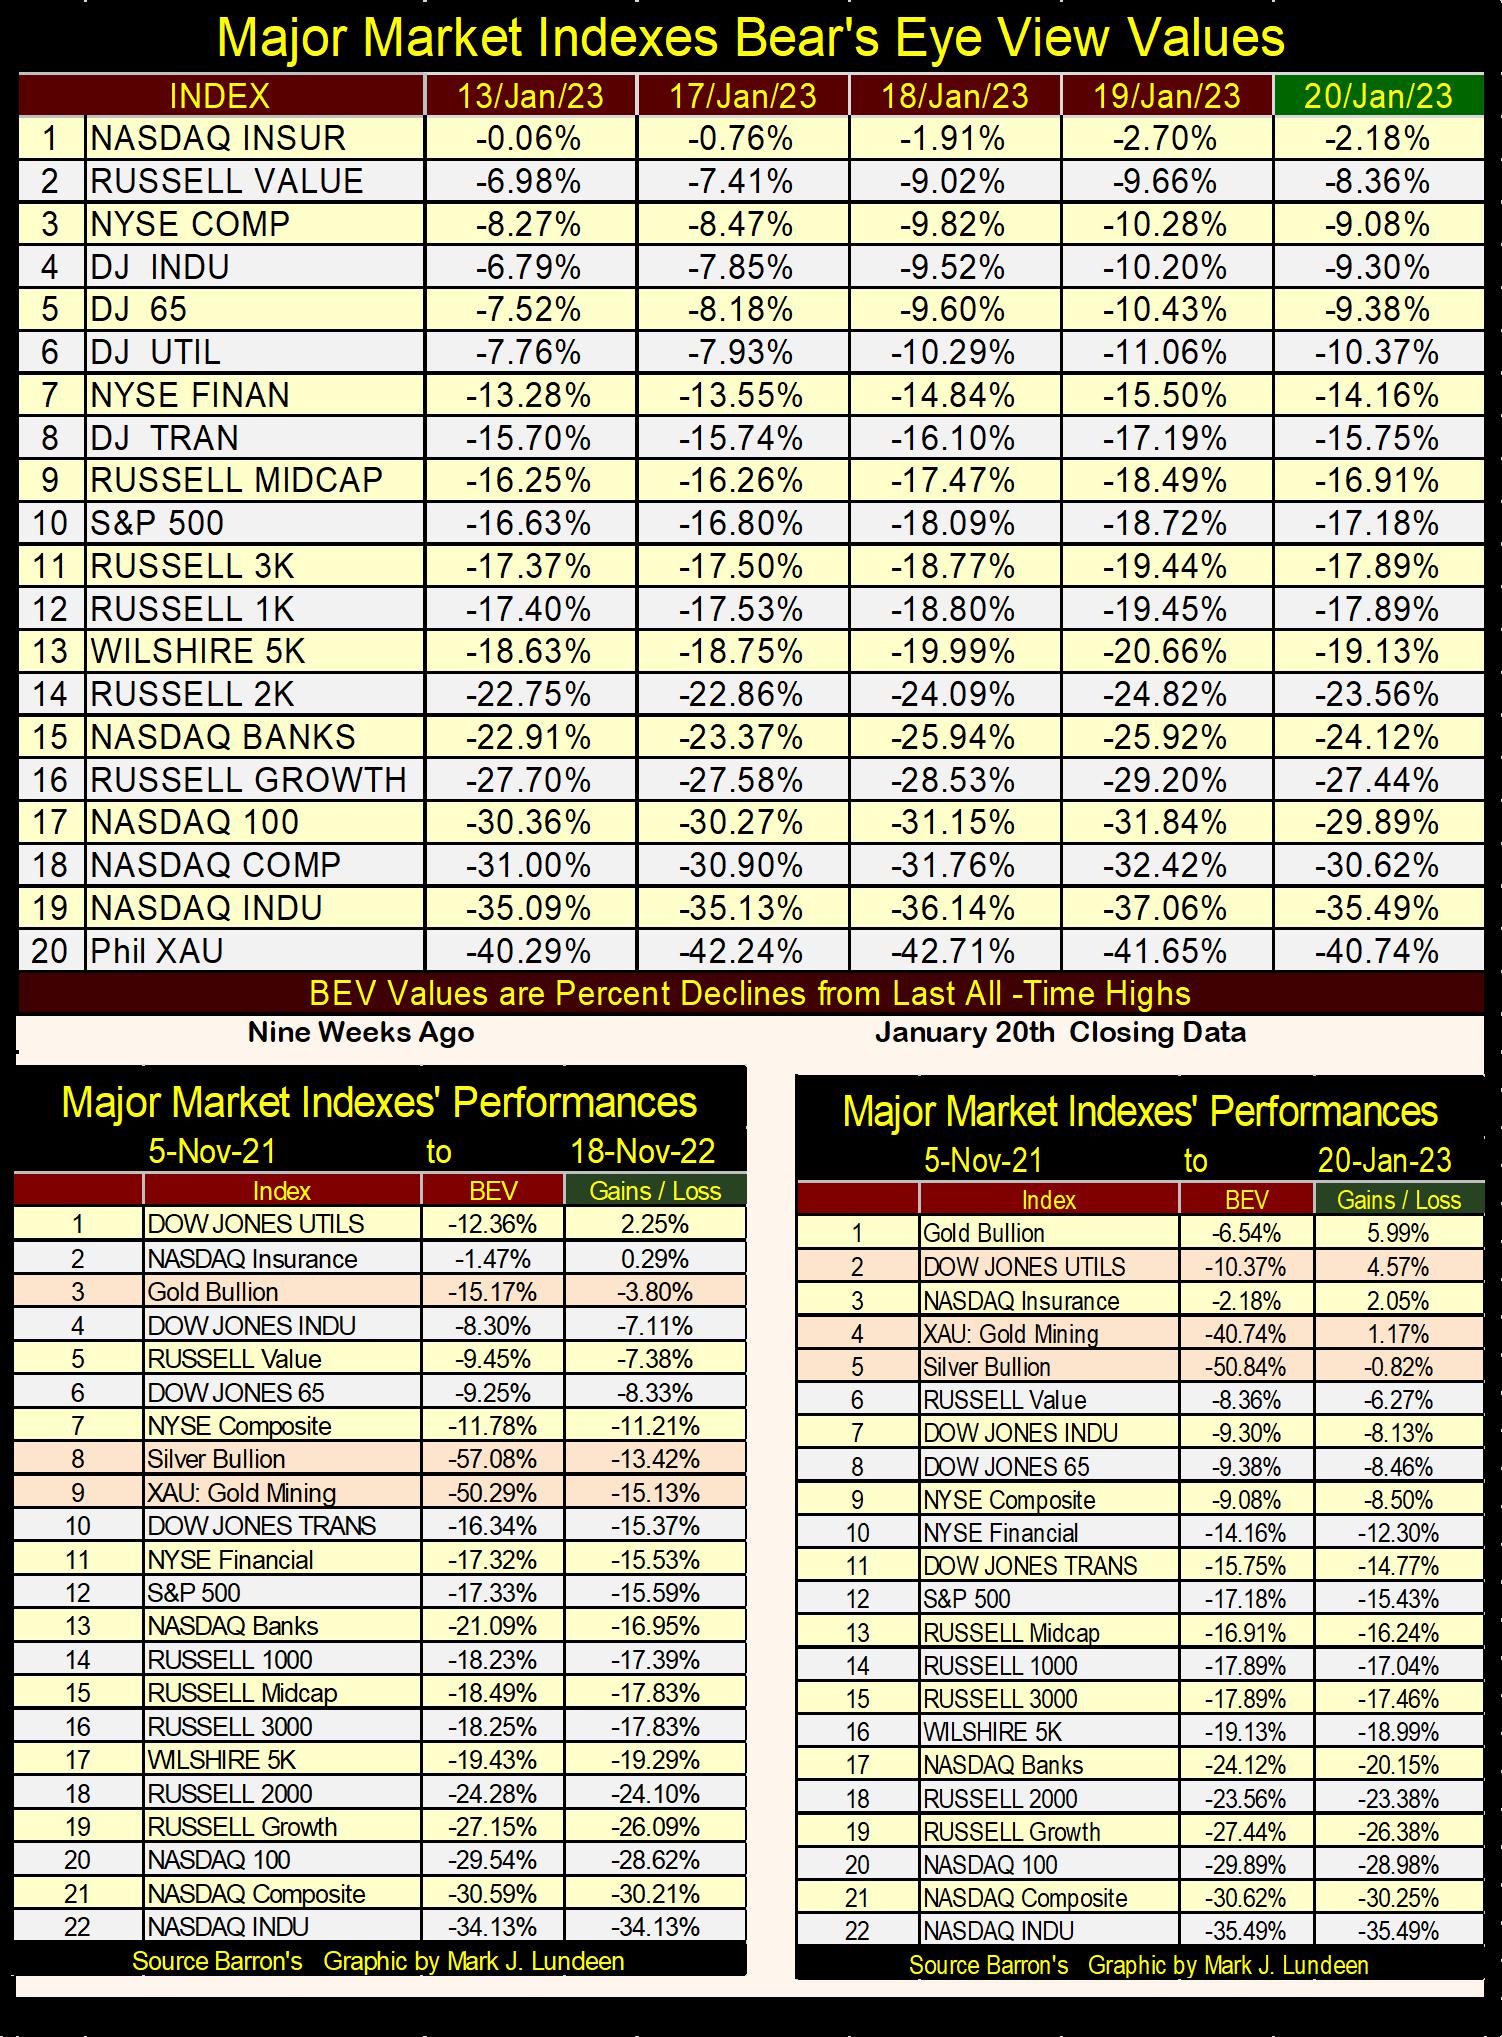
Look at how gold is doing this week (right table). It’s at #1, and the XAU is at #4 and silver at #5. A nice change from nine weeks ago. These statistics are based on the 05 November 2021 market top in this data series. Though the returns in precious metal assets haven’t been stellar, they sure beat the money lost in the hot NASDAQ stocks of yesteryear.
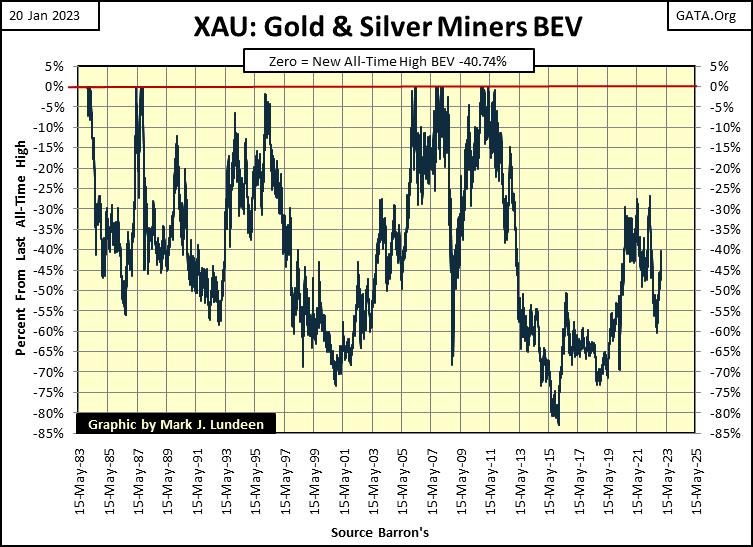
The problem with the formerly hot NASDAQ stocks is that they are still way overvalued and over-owned, but this is not so with precious metal assets. Look at the XAU’s BEV chart below. It made an all-time market low in January 2016; an 83% bear market bottom from its April 2011 all-time high, a market bottom it has yet to fully recover from.
That means that risks remain low, and the potential for financial gains remain high in the gold mining shares. The future glory I see in the XAU won’t happen overnight, and there will be bad days in the market for the XAU. But longer term; months and years from now, the XAU is poised to once again rise up to its BEV Zero line (0.0%), which is a new all-time high, when other market groups are fated to deflate down into the infernal-nether regions below. Though there are “market experts” who would disagree with me on that.
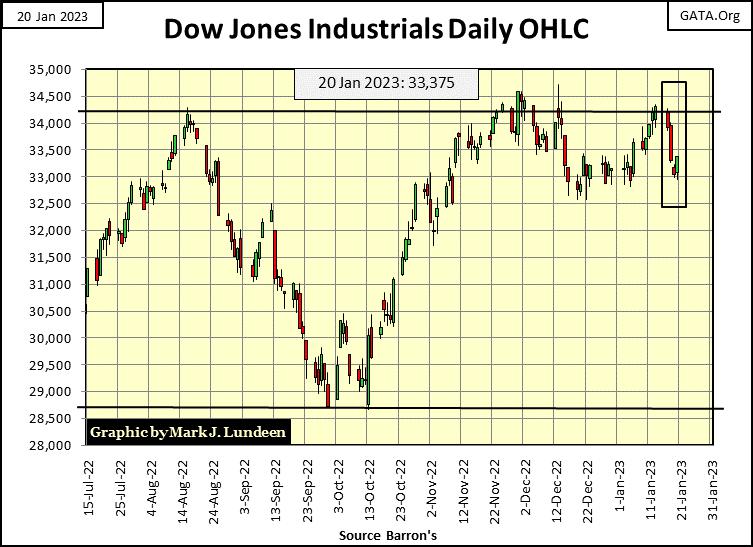
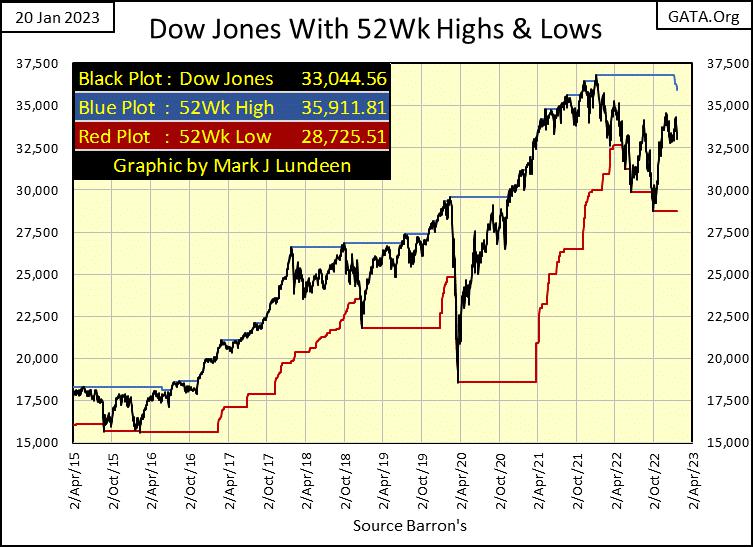
Let’s look at two more charts for the Dow Jones, first its daily bar chart. Looking at the Dow Jones in dollars, instead of BEV points, we see the area of resistance at 34,250, where since last August, the Dow Jones sells off when it crosses that level.
Yea-sure, you-betcha, the next time the Dow Jones makes an attempt at this 34,250 line of resistance, it may charge above it like a raging bull, and we’ll see a new all-time in in the Dow Jones a week later. But I’m thinking this is something most likely not to be. I’m wondering whether the Dow Jones will even make an effort to take out this 34,250 resistance level for a fourth time, and if it does what then?
Everybody has forgotten about the fears they had when the Dow Jones attempted to break below its 28,750 line of resistance last autumn. I’m thinking the bulls have had their opportunities to make some market history in 2022, to the upside that is; something they couldn’t pull off. Maybe in 2023 it’s time for the bears to do something in the chart below; attempt to break below 28,000, and then some.
Moving on to the Dow Jones with its 52Wk High and Low lines, the last all-time high for the Dow Jones (36,799) from a year ago timed out, and the 52Wk High line is now trending down. If in the next few months or so, the Dow Jones should once again begin to push down on its 52Wk Low line, that would not be good for the bulls.
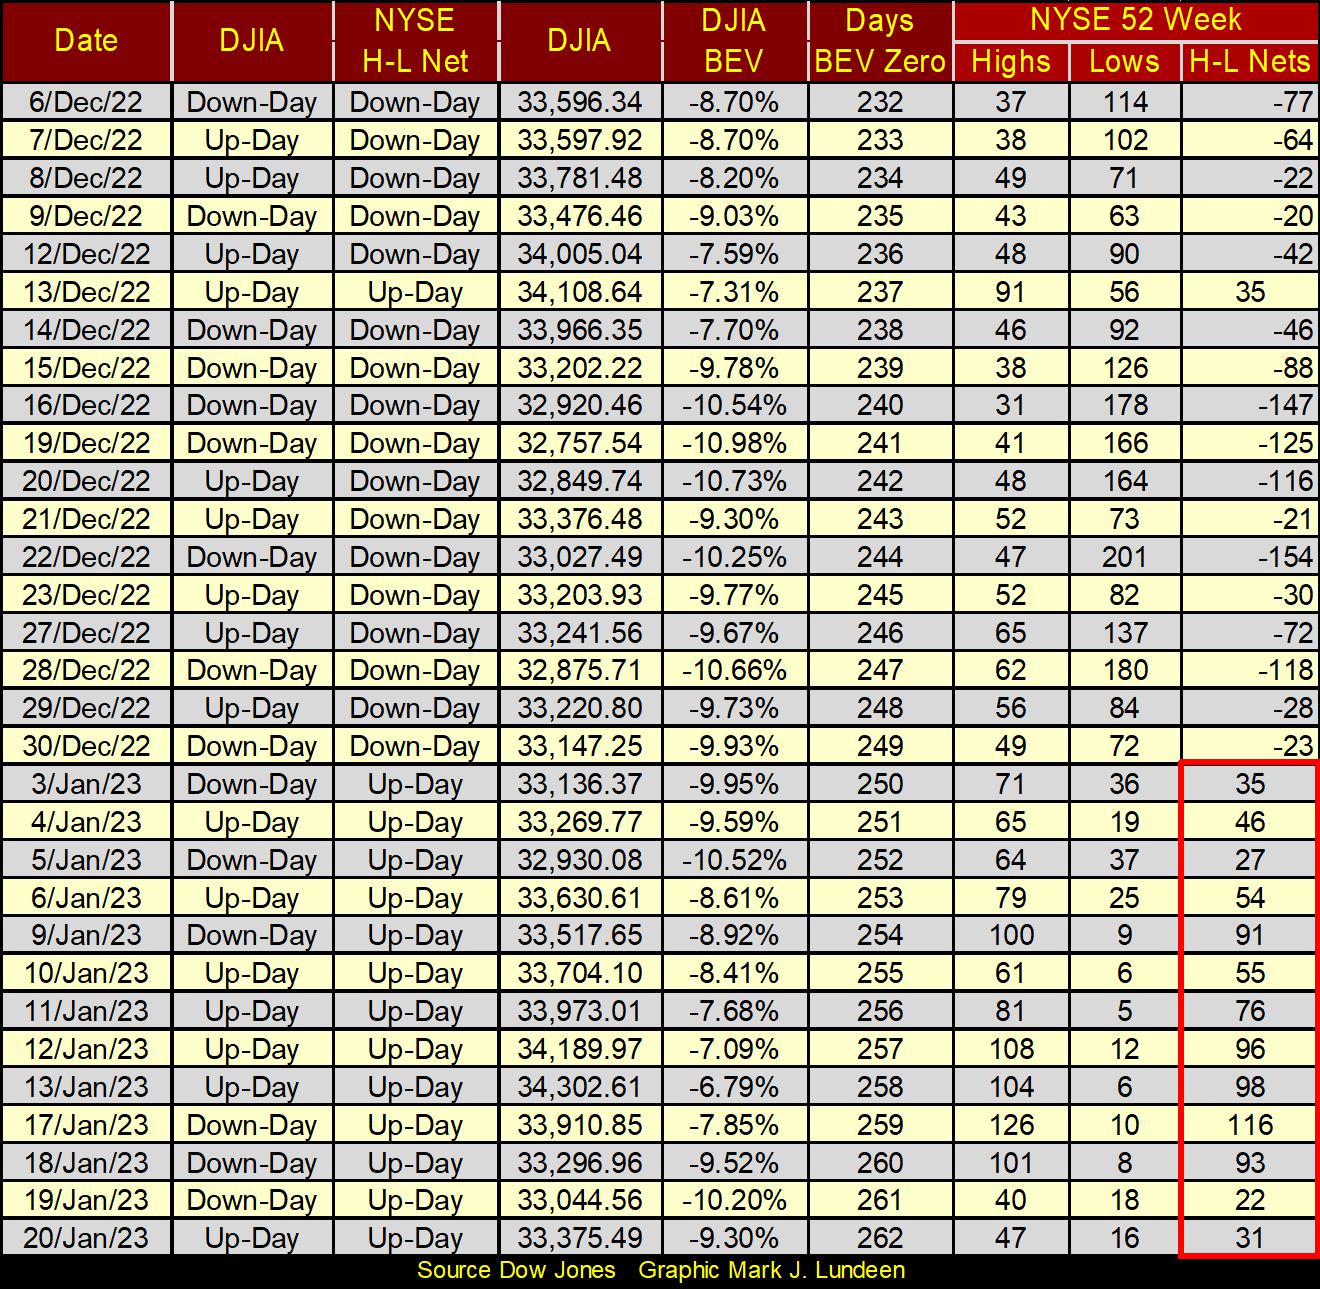
Over at the NYSE, all this January new 52Wk Highs have been more numerous than 52Wk Lows, but just barely. We haven’t seen any 52Wk H-L Nets of +300 or more, and that is exactly how things were all during 2022 whenever the market advanced. So, the market may be going up. Well, maybe I should say the Dow Jones isn’t going down, but there isn’t any power behind this market, as seen in the H-L Nets below.
It seems everything is just running in place waiting for the next big thing, which I’m expecting to be something bearish. I could be wrong, but I don’t believe I am.
Let’s take a look at how the idiots at the FOMC are withdrawing their “liquidity” from the financial system. People forget things, so it’s good having a little review of market stuff now and then. So, let’s take a look at Quantitative Easings (QE) and Quantitative Tightenings (QT), and their impacts on the stock market.
One driver of higher market valuations is “liquidity” flowing from the FOMC. However, as seen in the charts below, since early summer the idiots at the FOMC have actually been withdrawing “liquidity” from the market.
They began this QT #2 in 2022, along with promises to drastically INCREASE INTEREST RATES during 2022. At the time, I believed these actions would result in a market crash sometime in 2022; it didn’t. For years I’ve attempted to predict future trends in the market by what the FOMC said they would do, and what they actually did. And it’s like nailing Jello to a tree; it just doesn’t work out like one would like it too. And then again, maybe it depends on what market index you’re looking at.
The Dow Jones is my proxy for the broad market, and so far, the deepest market decline it has seen was last September, when it deflated 22% from its last all-time high of January 4th of last year. The Dow Jones didn’t stay down for long. It almost broke above its BEV -5% line Friday last week, then closing this week at its BEV 10% line.
Then again, the former glamor issues trading on the NASDAQ have seen significant reductions in their market valuations, as seen in the NASDAQ Composite and 100 indexes. It’s not hard selling a market crash to someone who has seen their investments cut by a third in 2022.
The top chart in the graphic below is a 10Wk M/A, the values seen on the right of the table included in the chart. At the time (December 2008) when Doctor Bernanke announced his QE-1, everyone was amazed at the volume of debt being monetized by the idiots at the FOMC to “stabilize market valuations” in the wake of the sub-prime mortgage debacle. A QE was something new our “policy makers” had never done before; creating a massive tsunami of monetary inflation to flood the market with dubious dollars to inflate market valuations. Something that reeked of desperation.
Six months into his QE-1, Doctor Bernanke, under oath before Congress, was asked if the Fed was going to “monetize the national debt.” His reply was comical; that “the Federal Reserve will not monetize the debt.” Anyone who followed the statistics published weekly by the FOMC knew it was a lie, and a BIG one at that.
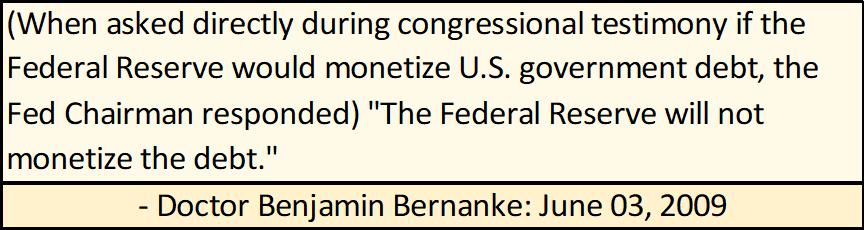
But it was such a nice sound-bite coming from Doctor Bernanke, the mainstream media couldn’t fail to pass it on to the least informed segment of the American population – their viewers. So, the mainstream media, exactly as the Congress had done, didn’t follow up on this whopper of a lie from Bernanke.
An even bigger whopper came from Chairman Powell in October 2019. As he terminated the QT-1 when overnight interest rates in the repo market were spiking into double-digits, he implemented the FOMC’s 4th QE. Powell Stressed to the financial media that they should not confuse his new QE with the three previous QEs, that it was something completely different. That is why I call the QE-4, a “Not QE-4.” As seen below – it really was different from the previous three.
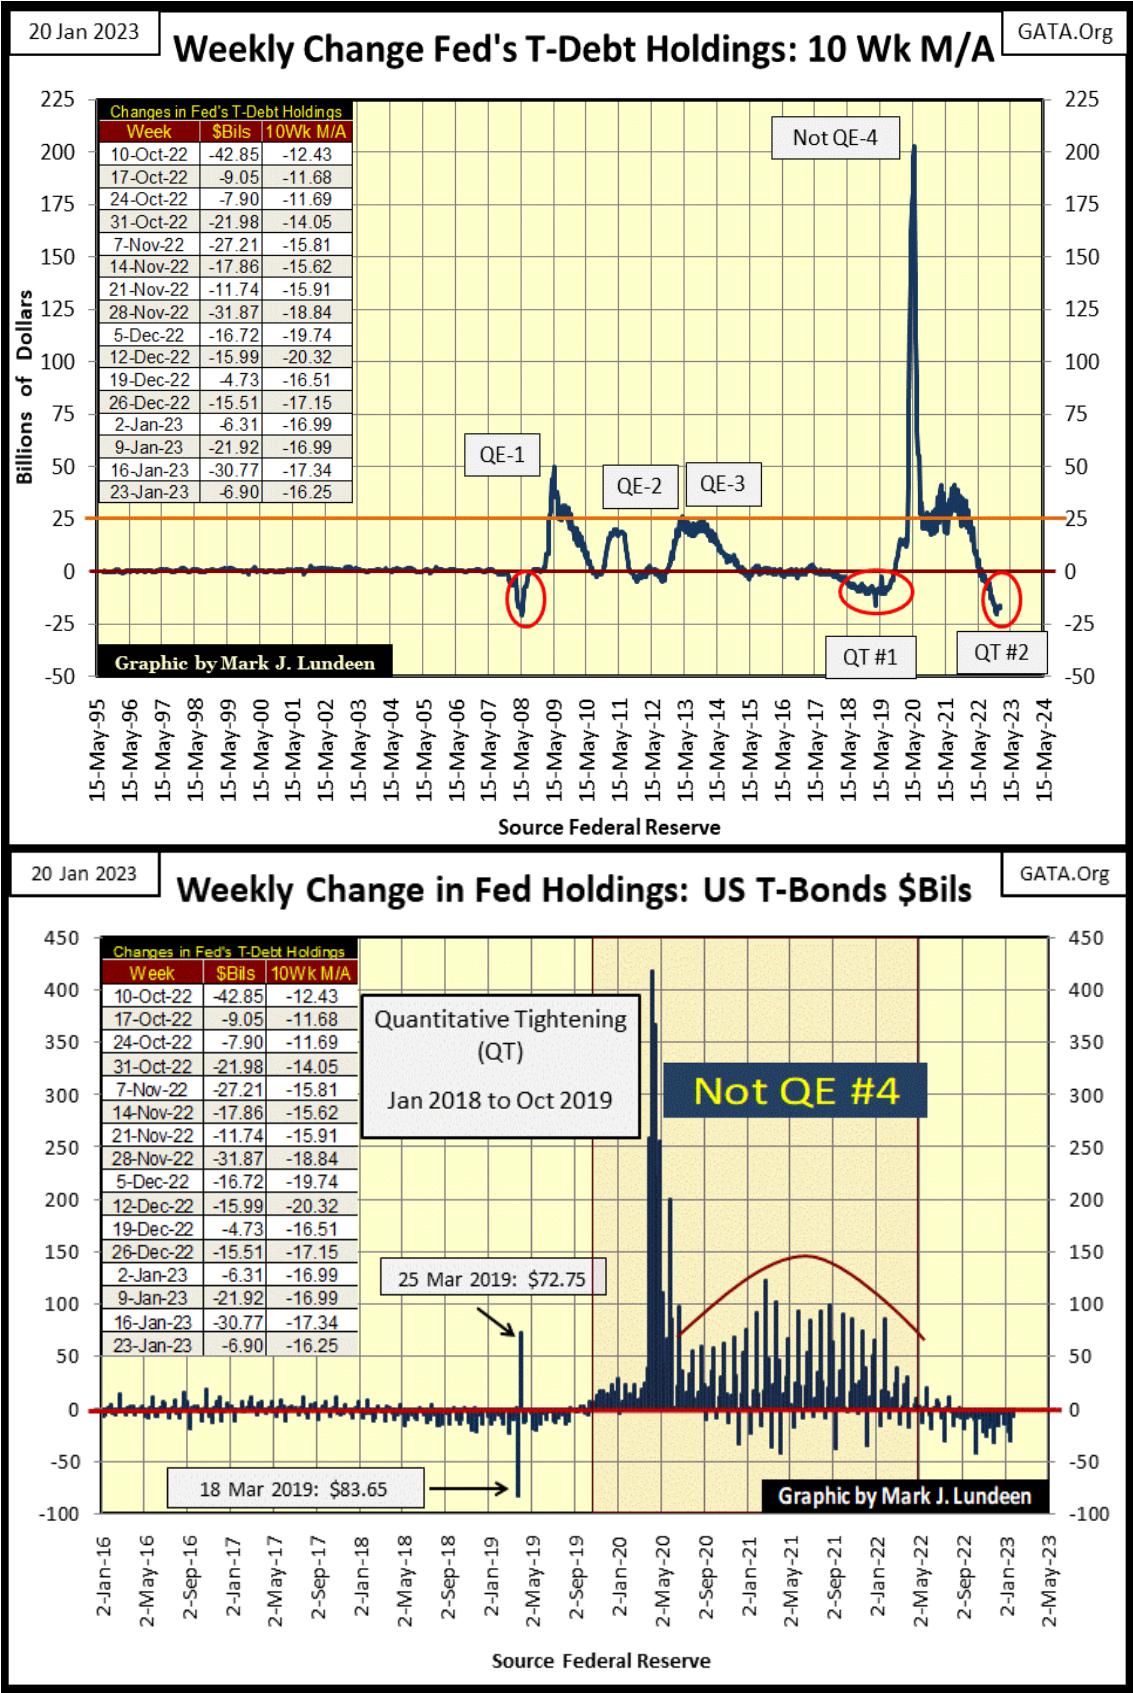
The chart above plots weekly changes in the Fed’s balance sheet. Powell’s Not QE-4 didn’t become wild until late February, as valuations in the stock and corporate bond market began evaporating. At its bottom, the Dow Jones was down only 37%. But from its last all-time high seen on February 11th, the Dow Jones lost 37% of its valuation in only twenty-eight NYSE trading sessions. That had never happened before, and the FOMC understood the problem they faced, and it wasn’t covid related.
Look at Mr Bear’s Report Card from late March 2020 (below), almost three years ago. The NYSE’s breadth statistics went crazy, as half of the twenty days seen below saw an extreme day of market breadth, a NYSE 70% A-D Day. In this same report card, the Dow Jones saw 2% days, every day, except for two.
This was hellfire and brimstone raining down from Heaven on the NYSE. Nothing like the market chaos seen below happened during the sub-prime mortgage bear market. One has to go back to the Great Depression Crash to see something similar. And at no time during the depressing 1930s did the Dow Jones’ valuation deflate 37% from an all-time high in only twenty-eight NYSE trading sessions.
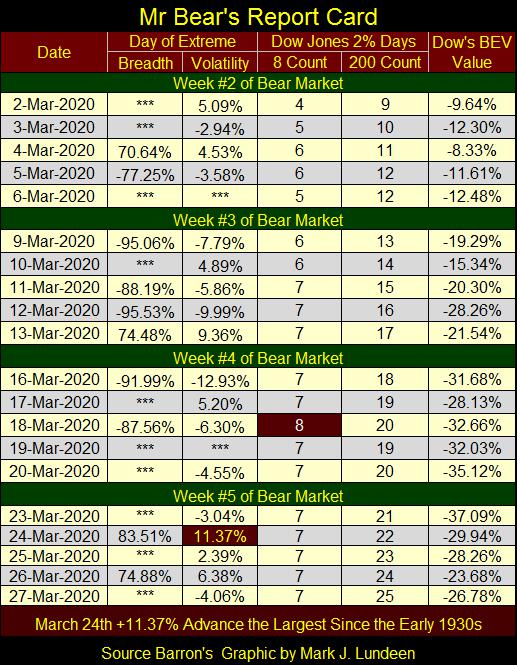
The valuation implosion, and insane daily trading in the Dow Jones and market breadth at the NYSE seen above was something not seen in the market since the Dow first traded in 1885. For good reason, the idiots at the FOMC panicked in March 2020, and so began their Not QE#4 to once again flood the financial system with an even bigger tsunami of monetary inflation. It worked. By November 2020, days after the presidential election, the Dow Jones was once again making new all-time highs.
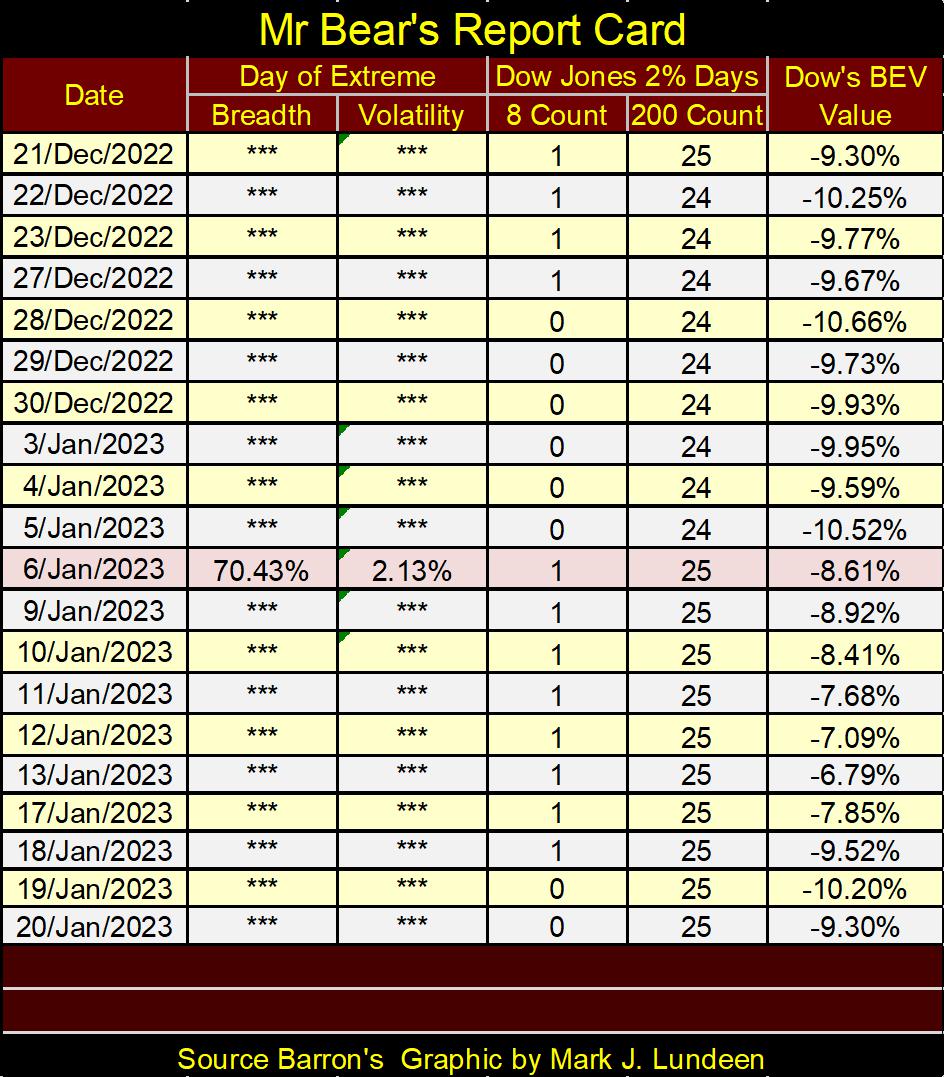
For comparison, here is this week’s Report Card for Mr Bear. Not much to look at when compared to the early part of 2020 above.
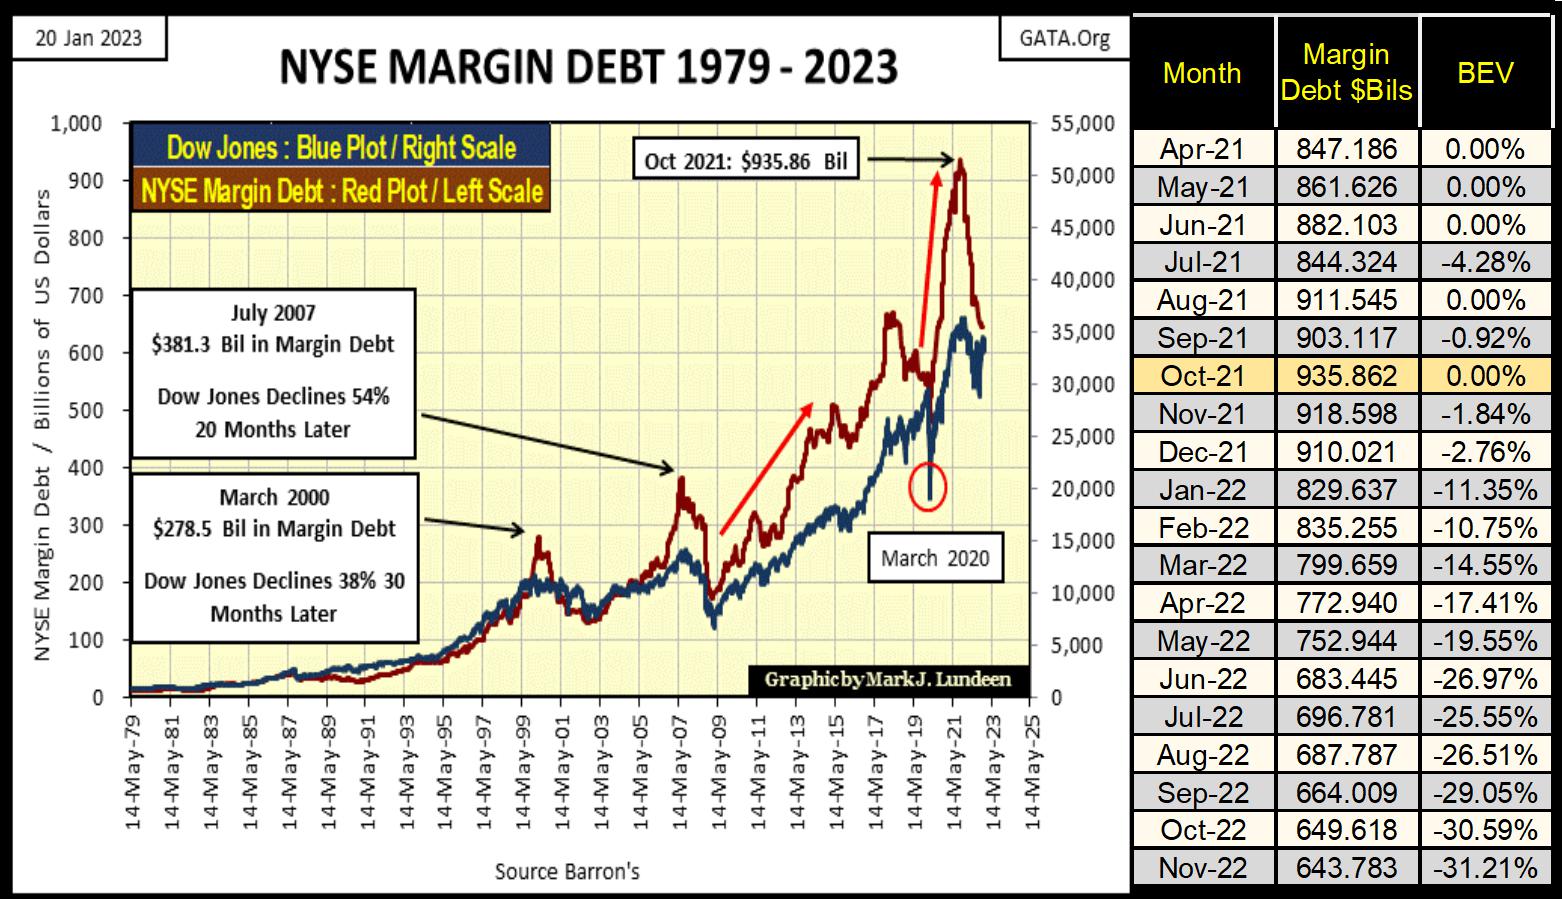
Next is NYSE margin debt. For the fourth time in the 21st century, NYSE margin debt is contracting significantly. The first contraction led to the 2002-02 NASDAQ Tech Wreck, the second to the 2007-09 Sub-Prime Mortgage Bear Market, the third the March 2020 Flash Crash, whose report card is seen above.
And now for the fourth time in the 21st century, NYSE Margin Debt is contracting. The stock market is down since its top of a year ago. Is that it, or is there more deflation in market valuation to come? Being a bear, I’m expecting more deflation in market valuations.
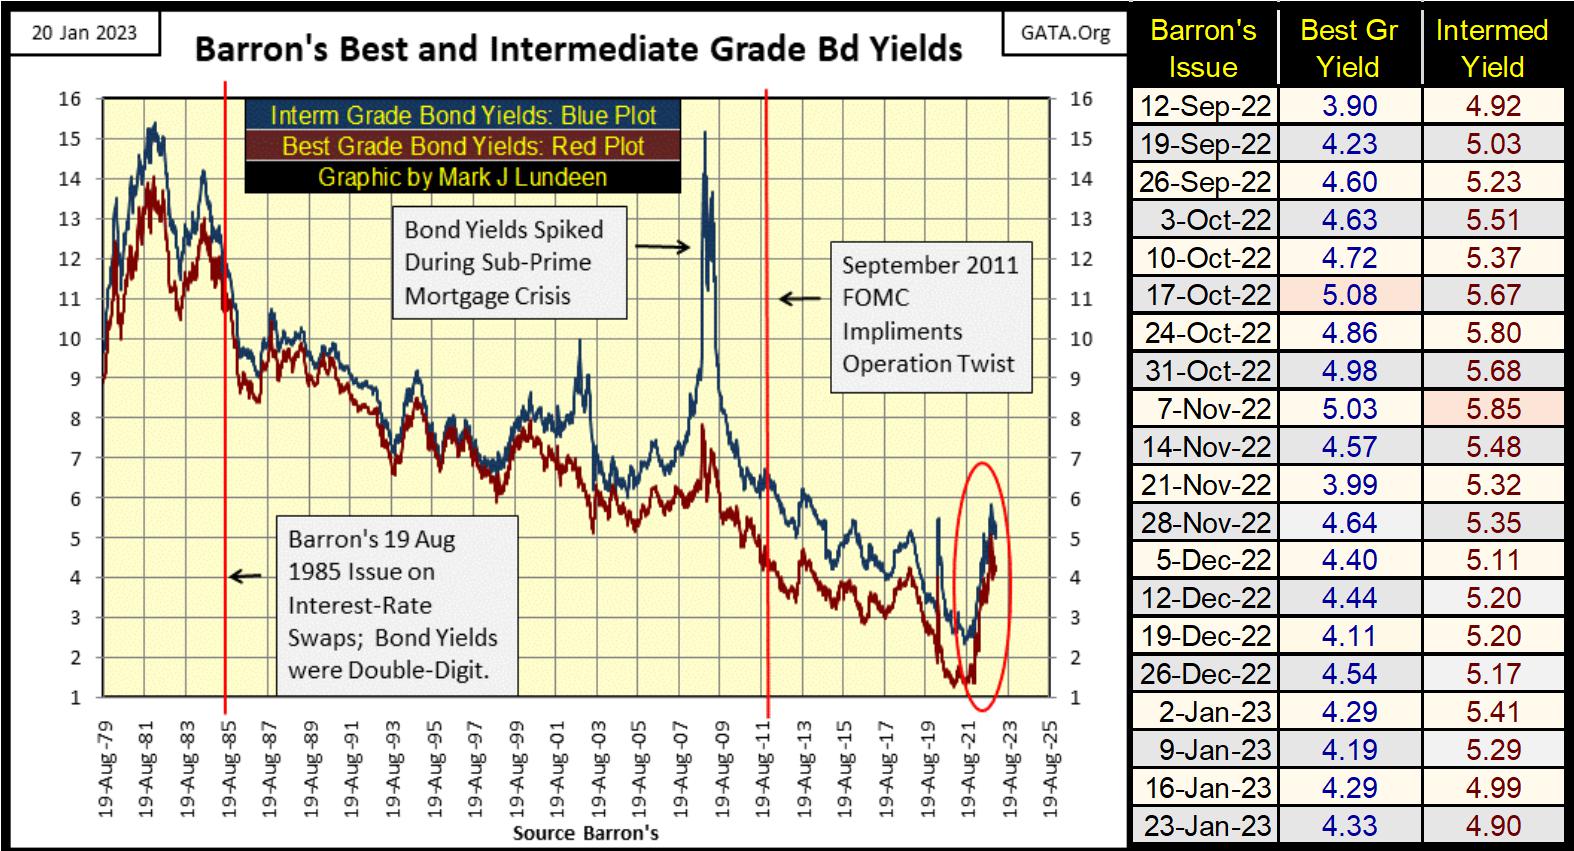
Barron’s Best and Intermediate Grade Bond Yields have stabilized (chart below). That’s good. But if we really are at the threshold of a massive, historic bear market, we’ll see these bond yields rise once again as market valuations in stocks and bonds once again deflate.
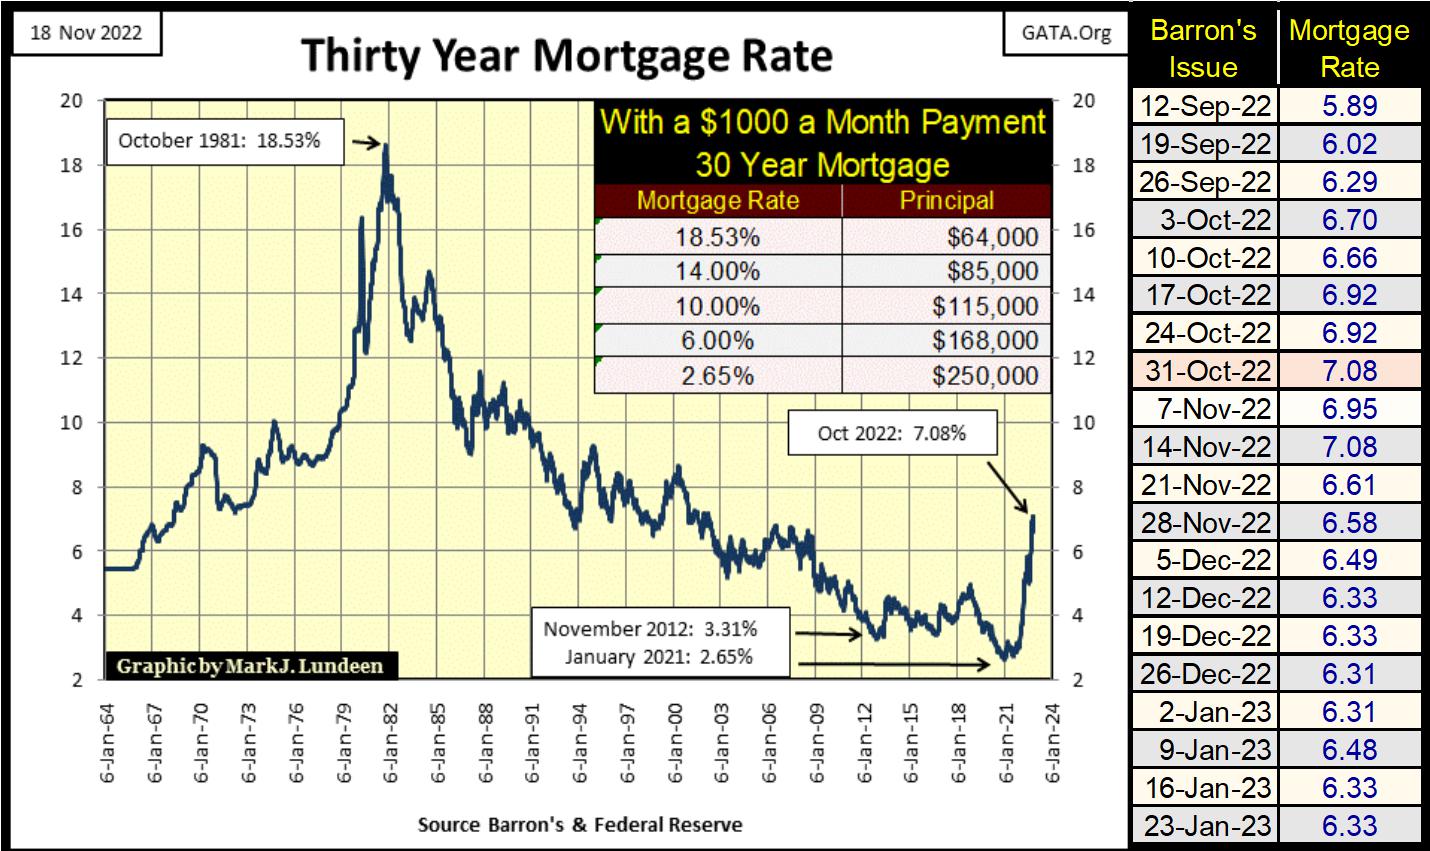
It’s not much discussed in the media, but real estate is in a bear market. I’m not surprised; mortgage rates have been rising for the past two years. As seen in the table below, when mortgage rates bottomed at 2.65% in January 2021, a thousand dollar a month payment could finance a mortgage of $250,000. With mortgage rates now over 6%, that is no longer so.
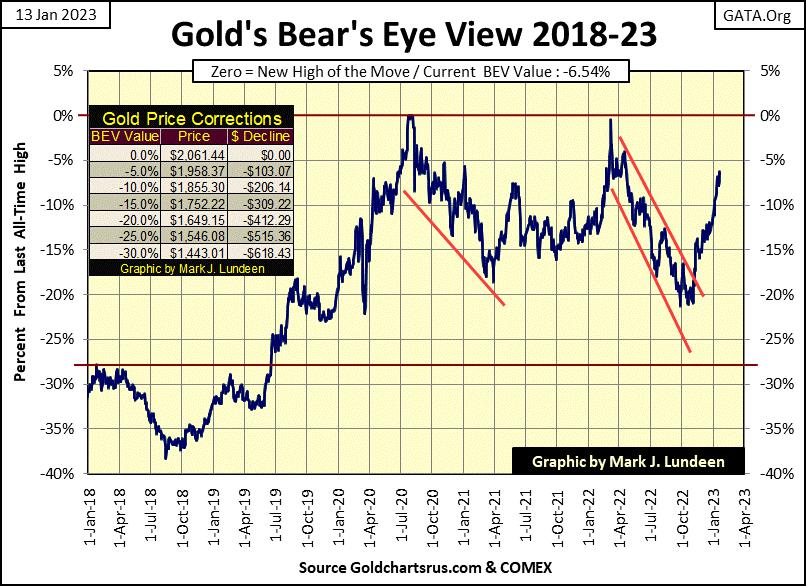
Let’s look at gold’s BEV chart. Gold’s advance off its lows of last autumn have been relentless. It’s up fifteen BEV points, with little to no correction in its advance. That is very unusual, but I can live with that, even should it continue acting oddly until gold sees a new all-time high without once looking back. I have problems in my life, but right now gold isn’t one of them.
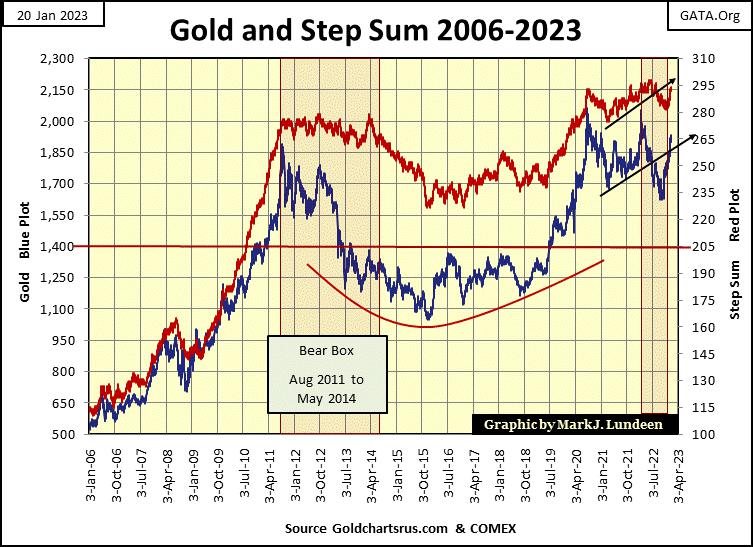
Looking at gold’s step sum chart below, we see both the price of gold (Blue Plot market reality) and its step sum (Red Plot market expectations) moving up, invalidating the bear box gold has been in since March of last year. Usually bear boxes resolve themselves by taking the price down to a bear market low, as you can see happened in the 2011 to 2015 bear box. But this time it’s looking different!
Gold’s step sum chart below is a strong indication that 2023 will be a very positive year for precious metal assets. This bear box invalidation may prove to be the beginning of another advance in the price of gold, as seen below from 2006 to 2011.
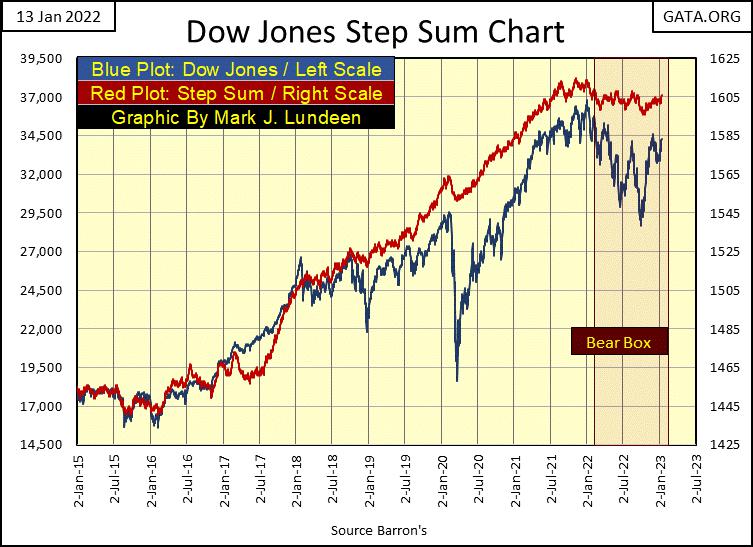
Sometime ago I prematurely said that the bear box for the Dow Jones was invalidated. At the time the Dow Jones was going up, but now its advancement is in question. Should the Dow Jones once again begin going down, and its step sum plot also turn down, it could be the beginning of some big problems in the market. QE#5 anyone?
In gold’s step sum table below, gold remains very overbought with a 15-count of +9 for the past five trading days. Markets don’t like being very overbought, so we should expect some down days in the week ahead of us. Still, with gold’s bear box above now behind us, who can say what is going to happen in the gold market? I just like seeing gold’s step sum rising with the price of gold.
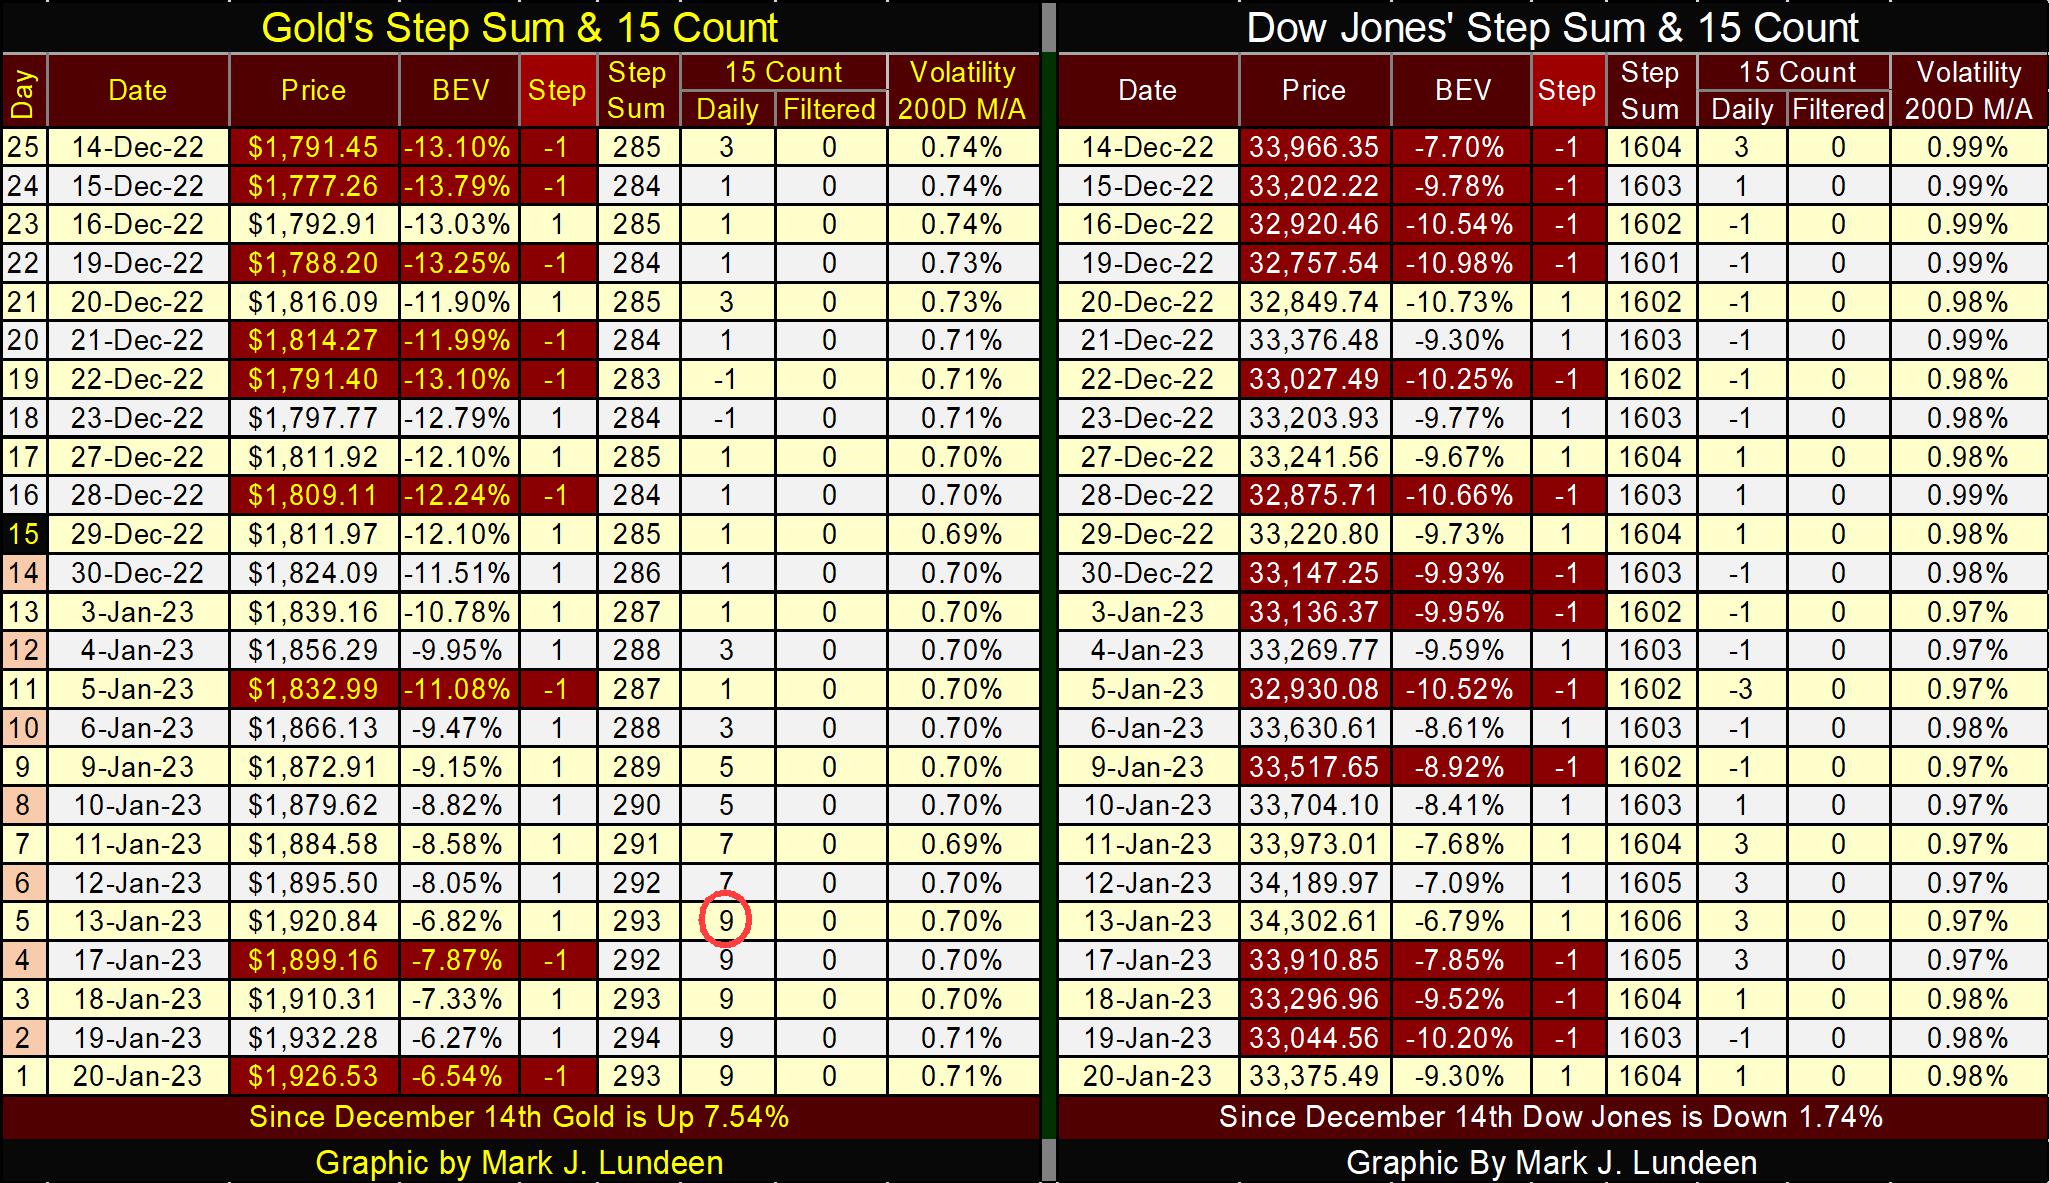
On the Dow Jones side of the table, note its step sum is unchanged since December 14th, to this week’s close; 1604. Yet the Dow Jones itself is down 1.74% since December 14th. This is the stuff of a bear box in progress, and that isn’t good for the bulls.
This week Eskay Mining had a press release that I thought was pretty good, but the market didn’t see it that way. So, I called Mac Balkam, Eskay’s CEO and asked him what he thought about it. Mac believes Eskay’s 2022 drilling program was a total success, a great season.
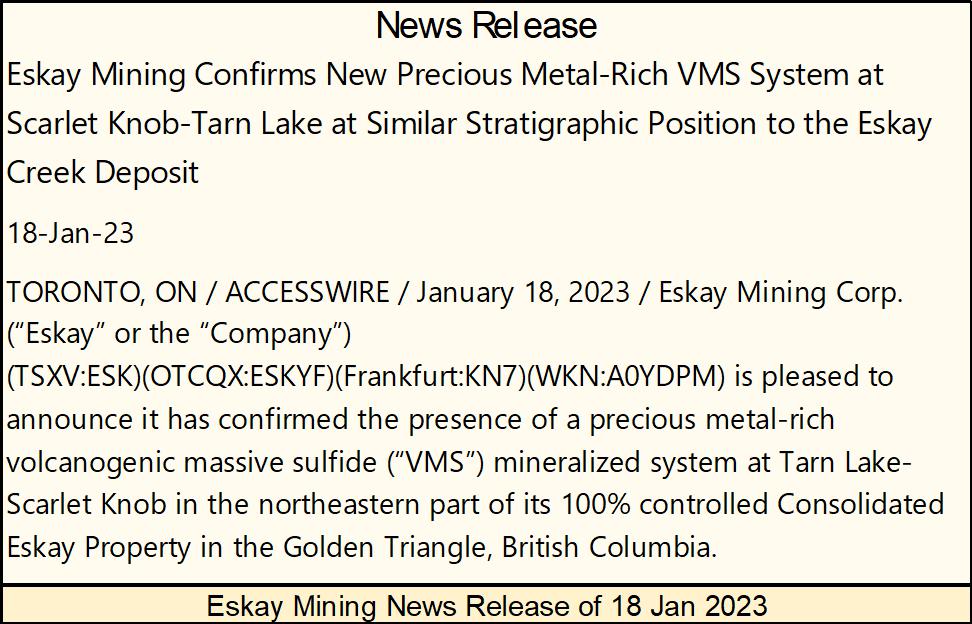
https://eskaymining.com/news/news-releases/eskay-mining-confirms-new-precious-metal-rich-vms-4916/
Mac was a little disappointed with their TV and Jeff’s core assays. Not that there was anything wrong with them, they both host gold and silver deposits. Mining companies frequently mine ore bodies with the gold and silver content being found at TV and Jeff. With more drilling, it’s very possible a bankable feasibility study could be made for each, and that is what is needed to proceed from an ore body to an ore body that is ready to be mined.
But the company’s focus is on discovering another Eskay Creek Deposit, a deposit that in the 1980s and 90s was the richest gold and silver mine in the world. And so far, the TV and Jeff targets have yet to live up to the company’s expectations.
I don’t expect the company will do any further drilling at TV and Jeff in 2023. There are other areas of Eskay Mining’s huge property the company’s geologists will want to work on. Still, TV and Jeff are precious metal assets the company holds, and that isn’t bad.
What has Eskay Mining’s attention are the results found this year at their Scarlet Knob & Tarn Lake targets. This is an area on Eskay Mining’s enormous property in the heart of British Columbia’s Golden Triangle, that has never had any previous exploration. The company is finding samples of ore very similar to what was mined at the Eskay Creek Mine, only seven kilometers away from this area. These bonanza grade ore samples have been found several hundreds of meters apart from each other. So, next year expect the company to focus their drilling program to see what is between, and around them.
Eskay Mining’s exploration work remains in its early stages. Eskay Mining has yet to find an ore body that can be mined. Somethings just take time. But what the company is looking for, they are finding, which makes me very excited for next summer’s drilling program.
It’s like what Admiral Farragut said at the Battle of Mobile Bay:
But Admiral Farragut had only to worry about the torpedoes. Eskay Mining has to wait until this season’s ice and snow on its property melts. Expect drilling to begin in June.
Mac holds a big position in Eskay Mining, with most of these shares purchased in the open market. He is a CEO with skin in this game. I also have a large position in the company, and neither of us plan to sell any shares in the current market. Though I may have to sell some for living expenses, and maybe to sniff a rose or two in the months to come.
Eskay Mining closed the week at US$0.71. I believe current prices are very attractive.
Mark J. Lundeen
*********


