Gold Stocks Are On A Tear…But A Rest Period Is In Order


Merv’s Gold and Silver 100 Index of 100 gold and silver stocks was up over 10% this past week. That’s an average increase of over 10% for all the stocks in the Index. However, the widely followed PHLX Gold/Silver Index was up 14.8% on the week. A review of the performances of the component stocks of both Indices confirms one important point. The primary movers have been the larger “quality” gold and silver stocks with the secondary quality stocks lagging behind. When speculators REALLY have trust that a real good bull market is on its way they gravitate to the secondary stocks where the major percentage gains will be made. Although the action so far is bullish, that major belief that the bull is really here has not yet taken hold.
WEEKLY GOLD SUMMARY
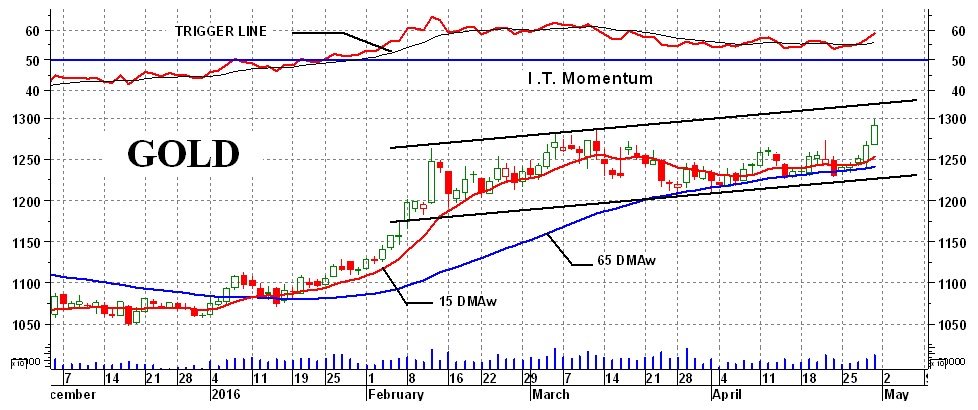
LONG-TERM
No use wasting too much time on the long term. Everything here is positive with the gold price well above its long-term positive sloping moving average line and the momentum indicator is in its positive zone above a positive trigger line. The long-term rating can only remain BULLISH at this time. Of the 100 stocks in my Index 97% are positive while 3% are negative this week. Too, too bullish for my taste. No room for advancement.
INTERMEDIATE-TERM
The chart gives us the basic intermediate term information. The gold price is moving upwards at a very good clip and is now above its previous recovery highs. The moving average continues to point upwards as confirmation of the price advance. The IT momentum indicator remains in its positive zone and is above its positive trigger line. So, from these basic indicators all is well. However, there are some things to keep an eye on. The previous potential Head and Shoulder pattern is no more with the price now above its previous head. This is a good example to not get ahead of one’s self when it looked like a developed pattern. I like confirmation before calling it.
With the H&S pattern no longer effective we are back to a gently upward sloping “box” pattern. What this now suggests is that there may not be many more days like the last two before the price starts to butt up against that upper resistance line. This upper line is not that serious of a resistance. Prices go up and down as a normal occurrence so even if the price reacts from this resistance such reaction, at this time, may be short lived. More serious than this “box” pattern is the momentum indicator. Although the price has hit a new recovery high the momentum indicator is lagging where it was during the previous highs. This is referred to as a negative divergence and until it is corrected by the momentum moving into new high ground it is a concern. This will have to be watched carefully. The March negative divergence versus February resulted in the short-term price reaction of March/April. We might see the same type of action again soon, but it needs confirmation.
For now, the intermediate term is rated as BULLISH. Of the 100 stocks, 94% are positive while 3% are negative. Again, too bullish with very little room for advancement.
SHORT-TERM
Now THAT was close. The short-term was just about to give us a negative signal but then turned around and smartened up. The price is once more above its positive sloping moving average line and the momentum indicator remains in its positive zone above a positive trigger line. The only caution is the fact that the momentum is under performing versus its previous performance when the price made its highs in February and March. These negative performances, or divergences, are not signals, yet, but are something to keep in mind and be on alert.
For now the short term rating is back to BULLISH. As for the POS/NEG performance of the overall 100 stocks in my Index, we have 90% positive and 4% negative. In all cases the left over percentage (in this case 6%) are due to some stocks with neutral ratings.
MERV’S GOLD & SILVER 100 INDEX
The chart of the Merv’s Gold & Silver 100 Index is a weekly chart and this one dates back to the top in 2011. The Index was started back in 1993 with a value of 10 so despite three severe bear markets along the way it is still some 3400 % ahead of the game. Not a bad feat for an average price of 100 stocks.
The weekly charts are best used for determining long term trends and less for intermediate term. We have several features on this chart which should be of interest. The most prominent feature is the several year down trend along with a two and a half year support giving us a very good downward sloping (bullish) wedge pattern. The upside break through that long term down trend line was the start of a very strong bull move in these stocks. This occurred at about the same time as the Index broke above its LT moving average line with the line suddenly turning to the up side.
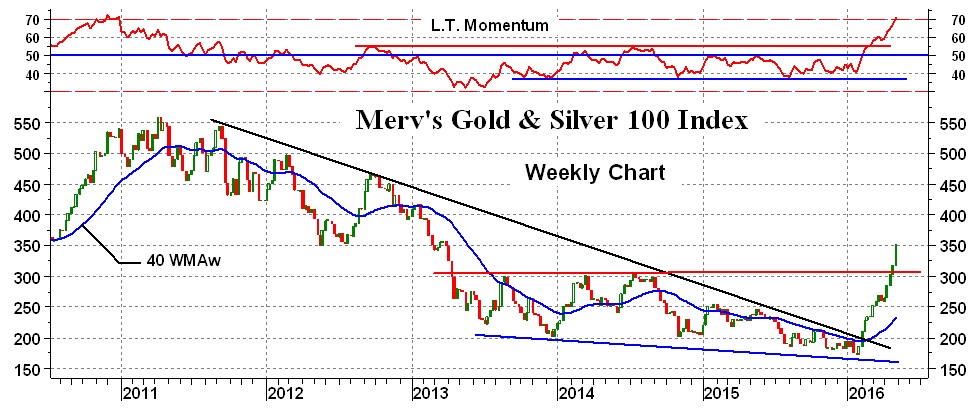
A final quick feature of the price chart is that resistance level (Red horizontal line) going back three years. The Index has made a decisive upside break through this resistance going into new three year highs.
As for the momentum, it has been in a basic lateral trend for the past four years but at a slightly negative value. It broke on the up side along with the Index and is now almost at the level where it came to a halt back at the end of 2010. A sharp upside move such as we have had in the indicator (and Index) cannot continue. At some point the sharp rise must come to a halt and take a rest or at the minimum, a short reaction. I think we are almost at that point with these stocks. Now is a dangerous time to be thinking of jumping in, although it all depends upon an individual stock performance as opposed to the overall Index in general.
********
Readers are invited to view my Facebook page at https://facebook.com/merv.burak where I will be slowly posting commentaries explaining in more detail my various indicators and techniques. I also present from time to time some individual stocks that look as if they may be good speculations. However, nothing I post is meant to be a recommendation to buy or sell. One should check with their broker or investment advisor before acting.
 Merv is a retired Aerospace Engineering consultant. He is also a retired market technician with over 40 years of market experience and research. Merv received his certification as a Chartered Market Technician (CMT) in 1992. Developer of many technical techniques and programs which he has been using in his previous Technically Speaking with Wil-Arm and Technically Precious with Merv commentaries posted throughout the globe. Developer of several gold and silver Indices, Merv continues to update his Merv’s Gold & Silver 100 Index and Merv’s Penny Arcade 50 Index and reviews them during his periodic on-going Technically Precious commentaries.
More from Gold-Eagle


