Gold Stocks Now?


You know the monetary drill:
- Commercial bankers and central bankers create more digital dollars from nothing, inject them into the economy, dollars devalue and prices rise. They issue press releases claiming they are doing a great job.
- Commercial and global central bankers are counterfeiting (legally). This benefits the financial and political elite. Don’t expect this nonsense to change.
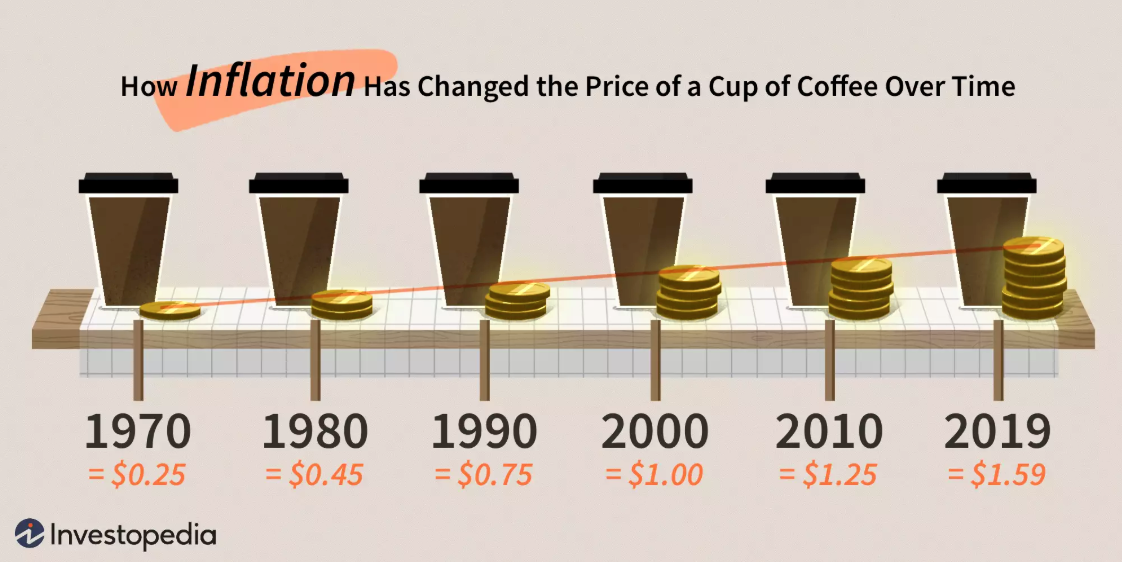
- Prices for stocks, food, consumer goods and gold rise as dollars buy less.
- Inflation statistics (official) are “managed” to show minimal inflation. Check out the Chapwood Index.
- Newly created dollars and inexpensive debt levitate the stock and bond markets. Gold and silver prices languish, eventually surge higher, crash and languish again. Russia and China buy gold every month while the West descends deeper into debt.
- Multi-year cycles show investor preference for stocks versus commodities. Stocks are strong for years, the cycle reverses and commodities rise. Politicians seek scapegoats when food and energy prices skyrocket.
- Commercial bankers and central bankers create more digital dollars to “paper-over” their monetary mess.
- Politicians seldom question how creating more debt will correct excessive debt problems.
- And the game continues.
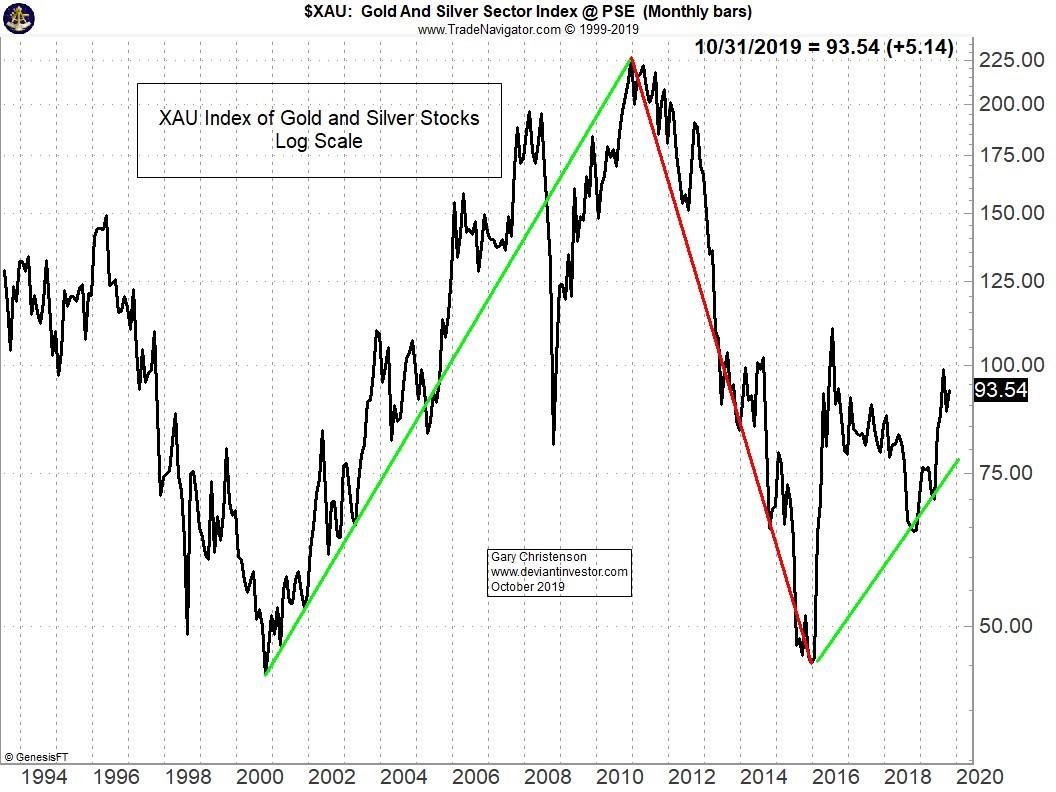
WHAT ABOUT GOLD PRICES? Rising!

WHAT ABOUT GOLD STOCKS—THE XAU INDEX? Rising since 2016.
COMMENTARY
These charts show:
- Gold prices rise and fall for years but inevitably increase as dollars are devalued. Gold in 2019 sells for $1,500. It sold for $35 in the 1960s.
- Prices for gold stocks were hammered lower after December 2010. Their low occurred in December 2015. The XAU has doubled since that low.
WHAT ABOUT THE RATIO OF THE XAU TO GOLD? How strong are gold and silver stocks compared to their underlying products—gold and silver?
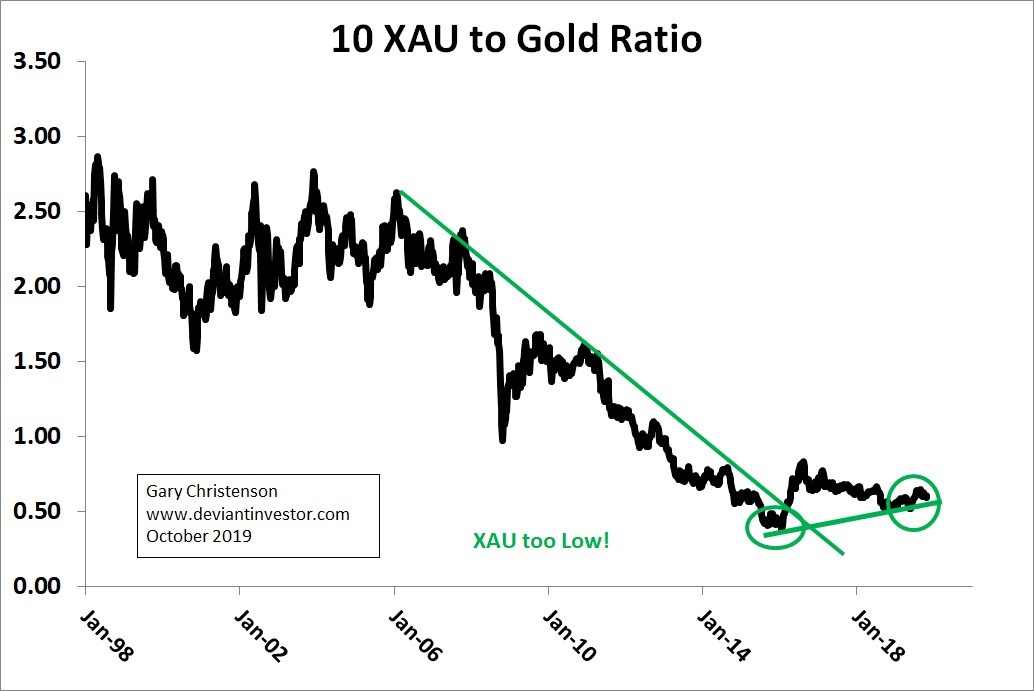
Compared to gold, the XAU/gold ratio has fallen hard since 2006, bottomed in January 2016, and is higher in October 2019.
SO WHAT?
Gold will sell much higher in coming years. Read Gold Prices – The Next 5 Years
You don’t believe it? Ask yourself:
- How many congressmen want to restrict spending and balance the budget?
- Which presidents have curtailed spending on military contractors, the health care cartel and social programs?
- Why has the national debt risen from $1 trillion in 1981 to over $22 trillion in 2019?
- Have politicians or bankers shown any interest in responsible spending or restoring honest money?
Conclusion: Gold and silver prices will rise much higher in coming years. Gold and silver stocks, as measured by the XAU, should rise far more rapidly than metals prices.
Gold prices will rise from $1,500 in 2019 to $3,000 ($5,000 or $10,000 or $xx,xxx) during the next decade. Assume the XAU to gold ratio rises by a factor of five, back to its 1998—2006 levels. Then the XAU, 93 in late October, could rise to 1,000 to 3,000. We’ll wait to see how crazy gold stock prices become.
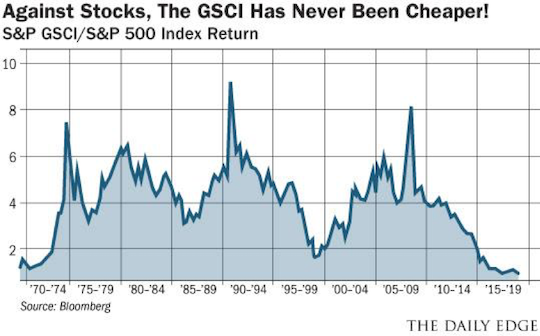
WHAT ABOUT OTHER COMMODITIES?
Compared to the S&P500 Index, the GSCI (commodity index) is at five-decade lows. The ratio has not been this low since 1971. After 1971, gold rose from $40 to over $800 by January 1980. A similar factor of 20 rise in the price of gold would move it to $30,000 – a crazy number.
A world where gold sells at $30,000 would differ greatly from today. Politicians and central bankers would blame others for the hyperinflation and suffering they created. The inflationary trauma and human misery would be huge. We hope sanity returns before the-powers-that-be create hyperinflation, social unrest, economic collapse and more…

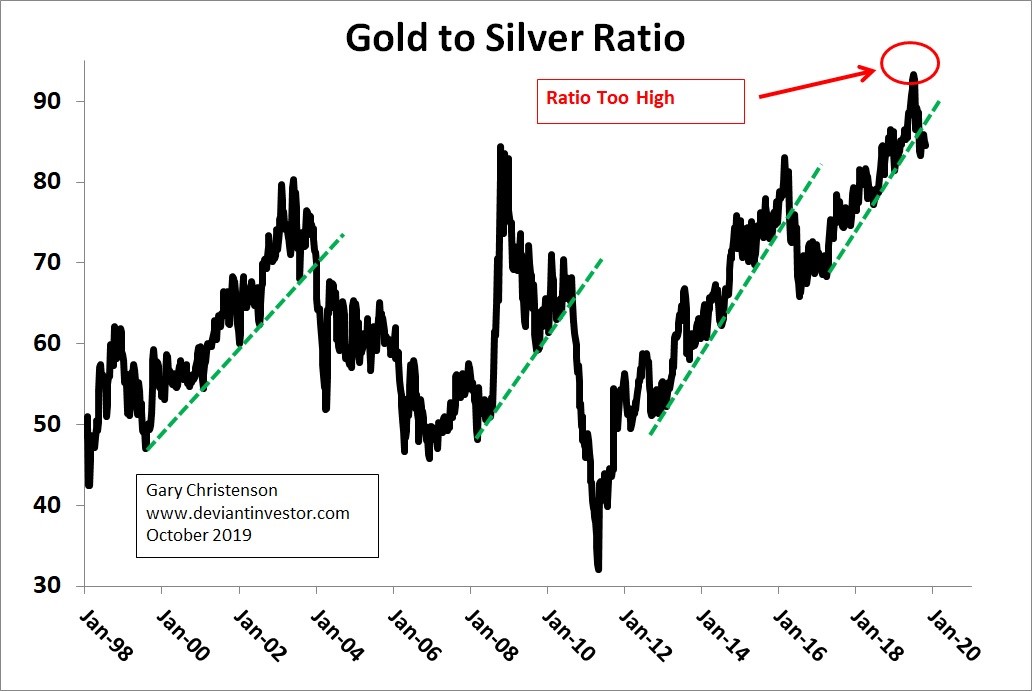
REVISITING THE GOLD TO SILVER RATIO
The ratio shows how many ounces of silver are needed to purchase one ounce of gold. Historically the ratio has been 10 to 20. The ratio has averaged 50 – 60 for many decades. In mid-2019 the ratio peaked over 93.
When gold prices rise, silver prices rise faster and the ratio declines. When gold prices fall, silver prices fall further, and the ratio rises. The ratio fell through support lines (see below) in early 2004, mid-2010, mid-2016, and September 2019. These were buy signals for gold and especially for silver.
Date Ratio Silver Price % Rise in Silver Price
2004 70 $5.95 250%
2010 65 $18.10 170%
2016 76 $16.30 25%
2019 86 $17.60 ???%
Expect gold prices to rise for several years as central bankers, commercial bankers and politicians promote QE4ever, zero or negative interest rates, QE to infinity, “shovel ready” boondoggles, expanded wars, more social programs, and pension fund bailouts.
Gold prices will rise, and silver prices will jump higher. Gold prices should double, or more, in a few years. Silver prices should rise by at least a factor of four.
How high will metals prices rise? It depends upon how many $trillions QE4ever will create and how much the dollar will devalue.
Rather than guess about the trainload of monetary nonsense coming our way, prepare by “insuring” your savings and retirement with silver and gold.
Our fiscal, monetary and central banking problems are huge. Perhaps they are unfixable without a major reset.
Call Miles Franklin at 1-800-822-8080 to discuss precious metals “insurance” with them.
Gary Christenson
The Deviant Investor
********
 Gary Christenson is the owner and writer for the popular and contrarian investment site Deviant Investor and the author of the book, “Gold Value and Gold Prices 1971 – 2021.” He is a retired accountant and business manager with 30 years of experience studying markets, investing, and trading. He writes about investing, gold, silver, the economy and central banking.


