Gold: What Should We Expect Given The Ongoing Conflict?


As history shows, gold and silver rallies based on geopolitical tensions are often short-lived. Yesterday, a hint of a trend reversal appeared.
Don’t stop reading this mining stock analysis until you get to the part about junior mining stocks’ analogy. Something might interest you there.
While the unfortunate conflict confronting Russia and Ukraine has intensified in recent days, gold, silver, and mining stocks have benefited from the crisis. However, since history shows that geopolitical-tension-based rallies often reverse, Feb. 24 was likely a small indication of what should unfold over the next few months.
For example, gold’s sharp rally turned into a sharp intraday reversal on Feb. 24. While the S&P 500, the NASDAQ Composite, the S&P 500, and gold managed to end the session in the green, the GDX ETF declined by 1.93%.
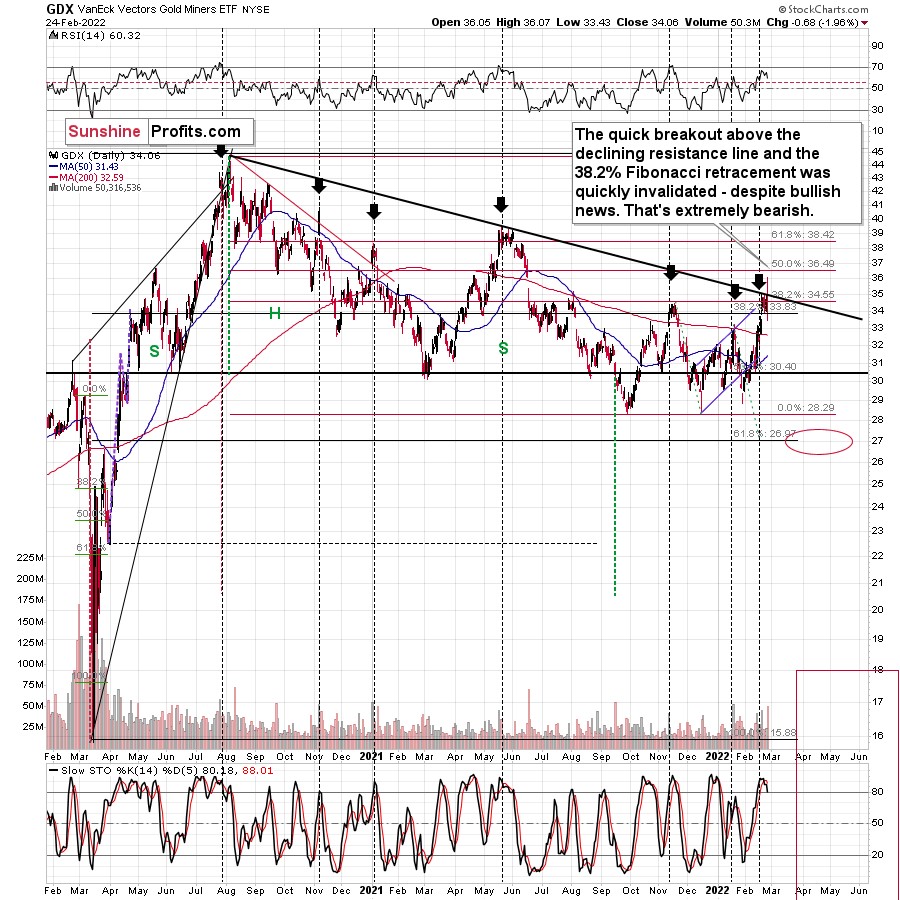
Furthermore, after the gold and silver senior miners rallied above their medium-term declining resistance line (the downward sloping black line in the middle of the chart below), the intraday reversal invalidated the breakout and it occurred on significant volume.
At the same time, senior mining stocks invalidated their attempt to break above their 38.2% Fibonacci retracement. That’s yet another bearish sign.
This means that the GDX ETF’s medium-term downtrend remains intact, and that the short-term concern-based rally may have just ended.
To that point, the HUI Index provides clues from a longer-term perspective. When we analyze the weekly chart, the current short-term move higher is in tune with the previous patterns, but history is not repeating itself to the letter.
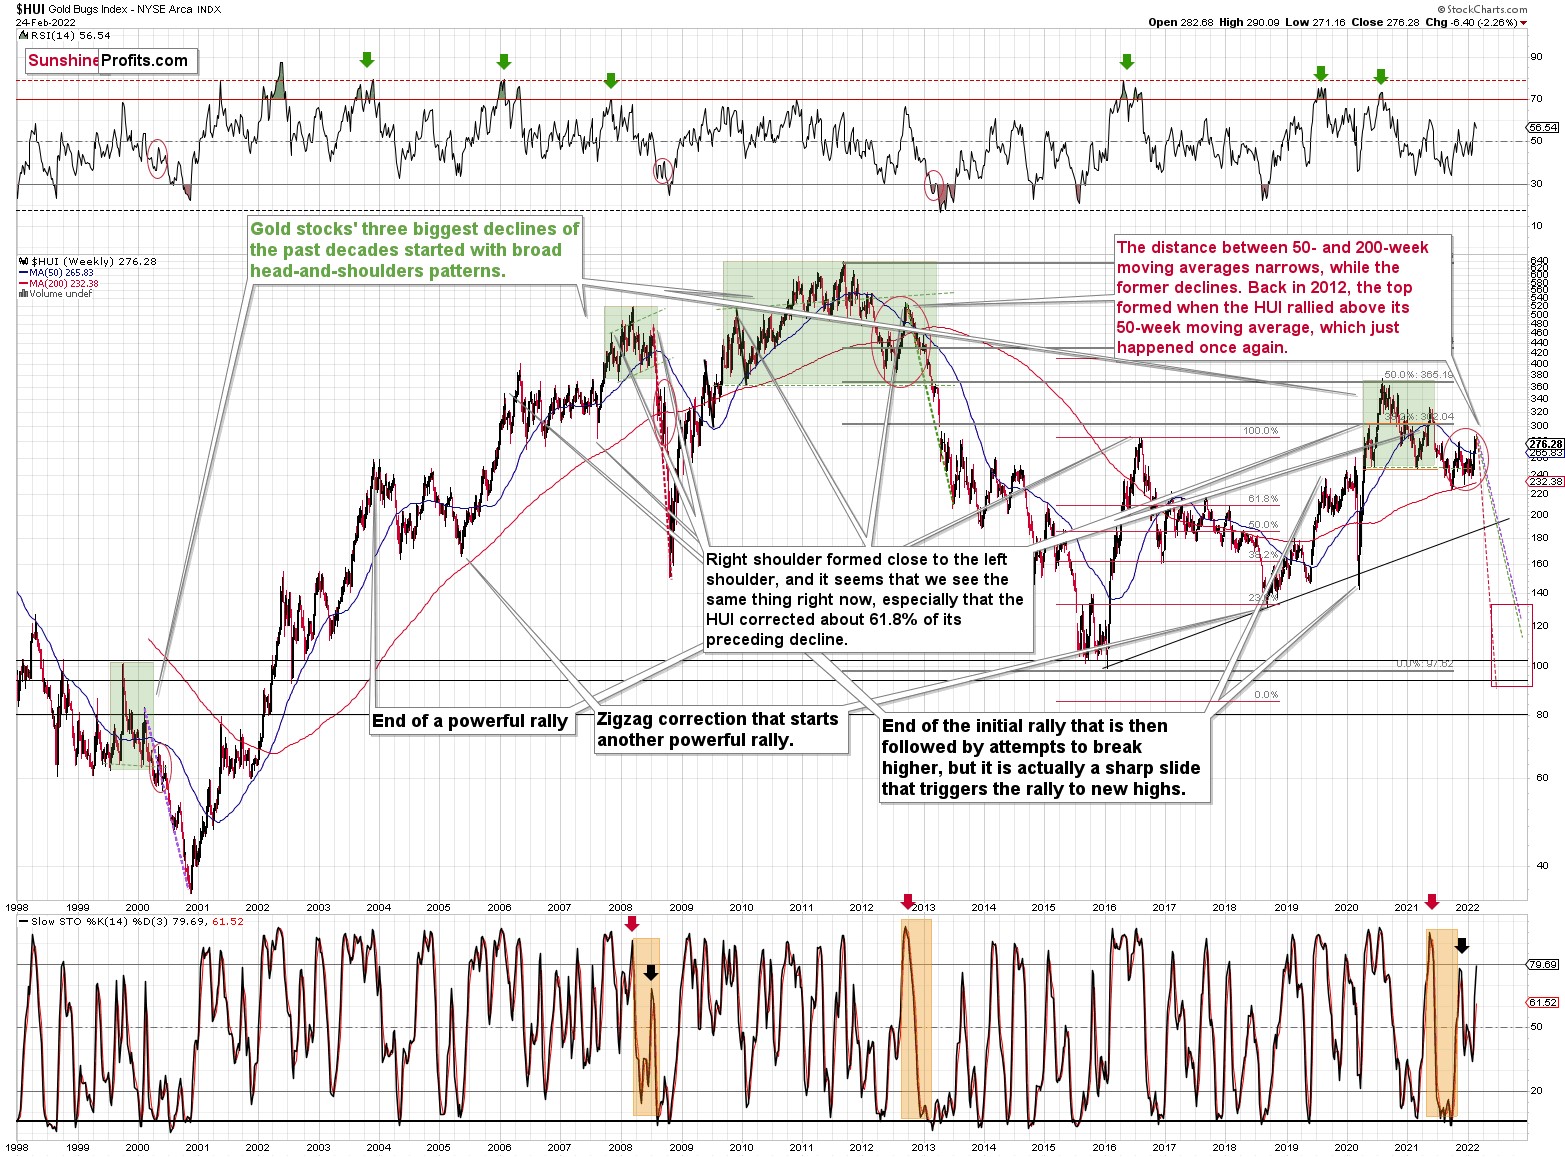
The three previous cases that I marked with green were not identical, but quite similar in terms as they were all some sort of a broad head-and-shoulders pattern.
Now, this pattern can have more than two “shoulders”. It’s not that common, but it happens. It seems that what we saw recently (I mean the late-2021 – Feb. 2022 rally) could be viewed as either a part of a big post-pattern consolidation, or another right shoulder of the pattern.
Based on how broad the pattern is and self-similarity present in gold, it seems that the analogy to what happened in 2012 is most important right now.
Looking at the moving averages, we see that the 50-week moving average (blue) and 200-week moving average (red) performed quite specifically in late 2012, and we see the same thing this year.
The distance between 50- and 200-week moving averages currently narrows, while the former declines. Back in 2012, the top formed when the HUI rallied above its 50-week moving average, which just happened once again.
Still, if the general stock market slides, and that appears likely for the following weeks and months, then we might have a decline that’s actually similar to what happened in 2008. Back then, gold stocks declined profoundly, and they have done so very quickly.
The dashed lines that start from the recent prices are copy-paste versions of the previous declines that started from the final medium-term tops. If the decline is as sharp and as big as what we saw in 2008, gold stocks would be likely to decline sharply, slightly below their 2016 low. If the decline is more moderate, then they could decline “only” to 120 - 140 or so. Either way, the implications are very, very, very bearish for the following weeks.
Turning to the junior miners, the GDXJ ETF tried to break out above a lower declining resistance line (the downward-sloping blue line drawn from the mid-2021 and late-2021 highs below). However, the attempt was rejected and culminated with a sharp intraday reversal. Moreover, the junior miners’ relative weakness was on full display, as despite the green lights flashing for the general stock market, gold, and silver, the GDXJ ETF ended the Feb. 24 session down by 2.28%.
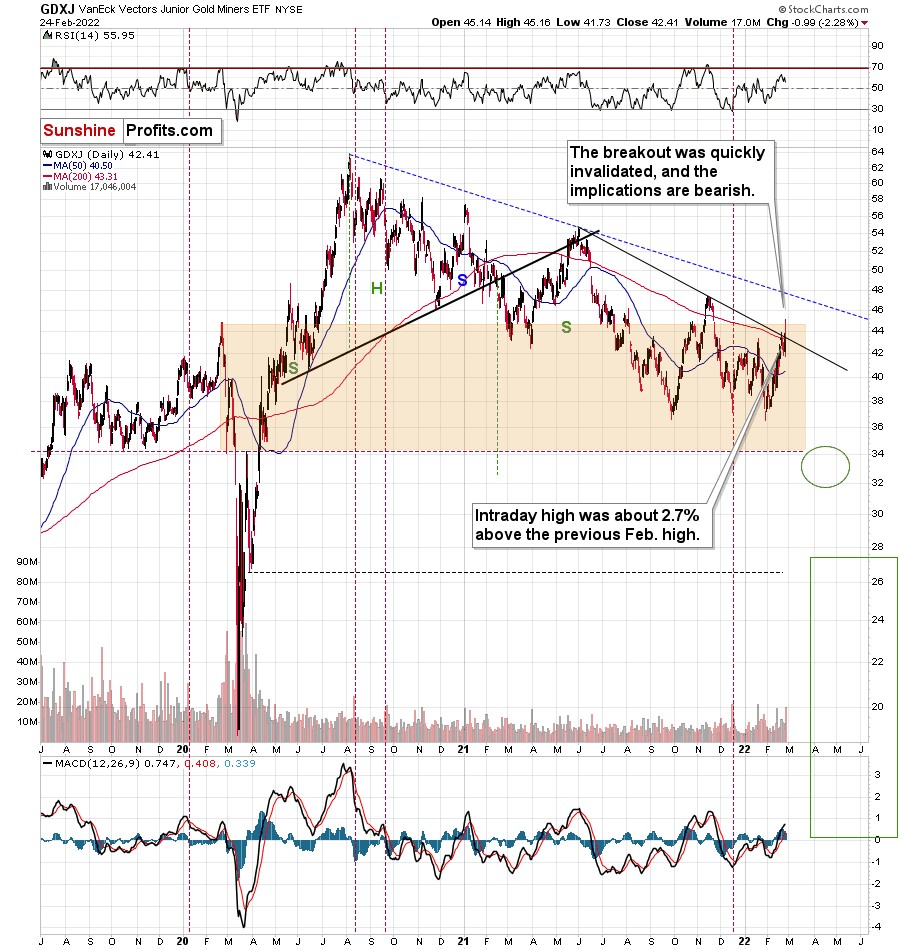
In addition, please note that the bearish about-face occurred on strong volume, and the move mirrored the sharp spike that preceded the March 2020 plunge.
Please note that while junior miners invalidated their breakout above the declining resistance line, similarly to GDX, it was not the analogous line. The line that’s analogous to the one on the previous GDX chart is the blue, dashed line. GDXJ was not even close to it.
In other words, junior miners are underperforming seniors, just like what I’ve been expecting to see for months. The trend in the ratio between them is clear too.
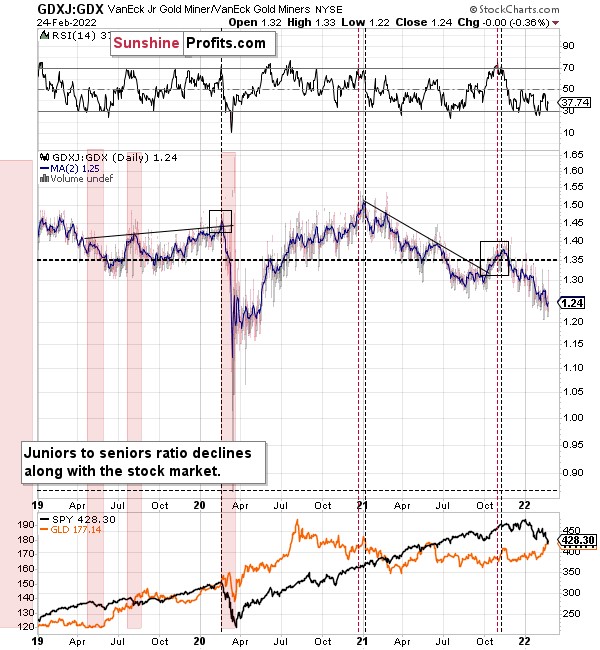
Once again (just like in 2020), junior miners are likely to decline more than seniors, providing a greater shorting opportunity for truly epic profits.
Let’s get back to the previous chart for a moment, and let’s expand on the “just like in 2020” analogy.
Buckle-up, Alice, because the ride down the similarity rabbit hole is going to be a wild one.
Here it goes:
- The early-2020 top in the GDXJ formed after a sharp short-term rally.
- The early-2020 top in the GDXJ formed when GDXJ opened much higher, declined on an intraday basis, and ended the day lower.
- The early-2020 top in the GDXJ formed at $44.85, on significant volume.
- When the GDXJ topped in early-2020, its 50-day moving average was at about $40, and the MACD indicator was at about 1.
Now, let’s consider what happened yesterday.
- This week’s top in the GDXJ formed after a sharp short-term rally.
- This week’s top in the GDXJ formed when GDXJ opened much higher, but declined on the intraday basis, and ended the day lower.
- This week’s top in the GDXJ formed at $45.16 (just 0.7% higher than in early-2020), on significant volume.
- When the GDXJ topped this week, its 50-day moving average was at about $40 ($40.50), the MACD indicator was at about 1 (0.747).
If you think that’s extremely similar, you’re right. However, I saved the best for last:
The early-2020 top formed on February 24.
Yesterday WAS February 24.
Does this guarantee a slide like in 2020 in the junior miners? Of course not, there are no guarantees in any market, but does that make it even more likely? Yes, it does. Is it an epic opportunity for those who position themselves correctly? Again, I can’t make any promises or guarantees, but that’s what seems likely to me.
All in all, a crash below $20 is not out of the question. In the meantime, though, I expect the GDXJ ETF to challenge the $32 to $34 range. However, this is my expectation for a short-term bottom only. While the GDXJ ETF may record a corrective upswing at this level, the downtrend should continue thereafter, and the junior miners should fall further over the medium term.
In conclusion, the unfortunate situation unfolding in Ukraine is important, from a humanitarian perspective, and I hope that a peaceful resolution materializes. Also, it is my responsibility to analyze the situation and report it to you how it’s likely to impact the markets and what it implies for one’s trading positions. What’s justified from the risk-to-reward point of view and what’s not. While gold, silver, and mining stocks benefited from geopolitical tensions, history shows that such gains are short-lived. As a result, I still expect the trio to hit lower lows over the medium term, and I think that the decline will not be subtle.
Thank you for reading our free analysis today. Please note that the above is just a small fraction of today’s all-encompassing Gold & Silver Trading Alert. The latter includes multiple premium details such as the targets for gold and mining stocks that could be reached in the next few weeks. If you’d like to read those premium details, we have good news for you. As soon as you sign up for our free gold newsletter, you’ll get a free 7-day no-obligation trial access to our premium Gold & Silver Trading Alerts. It’s really free – sign up today.
Przemyslaw Radomski, CFA
Founder, Editor-in-chief
Sunshine Profits: Effective Investment through Diligence & Care
* * * * *
All essays, research and information found above represent analyses and opinions of Przemyslaw Radomski, CFA and Sunshine Profits' associates only. As such, it may prove wrong and be subject to change without notice. Opinions and analyses are based on data available to authors of respective essays at the time of writing. Although the information provided above is based on careful research and sources that are deemed to be accurate, Przemyslaw Radomski, CFA and his associates do not guarantee the accuracy or thoroughness of the data or information reported. The opinions published above are neither an offer nor a recommendation to purchase or sell any securities. Mr. Radomski is not a Registered Securities Advisor. By reading Przemyslaw Radomski's, CFA reports you fully agree that he will not be held responsible or liable for any decisions you make regarding any information provided in these reports. Investing, trading and speculation in any financial markets may involve high risk of loss. Przemyslaw Radomski, CFA, Sunshine Profits' employees and affiliates as well as members of their families may have a short or long position in any securities, including those mentioned in any of the reports or essays, and may make additional purchases and/or sales of those securities without notice.
********
 Przemyslaw Radomski, CFA, is the founder, owner and the main editor of SunshineProfits.com. You can reach Przemyslaw at: http://www.sunshineprofits.com/help/contact-us/.


