GoldCore Quarterly Review
 share
share
 share
share
 share
share
 share
share
 share
share
Gold in Q3: USD -4.5%, EUR -2.4%, GBP +1.5%, CHF +2.4%, CAD +4.6%
– Stocks face worst quarter since 2011 over fears for global economy
– Global economy concern as China slows down sharply
– Concern over Federal Reserve stewardship
– Increasing nervousness over U.S. earnings outlook
– Stock markets of the world’s ten largest economies are currently in red
– Gold rose 1.5% in GBP, 2.4% in Swiss franc and 4.6% in Canadian dollar
– Gold down 4.5% in USD while global stocks fall 5% to 13%
– Stocks remain overvalued and still opportunity to re-balance into gold
After the China Tremors of July-August, September rolled in with a roar of a veritable Bear.
On a quarterly basis, the S&P500 was down 8.2 percent, DJIA fell more than 8.7 percent and EuroStoxx 50 shed 12.9 percent. Only longer dated (5 years-plus) U.S. bonds and Japanese Yen have managed to wrestle out quarterly returns in excess of 1 percent.
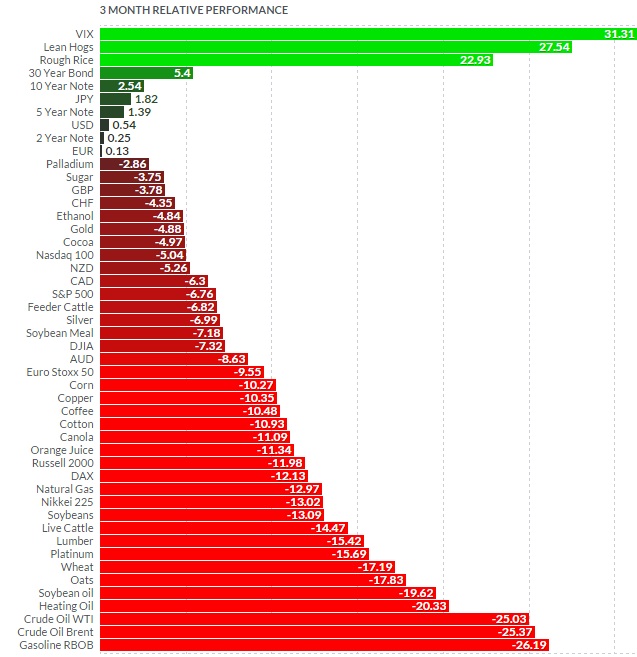
3-month Relative Performance [click to expand]
Source: Finviz.com
Meanwhile, the CBOE Volatility Index (VIX), a popular measure of the implied volatility of S&P 500 index options, jumped 38.4 percent compared to the start of July. Risk aversion once again became a major strategy play in 3Q.
The core drivers for the changed risk sentiment are global themes.
China – at the front of the financial news flow – continued to post weakening macroeconomic data. August marked an outright collapse in Composite PMI, down to 48.8 from 50.8 in July, marking the fastest contraction of output since February 2009. September manufacturing PMI came in at a miserably low 47.2, with Composite PMI falling to 48.0 signaling a rapid rate of economic growth deterioration for the second month in a row.
Chinese economy’s woes, however, are far from being contained. Ongoing deleveraging in the markets – cutting margin loans volumes, unwinding carry trades (including across broader Asian markets), and closing off risk-parity positions – all saw Shanghai Composite Index falling from the peak of 5,166 in mid-June to 3,038 at the end of September. As of September 29, total margin debt in Chinese stock makers stood at CNY921 billion, down more than 50 percent on peak attained in June (chart), but still well ahead of 3Q 2014 levels.
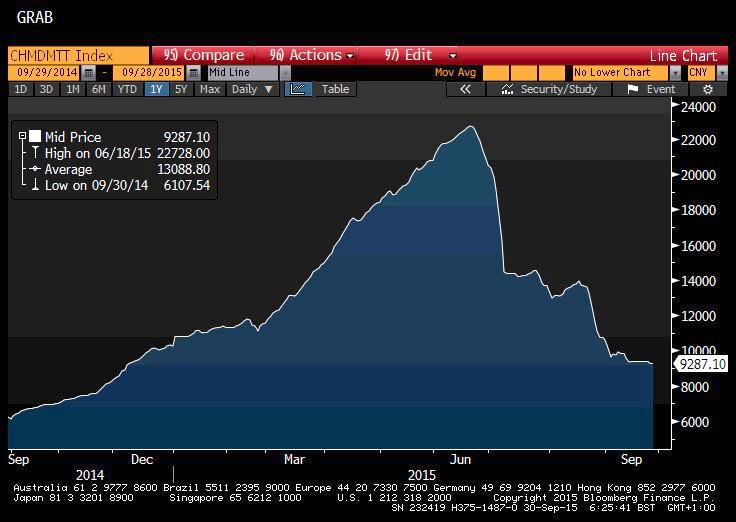
Chart: Index of Chinese Margin Debt [Click to expand]
Source: Bloomberg
The same factors also caused major ripples across the globe because Chinese economic problems, in part, reflect a global growth slowdown.
The latest IMF economic outlook, published this week, shows sharp deterioration in growth across all emerging economies (EMs). Worse, growth prospects are also becoming more volatile.
Between 2012 and 2013, the emerging economies posted annual GDP growth, on average, only 0.25 percentage points below prior consensus forecasts. This year, per IMF estimates, the gap is going to be more than four-fold.
Most current composite PMIs for August-September for BRIC economies shows weak conditions across three out of four largest Emerging Markets, with downward trend persisting since June 2014 and weak growth conditions remaining in place since the end of 1Q 2013 (see chart).

BRIC Composite Economic Activity Weighted by World Shares of GDP (PPP-adjusted)
Source: Dr Gurdgiev own calculations based on data from Markit.
In mid-September, OECD also lowered its forecasts for the global economy for both 2015 (from 3.1% forecast at the end of 2Q 2015 to 3% at the end of 3Q 2015) and 2016 (from 3.8% to 3.6%, respectively). This marked second consecutive quarter of growth downgrades from the Paris-based body.
In line with these developments, the stock markets of the world’s ten largest economies are currently in the red, from Japan to Brazil, from New York to Moscow.
However, even with the recent corrections, stocks remain heavily overpriced by historical comparatives. MSCI World ex-financials EV/EBITDA ratio has peaked at historical highs in 1Q 2015 and declined since then, but the figures still indicate markets pricing close to 2001 dot.com bubble levels.
And corporate debt is rising fast, despite severe pressures on lower-rated junk bonds, just as the risk quality of corporate credit is falling.
Kamakura Troubled Companies Index – a measure of default risks in global corporate debt markets – has hit it highest level in five and a half years back at the end of August. Debt-fuelled M&A activities and shares buy-backs are at or near all-time highs, as corporate boards around the world are staying sold on the idea that debt will remain cheap over the medium term.
In the world of Global ZIRP, neither sales, nor earnings, nor profits matter, as leverage plays, once again, a role of the king.
Q3 2015 consensus forecast for S&P500 earnings outlook is currently indicating a -3.9 percent contraction in earnings compared to 3Q 2014, based on Thomson Reuters data. Beyond 3Q 2015, rolling 12-month forward forecast for EPS (earnings per share) is close to negative 2 percent, the lowest since late 2009.
Last, but not least, we are in the midst of a historically severe commodities crash that exacerbates markets woes. The key culprit in this process is financialisation of commodities and the cyclical nature of leverage.
All of the above factors have led to a significant spike in risk aversion. September saw VIX rising 81 percent year-on-year on a monthly average basis, following an increase of 44 percent in August. Average daily volatility in VIX rose 81 percent year-on-year in August and by 41 percent in September.
From the broader markets point of view, 4.3 percent quarterly decline in gold prices over 3Q 2015 offers a generally less negative performance than majority of other investment instruments.
Against the headwinds of margin calls and leverage drying up in the financial markets, especially in emerging markets, gold downside was controlled by the elevated markets volatility, rising risk aversion of investors and its function as a hedge against currency debasement.
Directionally, quarter-on-quarter gold prices moved largely in line with currency valuations. Not surprisingly, gold fell 4.1 percent (on a quarterly data basis) in U.S. dollar terms, 2.4 percent in Euro terms and 3.3 percent in Yen.
Gold rose 1.5 percent in pound sterling, 2.4 percent in Swiss franc and 4.6 percent in Canadian dollar.
All of which simply confirms the defensive nature of gold as a longer-term hedge against core risks.
Beyond physical demand and supply imbalances, mounting uncertainty over the timing and scale of the U.S. Fed rate hike is driving short-term volatility in gold prices.
Despite what we often hear from the media, given the unprecedented nature of recent monetary policy ‘innovations’ deployed by the Central Banks around the world, there is simply no reasonable way of predicting how gold and other commodities prices will react to changes in the U.S. rates. Which means that markets nervousness about the impact of the Fed move (and, subsequently, monetary tightening by other Central Banks) is here to stay.
This suggests that in the short run, downward pressures on gold prices are unlikely to be abating.
Perhaps surprisingly, the latter is the good news for non-speculative investors. Taking a longer horizon (life-cycle of investment portfolio) view suggests that investors should take the present period of downward re-pricing of gold as an opportunity to review their portfolios to ensure a strong balancing across various asset classes, reflective of longer-term risks.
Janet Yellen (Reuters)
The data since the official end of the Great Recession has been consistently signaling a high probability of an on-set of the so-called secular stagnation – a longer-term period of structurally lower global growth. Added short-term risks imply building imbalances in the financial and monetary systems.
The twin combination of elevated short-term risks and long-term slower growth raises the importance of diversification in investment portfolios, including diversification into gold.
In this setting, investors looking to build defensive wealth preservation strategies should stay long gold, down-weight speculative grade financial assets, including financially instrumented commodities and low quality debt. All investors will also do well – in risk management terms – to avoid leverage and equity in debt-heavy companies.
For those who have been avoiding gold in their portfolios, there is now a chance to review their allocations.
As usual, gradually diversifying holdings to all key asset classes, including gold bullion, while carefully balancing costs and risks associated with holding different instruments is the best approach to long term wealth management.
********
Courtesy of www.GoldCore.com
share
share
share
share
share


