The Golden Implications Of Total US Deficits, Debt And Debt Service


The mainstream media is shocked today to report that the U.S. federal deficit increased to $779B in fiscal 2018. This despite the fact that all of this was projected back in February.
And we wrote about it back in February too. Here's the link: https://www.sprottmoney.com/Blog/total-us-debt-and...
It was back then that the Office of Management and Budget first proposed that the total U.S. federal deficit would climb in 2018 and then begin to exceed $1T by 2020. Recent reports now suggest that the stated deficit will in fact exceed $1T as soon as next year! Regardless, instead of focusing upon the stated deficit number, as all other media outlets are doing today, let's dig a little deeper to expose the true level of deceit in the accounting used by the U.S. government.
First and foremost, the total U.S. debt level grew by over $1.2T in fiscal 2018, not just $779B. At the end of fiscal 2017, the total U.S. debt was stated at $20,245,000,000,000. At the end of fiscal 2018, the debt stood at $21,516,000,000,000. The difference is $1,271,000,000,000. Note that this is dramatically higher than the stated budget deficit of $779,000,000,000. This underreporting of the true deficit is primarily accomplished through "raiding" social security taxes and using these funds for general purposes. See here: https://www.thebalance.com/deficit-vs-debt-how-the...
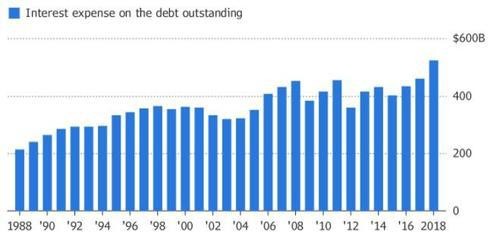
Next, consider the rising interest costs of servicing the existing and growing debt. For fiscal 2018, the total debt service cost rose to a new record of $523B. The growing public debt service cost is precisely why we've maintained for years that interest rates cannot and will not ever "normalize". Why? Do the math. If total U.S. federal debt service is already $523B per year, what will the debt service be by 2022, with total debt in excess of $25T and 10-year rates at 6%? The answer? At least $1T per year! Consider how just that component of the annual deficit will spiral the total deficit number to dizzying heights.

Finally, when the OMB makes the deficit and debt projections that you see above, they project economic growth as high as 4% per year for each year going forward. By doing so, the OMB can then project total tax receipts to grow as well. But no one in their right mind would expect the U.S. GDP to grow by 4% every year through 2028! With rising interest rates and a flat/inverting yield curve, the next U.S. recession will likely begin as soon as next year! How will the deficit and debt explode when tax receipts collapse as the economy contracts in recession? See this: https://northmantrader.com/2018/02/11/rising-debt-...
Which brings us back to one of our old, all-time favorite charts…

As you can plainly see above, until 2013 the price of COMEX gold consistently tracked with the growing level of total U.S. debt. You might even say that the total debt level (the red line) is a "mean" value for gold. Thus, if the "mean" price of COMEX gold was stretched to an upside extreme versus the debt level in 2011, you could also say that it was stretched to an equal downside extreme in 2015. It has since begun a process of reverting to this "mean".
What does this imply? Check again the OMB forecasted level of debt and deficit through 2028. At a minimum, this level will reach nearly $30T over this next ten-year period. Given that basis alone, would it be logical to expect the price of COMEX gold to remain stuck near $1200 per ounce over the same period? Of course not.
Therefore, any prudent person with an exposure to U.S. dollars would be wise to continue stacking physical gold. Already in 2018, the price of gold in currencies such as Turkish lira and Iranian rial has exploded higher in response to the currency devaluations these countries have experienced. The massive, ongoing deficit and debt expansion of the U.S. guarantees a similar fate. And WHEN this finally occurs, expect the price of gold in dollars to explode higher too. It is simply a matter of time.
The views and opinions expressed in this material are those of the author as of the publication date, are subject to change and may not necessarily reflect the opinions of Sprott Money Ltd. Sprott Money does not guarantee the accuracy, completeness, timeliness and reliability of the information or any results from its use.You may copy, link to or quote from the above for your use only, provided that proper attribution to the author and source is given and you do not modify the content. Click Here to read our Article Syndication Policy.
 Craig Hemke began his career in financial services in 1990 but retired in 2008 to focus on family and entrepreneurial opportunities. Since 2010, he has been the editor and publisher of the TF Metals Report found at TFMetalsReport.com, an online community for precious metal investors.


