Gold Price Forecast: 72-Day Wave Still Pushing Higher
 share
share
 share
share
 share
share
 share
share
 share
share
 Recap of Last Week
Last week's action saw gold forming its low in Monday's session, here doing so with the tag of the 1807.50 figure. From there, a sharp rally was seen into late-week, with the metal running all the way up to a Friday peak of 1867.40 - before backing slightly off the same into the daily/weekly close.
Gold's, Short-Term Picture
For the short-term view, the February 2nd reversal above the 1810.10 figure confirmed an upturn with the 10 and 20-day cycles, with the upward phase of the same still seen as being in force. In terms of price, the recent rally easily made it back to the 20-day moving average, which was the ideal magnet - seen approximately 85-90% of the time on the upward phases of the 20-day component.
Here again is our 20-day cycle chart:
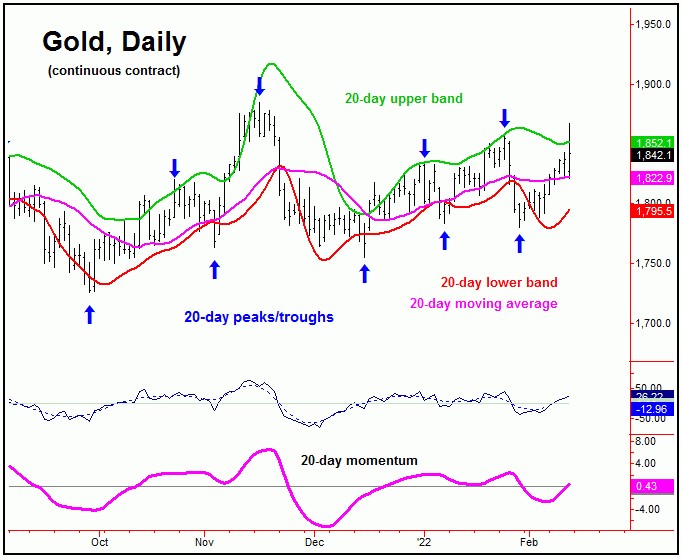
Having said the above, there was some potential for a push back to higher highs for the bigger swing up. This was due to the fact that our downside 'reversal point' for the 72-day cycle was noted as being a daily close back below the 1780.00 figure (April, 2022 contract) which was tested on the decline into late-January, but which held the action on a closing basis.
With the above said and noted, the next short-term peak should come from the smaller 10- day cycle, which is now 10 trading days along - and with that has moved into extended territory.
A cycle is considered to be 'extended', when its current rally is still making higher highs on or past the average wave length. In other words, when the 10-day cycle is still making higher highs on or past 10 trading days, it is seen as extended - which is the case as of Friday's close.
Here is the chart of our 10-day cycle component:
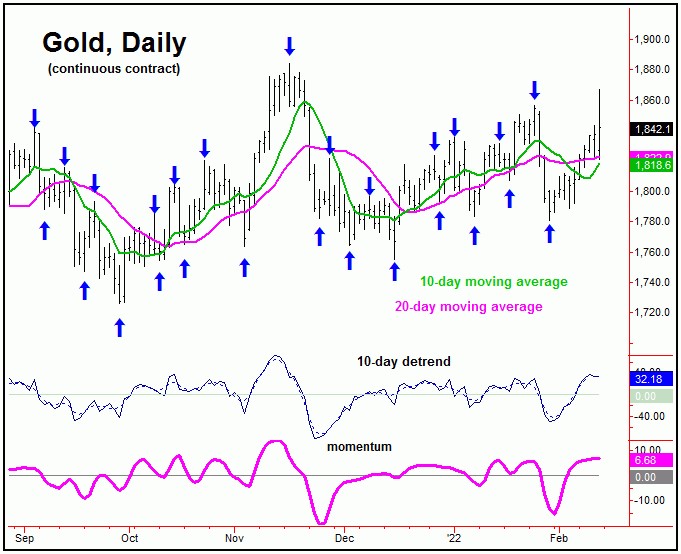
In terms of price, gold would need to see a reversal back below the 1820.50 figure (April, 2022 contract) to confirm a turn south with this 10-day wave. In terms of price, that would not be too telling, as our 10-day moving average for gold - the normal minimum magnet - is not too much below that reversal number. The good news is that this reversal figure will continue to move up in the short-term, with the exact number always posted in our Gold Wave Trader report.
In terms of price, the next downward phase of the 10-day cycle, once in force, should see the 10 and 20-day moving averages acting as magnets. If that move down is able to remain above the 1780.00 figure (now on an intraday basis), then the next upward phase of this 10-day wave could still make it back to higher highs for the bigger swing, before topping the larger 72-day cycle.
Gold's 3-5 Week Picture
From the comments made in past articles, our larger 72-day cycle was projected to bottom-out into mid-December of last year, with its actual low coming in on 12/15/21 - and doing so at the 1755.30 figure. From there, the upward phase of this wave was projected higher into this mid-January to mid-February region.
Here again is that 72-day component:

From the comments made last weekend, the momentum indications leaned the odds in favor of a 72-day peak that was made at the 1856.50 swing top. Having said that, there was no actual confirmation of that assessment, where Gold currently needs to take out the 1780.00 figure on an intraday basis, and not a closing basis.
With the above said and noted, as long as any smaller-degree corrections (i.e., 10 and 20-day cycles) continue to remain above the 1780.00 figure on a closing basis, then higher highs can be seen before our 72-day top forms. This number should also start to rise again soon, depending on the action.
Something that I will be watching in the days ahead is whether gold is able to close back above its upper 72-day cycle band (currently 1878, but moving daily). If the same is seen while the lower 72-day 'oversold' indicator spikes back above its upper reference line (i.e., both on the same trading day), then that will be the recipe to pick a top with this 72-day wave. Otherwise, for now we have our downside reversal point as our guide.
Stepping back then, from whatever high that does end up being seen with this 72-day cycle, the probabilities will favor a decent correction playing out into what is projected to be early-April. In terms of patterns, due to new indications from our longer-term cycles, we anticipate only a countertrend decline with this wave into early-Spring, one that holds above the August, 2021 trough of 1682 - before giving way to a sharp rally phase into the Summer months. Stay tuned.
Jim Curry
The Gold Wave Trader
http://goldwavetrader.com/
http://cyclewave.homestead.com/
*******
share
share
share
share
share