Gold's Apathy Sets The Stage For Sharp Rally


Last week's trading saw the gold market forming its high in Monday's session, here doing so with the tag of the 1876.00 figure (April, 2021 contract). From there, a sharp decline was seen into later in the week, with the metal dropping all the way down to a Thursday low of 1784.60 - before bouncing off the same to end the week.
Gold Trader Apathy Setting the Stage for a Rally
With the action seen in recent months, there was originally a lot of frustration amongst gold traders. I can tell from the amount of email questions and comments that I get, this frustration has now turned to apathy - a general lack of interest for gold. This action is precisely what we would expect to see prior to a major rally phase for the metal, which we believe is going to play out in the months ahead.
For the very short-term, the next good rally phase should come from the 34-day cycle, which is shown on the chart below:
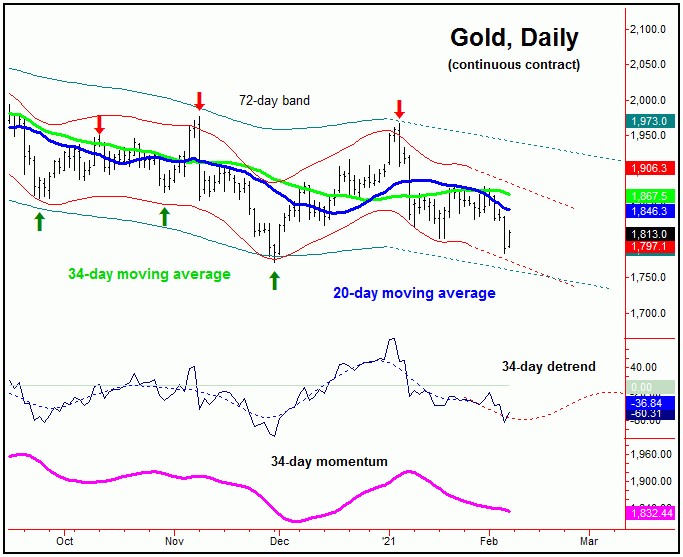
Whether the most recent low will end up as the expected trough for this 34-day wave remains to be seen, though we think a shorter-term rally is going to play out in the coming days, one which could take the metal back to its upper (and declining) 34-day channel line. If that move ends up as countertrend - finding resistance near the upper channel - then a drop back to or below the lows can still materialize on the next minor swing to the downside.
Technical Indications
Having said the above, there are now technical signs of life for the gold market, which comes in the form of our Mid-Term Breadth index, shown on the next chart:
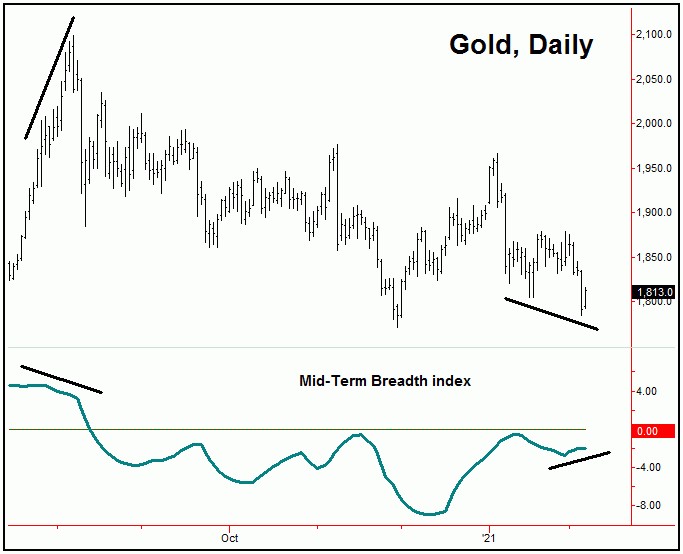
With the break down into last Thursday, our Mid-Term Breadth index is now showing a decent divergence from price - which is something that we would expect to see near larger-degree bottoms for gold. At minimum, however, this pattern should see price making a decent short-term bounce/rally in the coming days, then to reassess the action at that time. Should the metal be able to get back above the 1880.00 figure (April, 2021 contract) at any point, then a key bottom may be set in place.
Gold's Mid-Term View
As noted in past articles, gold is expected to be choppy in the coming months, due to the opposing position of the mid-term cycles. That is, there is a 154-day wave which bottomed back in late-November, and with that has been seen as heading higher off the same. However, there is a larger 310-day wave, which is next projected to trough around April or May of this year, and which is shown below:
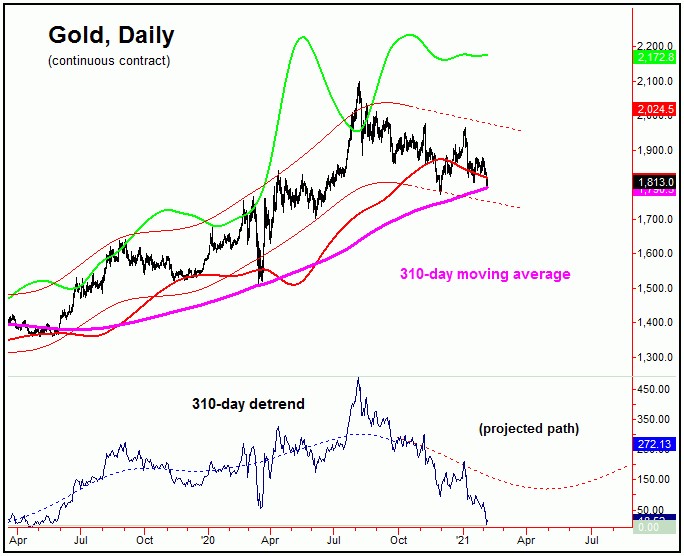
In terms of price, we have noted that the 310-day moving average would act as the eventual downside price magnet - and which has actually been met with the action into late last week. With that, any normal minimum expectation has already been met with this component, which means that it can bottom at anytime.
Going further with the above, of note is that our 310-day moving average is trending to the upside, which means that all cycles above the 310-day component are still pushing higher at the present time - which is a bullish technical indication for the medium-to-long- term view. And, when cycles of a larger degree (such as the four-year wave) are heading higher, the next smaller cycle can and often will see an earlier-than-expected trough.
With the above said and noted, we see the decent potential that our 310-day cycle will bottom earlier than most expect. Either way, once this low is complete, the largest percentage rally of this year is expected to unfold, one which sees the upper 310-day cycle band acting as the eventual magnet. Going further, there is the open target from the larger four-year cycle to the 2212.00 - 2340.56 region, which we expect to be met at some point in the coming months, ideally on the next upward phase of this 310-day wave.
The Bottom Line
The overall bottom line for the gold market is that trader apathy - as well as a brewing divergence in breadth - sets the stage for at least a good short-term rally, if not something more significant. The alternate is that a short-term rally is able to hold below key resistance, and with that is followed by a marginally lower low into early-Spring. Either way, the next larger upward phase is expected to play out into later this year - which should come from one of the biggest cycles that we track, the 310-day wave. More on all as we continue to move forward.
Jim Curry
The Gold Wave Trader
http://goldwavetrader.com/
http://cyclewave.homestead.com/


