Gold's Into Key 'Reversal Date' Range


Last week's trading saw Gold forming its high in Tuesday's session, here doing so at the 1827.10 figure. From there, a sharp decline was seen into late-week, with the metal dropping down to an early-Friday low of 1759.00 - before bouncing off the same into the daily/weekly close.
Gold's Mid-Term View
For the mid-term picture, as mentioned in prior articles, the next important low for gold is expected to be made later this Spring, coming as a result of one of the largest cycles that we track, the 310-day wave:
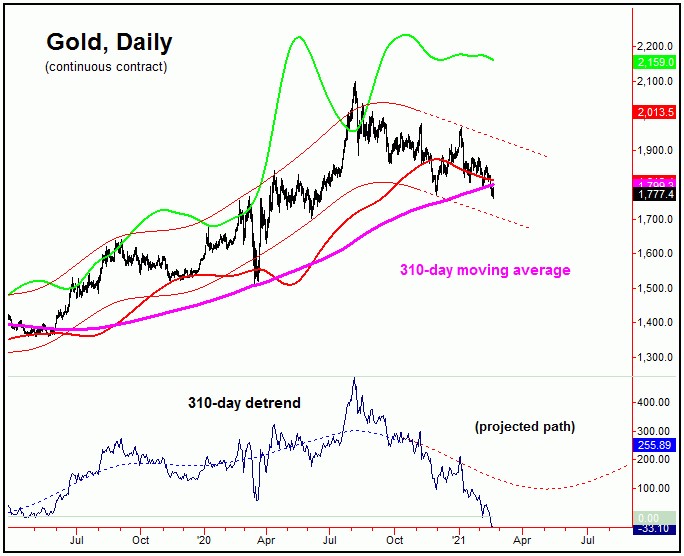
In terms of price, the 310-day moving average was expected to act as the eventual magnet, which has obviously been met with the recent action. Having said that, with the metal now able to take out the late-November trough, the smaller 154-day cycle had to have topped with the early-January high, and with that is also heading south:
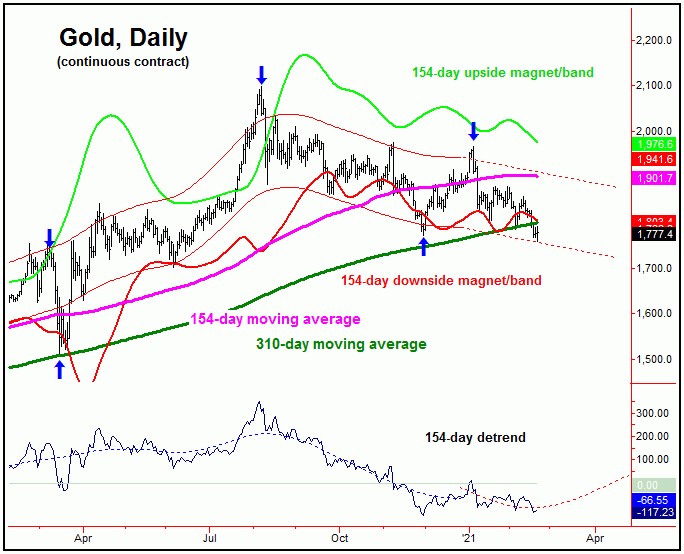
As noted in prior articles, the last low for the 154-day wave was seen as forming back in late-November of last year, though with the larger 310-day component pushing lower into April of this year (plus or minus). With that, the action was seen as being a larger sideways-to-down affair, even though the larger bullish uptrend (i.e., with the four-year cycle) is still seen as intact.
With the above said and noted, the next trough for the 154-day wave should also end up as the expected low for the larger 310-day component. Having said that, this could take additional time to develop, with that low not favored until the mid-April timeframe, plus or minus. Until then, it would take a reversal back above the 1970.30 figure (April, 2021 contract) to confirm the combination of these waves to have turned - though we expect this upside reversal level to start to drop going forward, depending on the action.
Once the next 154 and 310-day cycle combination trough is seen, the largest percentage rally of 2021 is expected to unfold in the months to follow, with the upper 310-day cycle band acting as the magnet - though with a still-outstanding upside target from the larger four-year wave to the 2212.00 - 2340.56 region being more ideal.
Gold's Key 'Reversal Date'
For the very short-term, however, gold is moving into a key ‘reversal date' range, which we have identified as being the February 19-26 timeframe - the early-end of which we are obviously into. Take a look at the next chart:
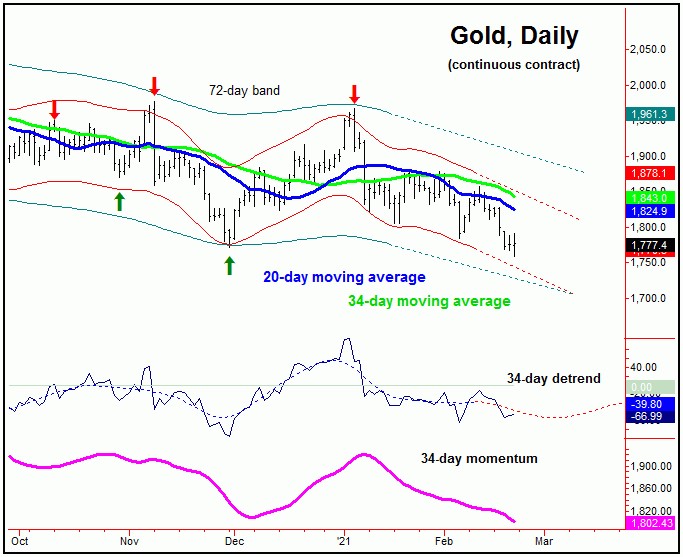
The above chart shows the 34-day cycle, which I have noted in prior articles was also seen as pointing down. In terms of price, the 1880.00 figure has been our key dividing line with this wave, and with that I noted that any short-term rallies that would remain below the same would have the potential to drop back to lower lows before bottoming. With that, the most recent rally spiked up to the 1856.60 figure - before turning back to make lower lows for the bigger swing.
For the shorter-term view, the next decent short-term rally should come from this same cycle - with some focus on the aforementioned reversal date range to trough this wave. However, it is too early to confirm a low with this component, though we should soon get a new price reversal level, one which - when taken out to the upside - will be our best indication/confirmation this wave has troughed.
Stepping back slightly, once the next 34-day trough is in place, then the probabilities will favor a minimum rally back to the 34-day moving average in the days/weeks to follow, though with a push up to the upper 72-day cycle channel being more ideal. Until proven otherwise, however, that move would be expected to end up as countertrend, giving way to lower lows into April or later - before troughing the larger 154/310-day cycles.
The Long-Term Outlook
For the bigger picture, the larger four-year cycle is still favored to be pushing higher into the late-2021 to Spring of 2022 timeframe:
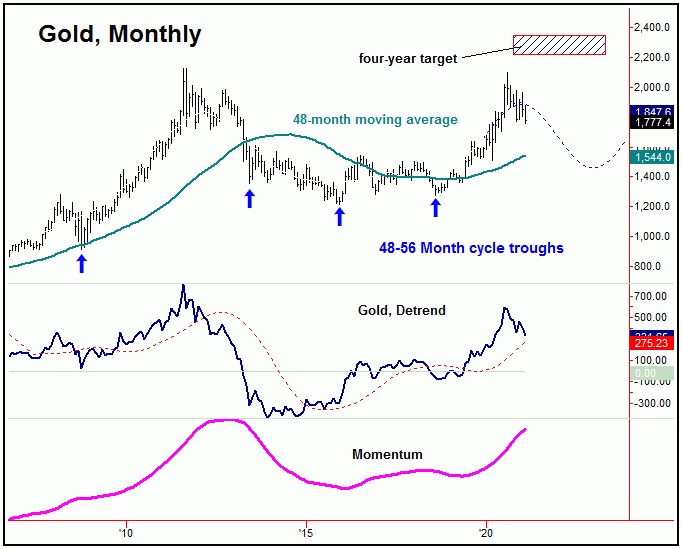
With the above, the next upward phase of the 310-day cycle should be the one that eventually peaks our four-year cycle, with major resistance into our open target zone to 2212.00 - 2340.56. From whatever peak that does form with this larger wave, a much bigger percentage decline is expected to play out into the late-2022 or early-2023 range, one which sees the 48-month moving average or lower acting as the eventual magnet.
Jim Curry
The Gold Wave Trader
http://goldwavetrader.com/
http://cyclewave.homestead.com/


