Gold's 'Kill Zone' Looms Close


Last week's trading saw its low registered in Monday's session, here doing so with the tag of the 1581.80 figure (April, 2020 contract). From there, a straight shot higher was seen into late-week, with the metal running all the way up to a Friday peak of 1652.10 - before backing slightly off the same into the weekly close.
Gold's 34-Day Cycle
The most dominant cycle that we track for the shorter-term picture is the 34-day cycle, which I have mentioned many times in my prior articles for Gold-Eagle, and which is shown again on the chart below:
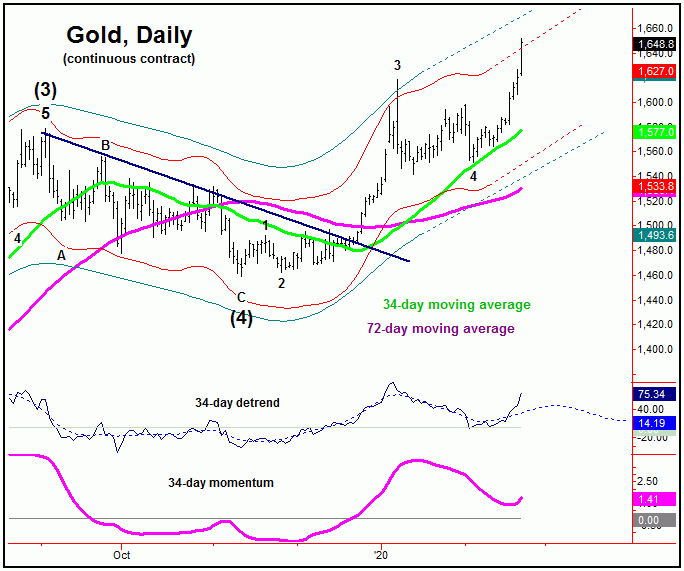
From the comments made back in late-January, the last trough for this 34-day cycle was due around the first week or so of February. In our Gold Wave Trader market report, we identified the key date range of February 6-7 as the expected trough for this component. Its actual low came in on February 5th, which was made at or near the 34-day moving average - our noted downside price magnet.
With the above said and noted, we expected the last correction phase of this 34-day wave to give way to the last low of significance. From that low, we forecast a very sharp rally to play out, as the upward phase of this wave took hold.
From my 2/2/20 article for Gold-Eagle: "for the stepped-back view, the Gold market is projected higher into the late-February timeframe or beyond, due to the configuration of the 72 and 154-day cycles. In terms of price, we noted last weekend the 1634-1660 region as a potential magnet into the same, an assessment which has now been confirmed by an upside price projection with these waves to the 1658-1691 level for the April, 2020 contract."
As mentioned above, the larger-degree 72 and 154-day cycles had confirmed an upside price target to the 1658-1690 region for the April, 2020 contract. With that, our expectation was that - following a bottom with the smaller 34-day wave into early- February - the metal would shoot sharply higher in the weeks to follow, which we have obviously seen with the recent action. In terms of price, gold is now at or within earshot of meeting our upside target for this move.
Take a look at our next chart:
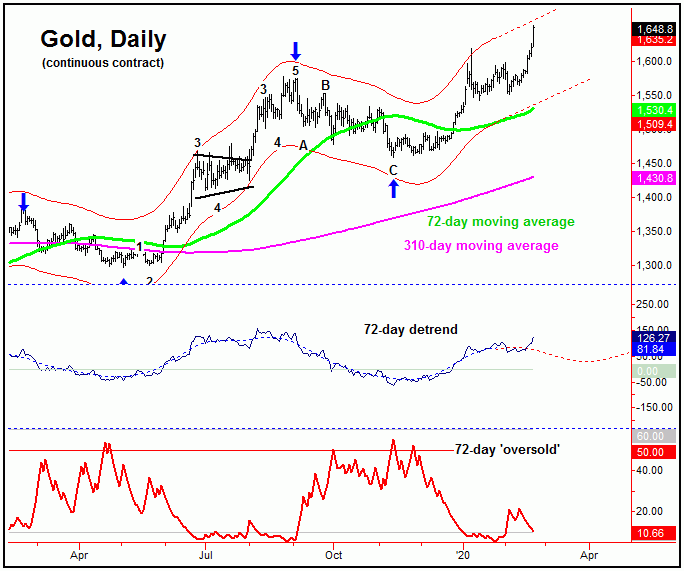
With the configuration of the various time cycles, we were able to go long the GLD (i.e., Gold tracking stock) around the 1560's into February 4th - a position which we are still holding at the present time, and will be looking for indications to exit in the near future, due to the configuration of the cycle shown on the above chart, the 72-day component.
For the mid-term picture, the next peak of importance is soon due to materialize, and should come from the topping of our 72-day time cycle. In terms of time, we have a key date for this wave to top out, with the exact details spelled out in our thrice-weekly Gold Wave Trader market report.
Stepping back further, once the next 72-day cycle top is set in place, then the largest percentage correction year-to-date is expected to materialize. This decline should see the 72-day moving average acting as the minimum expected magnet - though there is the decent potential for additional follow-through below the same.
In terms of patterns, the decline into the next 72-day trough is anticipated to end up as countertrend - holding at or well above the prior 72-day trough from November of last year. If correct, then the probabilities will favor another multi-month rally for gold into later this year, once again with more precise details of how this rally should unfold noted in our Gold Wave Trader report.
U.S. Stock Market
As mentioned in some of my prior articles, the U.S. stock market (as measured by the SPX) was looking for a sharp decline to play out into the late-January to early-February timeframe - a move which was anticipated to end up as countertrend, though hitting the 35-day moving average before bottoming. The cycle that was responsible for this decline was the 45-day component, which is shown again on the chart below:
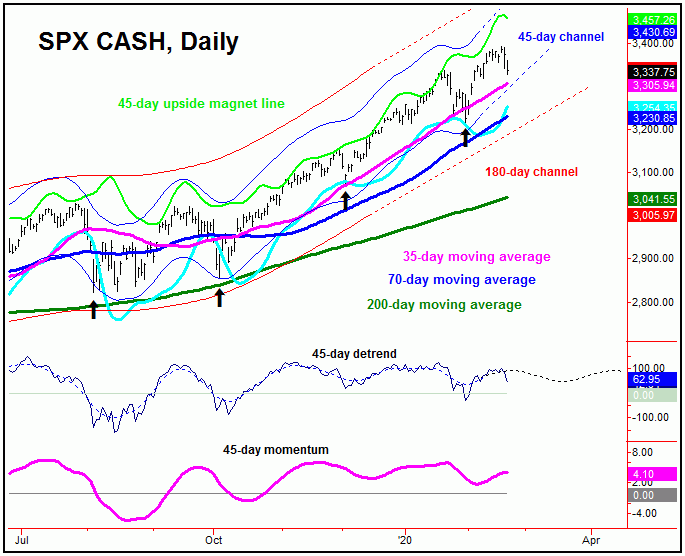
The chart above updates our 45-day cycle to real-time. This wave is easily the most dominant of the cycles that we track, and it last bottomed back on January 31st - which was right into our expected range, and with that we were able to Gold long the SPY (i.e., S&P 500 tracking stock) into that weakness.
With the above said and noted, we are now moving into the range where the next mid-term peak should try and form. And, while there is some potential that this peak is already set in place (with last week's sharp decline), there is yet no confirmation of the same. We are monitoring this very closely in real-time going forward, as what follows should be the largest-percentage decline of the year for U.S. stocks.
Take a look at the next chart:
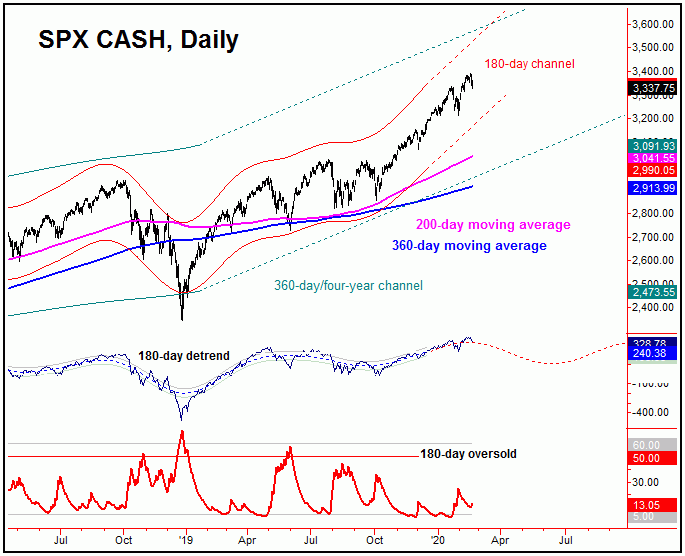
The chart above shows the most dominant of the mid-term cycles, the 180-day (or 9-month) component. From the comments made in past articles, this wave was seen as heading higher, which is why our expectation was for the last correction phase of the 45-day component to end up as a countertrend affair.
As you can see on the above chart, the 180-day cycle is now starting to gently roll over, though whether its price peak has been seen is still unclear. However, if the peak for this wave is still out there, then the coming weeks would be ideal for it to materialize.
As mentioned earlier, once this 180-day cycle does top out, the SPX is expected to see its largest percentage decline of the year playing out, one which sees the 200-day moving average acting as the bare-minimum price magnet. Having said that, due to technical considerations, there is the obvious potential for additional weakness through the same - though the overall correction is expected to end up as a larger countertrend affair.
The Bottom Line
The overall bottom line with the above is that Gold is closing in on its 'kill zone' date - which is an expected market top for the metal, and should mark the next significant peak. From there, a larger correction phase is expected to unfold. As for U.S. stocks, a larger-degree decline is also coming due, a move which is also expected to end up as countertrend - before a resumption of the larger bull market into later this year. More on all as we continue to move forward.
Jim Curry
The Gold Wave Trader
http://goldwavetrader.com/
http://cyclewave.homestead.com/
More from Gold-Eagle


