Gold's Safety Factor Kicks Into High Gear


Summary
Latest economic data continues to support increased gold demand.
Gold ETF demand is on the rise, another supporting factor.
Internal momentum for gold stocks is also showing major improvement.
For the first time in nearly a year, gold has a number of important supports in its favor which should propel its price higher in the months ahead. Signs of continued deterioration in the global economy, along with a a distressing drop in U.S. Treasury bond yields, are among the major factors fueling increased gold demand. In today’s report we’ll discuss these factors, as well as take a look at the improvement in the actively traded gold mining stocks.
Gold is clearly benefiting from fears of a global economic slowdown and should continue to do so in the weeks ahead. The equity market is trying to bottom and the threat of falling stock prices isn’t an immediate concern among investors right now. However, there is still a lot of fear among investors over the potential for deteriorating economic conditions in 2019. This in turn should benefit the gold market as safe-haven demand typically increases for a long period after the financial market has suffered a serious shock. Memories of the 20% decline in the major U.S. stock indices will linger for a while, and this alone is enough to keep gold prices buoyant in the coming months.
There have been several signs recently that the global economy continues to deteriorate heading into the New Year. China’s manufacturing activity for December contracted for the first time in 19 months, which was a source of major concern among economists. Euro zone manufacturing activity, meanwhile, grew by its lowest amount since 2016.
Even more alarming has been the rapidity with which U.S. Treasury bond yields continue to fall. This is distressing to investors because historically whenever bond rates fall below the federal funds rate it has preceded either turmoil in the financial markets or a slowing economy. Shown here is the 10-Year Treasury Note Yield Index (TNX) which fell by 4% on Thursday to 25.54. This reflects a 2.55% yield on the 10-year Treasury note and is very close to the 2.4% fed funds rate.
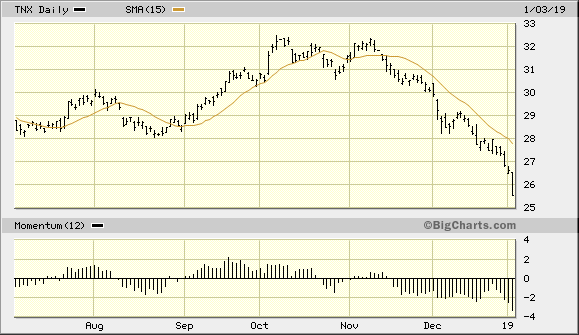
Source: BigCharts
All of the above mentioned factors are very supportive of gold’s increasingly bullish intermediate-term (3-9 month) prospects. Shown below is the February gold futures price graph, which continues to trend higher despite a technically “overbought” condition in the immediate term. The gold futures price rose by an additional 1% on Thursday and hit its highest level in almost seven months. Gold has now recovered more than half its losses since peaking last April. With powerful support from the “fear factor,” and with its currency component in the process of strengthening, the prospect for further gains in the coming months is indeed promising.
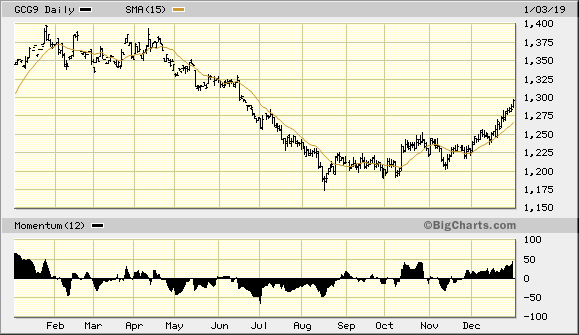
Source: BigCharts
Speaking of gold’s currency component, the U.S. dollar index remains below its widely-watched 50-day moving average and hasn’t been a major headwind for gold since early December. Shown below is the Invesco DB U.S. Dollar Index Bullish Fund (UUP), my favorite dollar proxy, along with its 15-day and 50-day moving averages. As I’ve emphasized in recent reports, as long as the dollar ETF remains under the 50-day MA (blue line) on a weekly closing basis, expect gold to have little problem making headway. The still-high level of fear hanging over the market is serving as the primary catalyst for gold’s rallies.
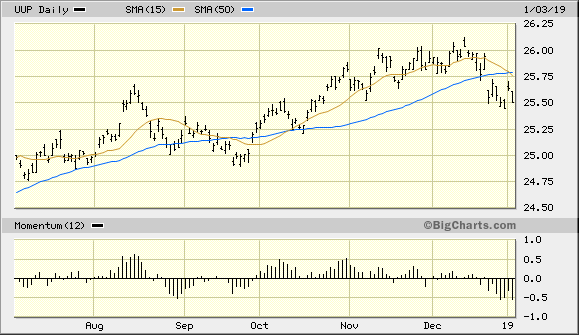
Source: BigCharts
On the ETF front, holdings of SPDR Gold Trust (GLD) rose to 795.31 tons, the highest level in five months as demand for gold among retail investors continues to increase. Rising ETF demand for bullion is another supporting factor for gold when gold’s primary fundamental and technical factors are already bullish.
Meanwhile, the iShares Gold Trust (IAU) - the gold trading vehicle I use for this report - remains in a confirmed immediate-term (1-4 week) uptrend. The ETF continues to move higher above its rising 15-day moving average and continues to make multi-month highs on almost a daily basis. It can be argued that IAU is becoming over-extended from its short-term trend lines, as shown below, and is therefore is vulnerable to a corrective pullback. Nonetheless, as long as the dollar ETF shown above remains below its 15-day and 50-day moving averages, gold’s trend should remain up in the near term despite the increased potential for a brief pullback or “pause that refreshes.”
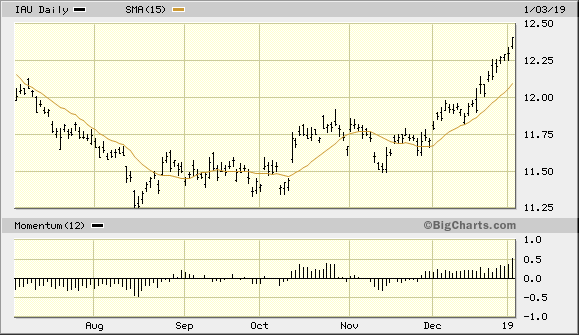
Source: BigCharts
Turning our attention to the gold mining stocks, the actively traded senior, mid-tier, and small-cap stocks which comprise the PHLX Gold/Silver Index (XAU) are a mixed bag. While some, like AngloGold Ashanti (AU), have shown excellent relative strength recently, others have lagged. The net result has been a lateral trading range in the XAU, which is visible in the following graph.
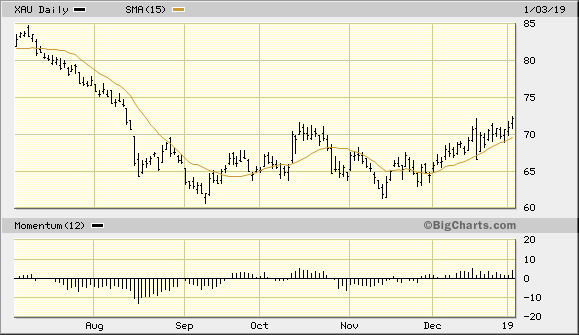
Source: BigCharts
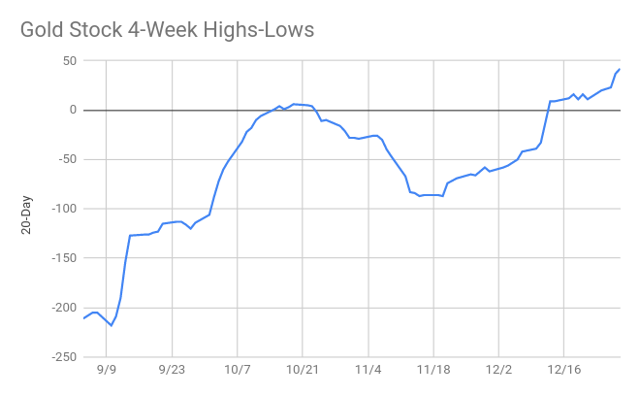
While the gold stocks continue to show a mixture of strength and weakness, the gold stock internal momentum indicator known as GOLDMO is reflecting mainly strength on a short-term basis. Shown here is the 4-week rate of change indicator of the new highs and lows in the major gold stocks. This indicator measures the momentum of the new highs and lows among the 50 most actively traded gold mining stocks.
Source: WSJ
As long as this indicator is rising, the near-term path of least resistance for gold stocks in general is considered to be up. This technically favors an upside breakout in the XAU index before the next correction phase commences. In a recent report I stated my opinion that a decisive breakout above the 72.00 level trading range ceiling in the XAU would signal the commencement of a broad gold stock market rally. On Thursday, the XAU closed at 72.16 and appears ready to finally break out to higher levels. An upside follow-through in the next couple of trading sessions will confirm that the gold stocks are finally ready to join the gold price in a belated rally.
In conclusion, gold continues to enjoy strong support from high levels of fear generated by the weakening global economy. Its all-important currency component also continues to improve, though more improvement would be welcome in the form of an even weaker dollar. On a strategic note, traders should remain long the iShares Gold Trust after recently taking some profit. I recommend raising the stop loss for the remainder of this trading position to slightly under the $12.10 level on an intraday basis. A violation of $12.10 in the IAU would mean that price has fallen under the technically significant 15-day moving average, in turn signaling a shift in the immediate-term trend.
Disclosure: I am/we are long IAU. I wrote this article myself, and it expresses my own opinions. I am not receiving compensation for it (other than from Seeking Alpha). I have no business relationship with any company whose stock is mentioned in this article.
********


