How Deep the Next Dow Jones’ Bear Market Bottom?


The Dow Jones continued advancing this week. Up by 0.57% BEV points (211 dollars) from last week’s close. Nothing major, but something better than a poke in the nose. The question is; can the Dow Jones close above its BEV -5% line? That would place the Dow Jones in scoring position; a BEV of something less than 5%. That is something it hasn’t done since April of last year.
On the other hand, if the Dow Jones were to next break below its BEV -15% line, that would be really bad technically. Not that I know what will happen next, I’m just considering the possibilities, as I believe we are in the early stages of a massive, historic bear market. Bad things happen in big-bear markets. So, I’m keeping my eye on the Dow Jones’ BEV -15% line. But I’ve been wrong before, so I’m not ruling out the possibility of seeing the Dow Jones at new all-time highs.
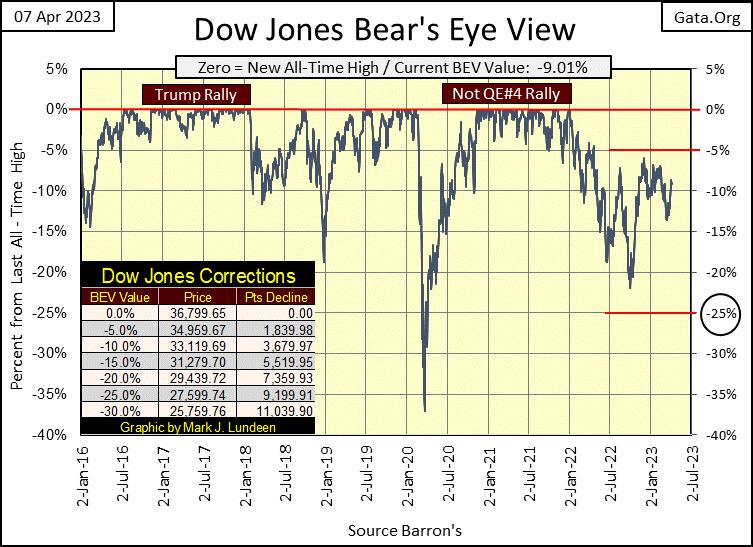
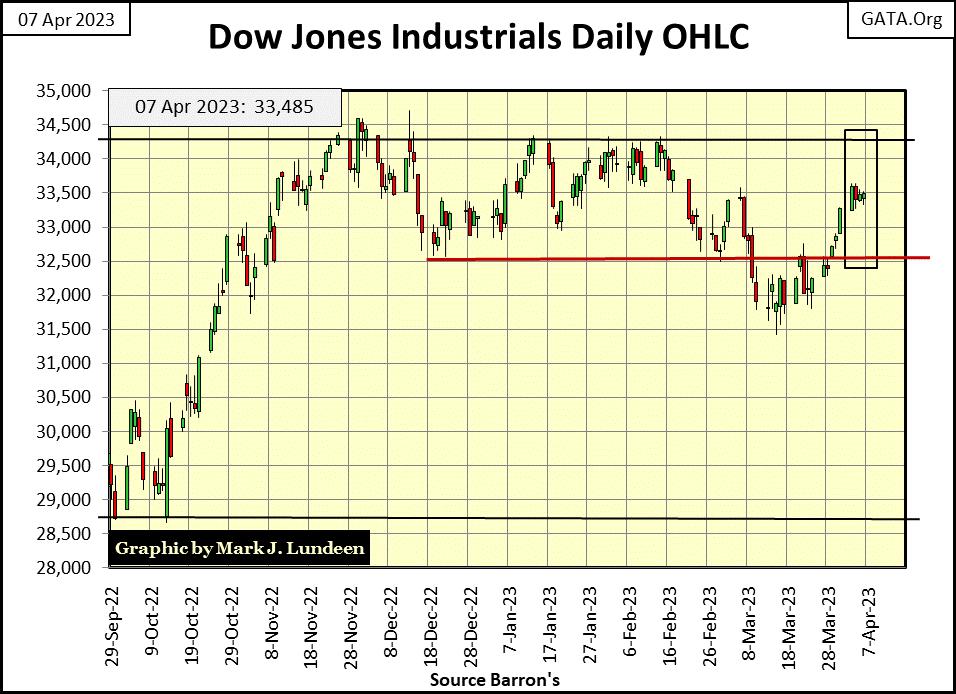
The reason for my caution can be seen below in the Dow Jones’ daily bar chart. Last week we saw an excellent advance, which was continued on Monday of this week, with the Dow Jones closing above 33,500 (33,601). Then for the rest of the week, the Dow Jones was unable to close above 33,500. It goes without saying, that should the Dow Jones close above 33,601 next week, the advance remains intact. But I have this feeling that maybe it won’t.
Not that it matters to me one way or the other, as I’ve been out of this market for a long time, eating hotdogs and drinking cheap beer in the market’s peanut gallery. And here I’ll stay for a long time to come. How long? I don’t know. But as you’ll see below in my comments on the Dow Jones dividend yield, I’ll be here until I see the Dow Jones post a dividend yield of at least 6%, and quite possibly more.
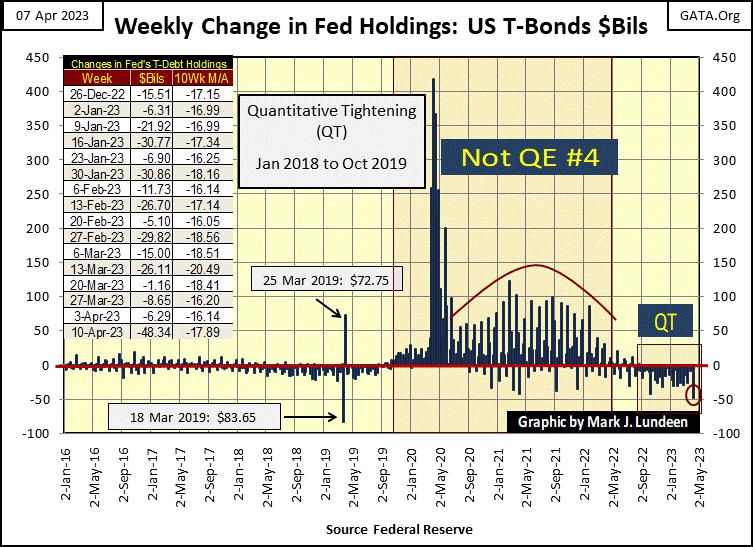
One factor weighing down this market, is the ongoing QT by the idiots at the FOMC. As you can see below, last week saw their largest weekly withdrawal of “liquidity” from the financial system since they began their QT last May. I’m no expert on “monetary policy.” Still, I’m surprised how well the stock and bond markets have so far taken it, with so much “liquidity” being drained from the financial system in the past year, the QT in the chart below.
Moving on to the major market indexes I track below, via BEV values, over half were down for the week. But the big news for the week was the gold and silver miners in the XAU closed the week no longer at #20 in the table, but advanced to #19, with the NASDAQ Banks becoming tail-end Charlie at #20.
This is what I like about following these indexes using BEV values instead of dollars, as they are published in; we can compare them, one to another directly, as we are looking at each of them in terms of all-time highs (BEV Zeros / 0.00%), and percentage declines from their all-time highs.
And this week, the XAU’s BEV value closed -39.43% from its last all-time high. While the NASDAQ Banks closed -42.90% from its last all-time high. That the XAU closed the week at a dollar value of 138.69, far below the NASDAQ Banks weekly closing of 3,088.28, means nothing when using BEV values.
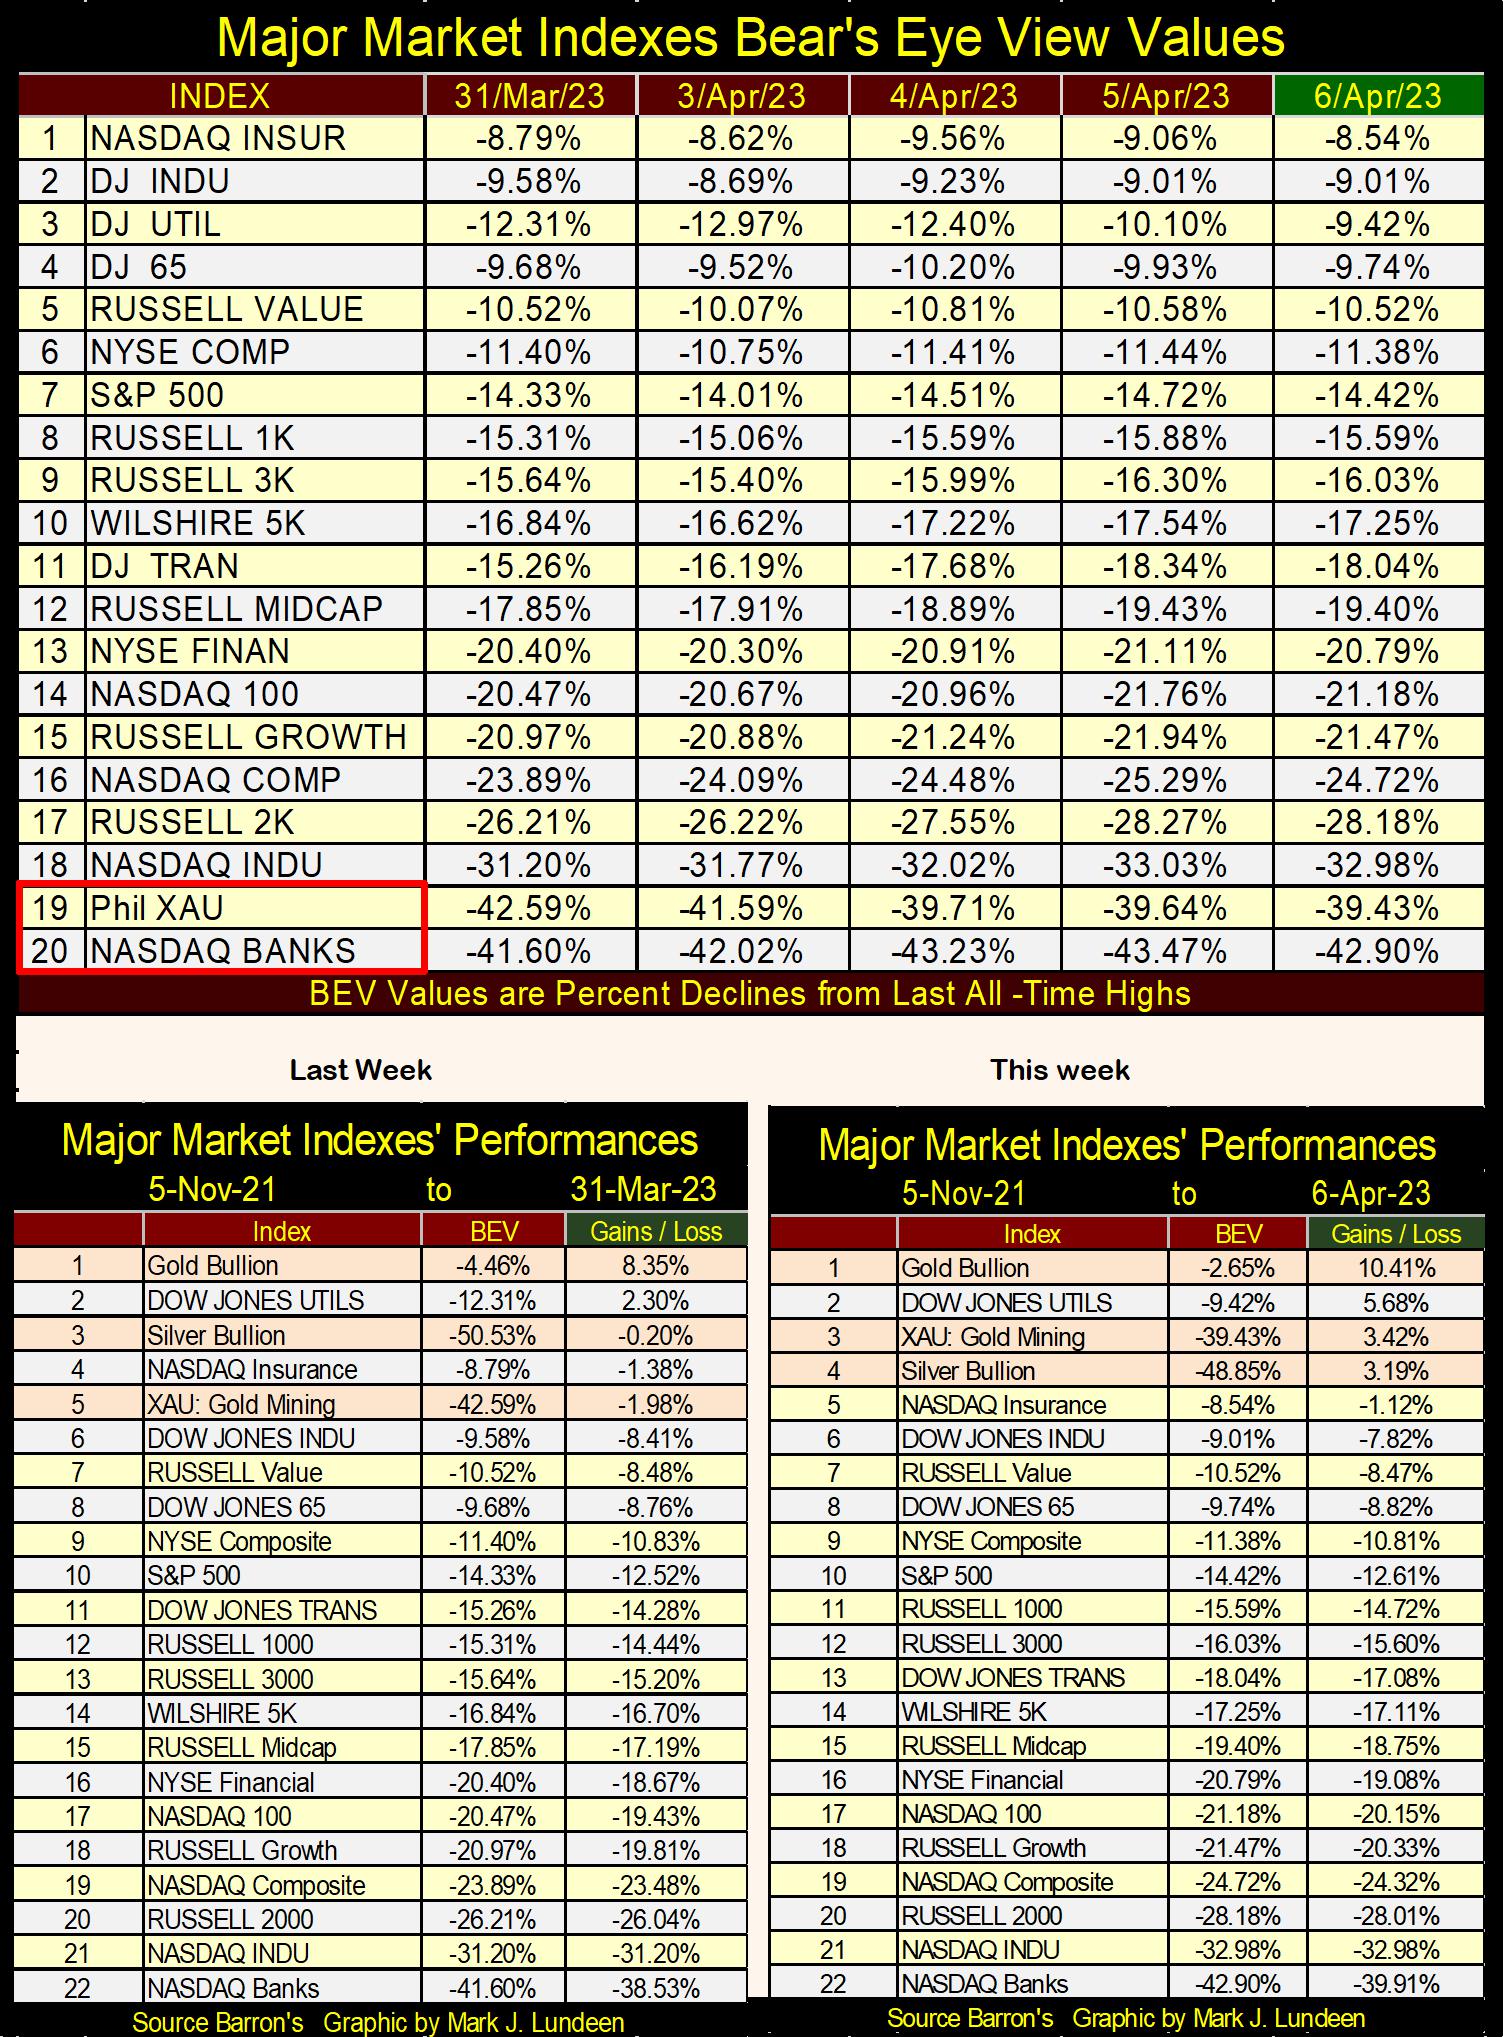
Looking at the performance table above, gold, silver and the XAU all closed above their values seen on 05 Nov 2021. Except for the Dow Jones Utilities Average, everything else is down, some indexes by a lot.
Let’s take another look at the NASDAQ Banking Index and the XAU in the charts below. The banking sector is down 43% from its last all-time high at week’s close. That is an entire bear market decline all by itself. But what is concerning is the financial media’s coverage of the banking system; for the most part they are covering the banks as if their bottom is in, and any ancillary effects in the banking systems’ difficulties will be contained.
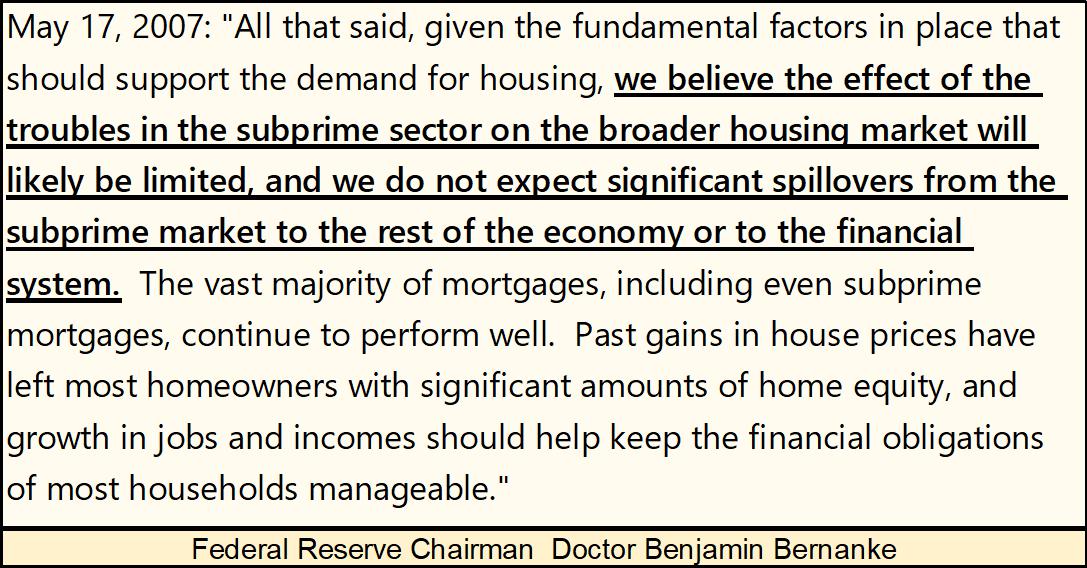
I’ve heard this somewhere before, in 2007 before the sub-prime mortgage crisis came into full bloom, as in the quote below from then Fed Chairman Doctor Bernanke, on his expectations on the mortgage crisis. At the time (May 2007), the Dow Jones was still making new all-time highs.
Two years later, the Dow Jones saw its second deepest percentage decline since 1885, as the global banking system almost melted down due to its exposure to toxic mortgages. And would have melted down had the idiots at the FOMC not implemented their QE#1.
Look at the post Silicon Valley Bank failure’s drop in the NASDAQ Banks below. I would expect “market experts” everywhere to be running around in panic with such a decline. But they are not.
So, how far will this banking index fall when in the later stage of the decline, “market experts” everywhere * DO * begin running around in panic? I’m thinking the BEV of -66% seen in early 2009 during the sub-prime mortgage crisis could be taken out. That would make buying banks, any bank at today’s prices a very bad decision, one seasoned investors would avoid.
Until the financial system finally deals with its banking irregularities, the current bear market the financial media has so far chosen to ignore, is nowhere close to its ultimate bottom.
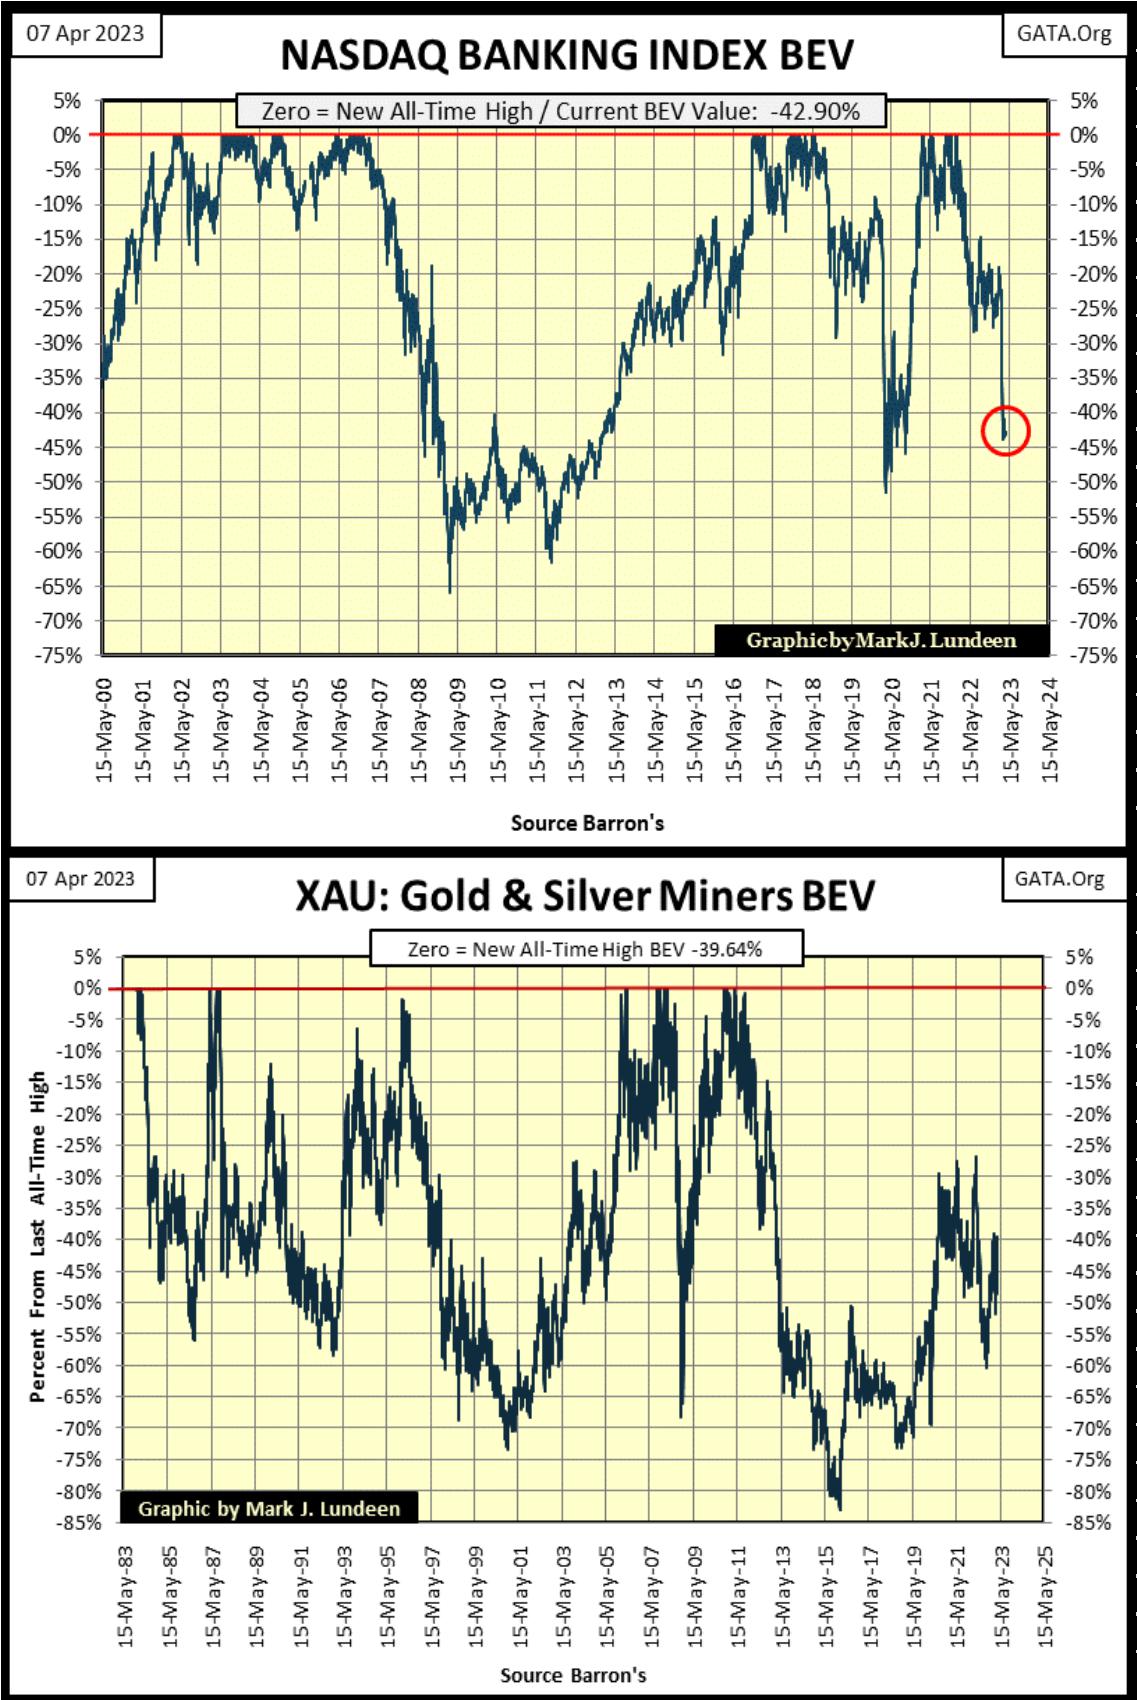
Now look at the XAU, still coming off the bottom of an 83% market decline in January 2016. As far as the eye can see, there is no indication of excessive speculation in the gold and silver mining sector, and hasn’t been since the 1970s, over forty years ago. That isn’t saying in the coming market panic, the XAU couldn’t go down. It could.
But big market panics also produce tsunamis of flight capital, seeking safety from deflation in the stock and bond markets. I believe gold, silver and the mining shares will once again prove to be a safe harbor for flight capital in the coming storm. That gold, silver and the XAU have recently outperformed just about everything else being bought and sold on Wall Street, is an indication the smart money is getting into position before everyone else.
As things are today, I don’t think one can do much wrong shifting a significant position of one’s wealth into established gold miners, both large and midcap. And the best kept secret in the stock market is how cheap the gold and silver exploration companies are, such as Eskay Mining.
I remain very positive on Eskay Mining, though it is far from last year’s share prices. I don’t talk much about Eskay Mining, as I’m not a paid promotor for the company. I just like the company, and have a large position in it myself. I’m only passing on something I believe is good to my readers.
In the past two years, Eskay Mining’s superb geology team has made significant advances in their understanding of what is underneath their massive property in British Columbia’s Golden Triangle. From what I can tell from sources in the public domine, everyone in management and in the geological team is excited at what they’ve discovered.
There will be a drilling program in 2023, and the prospects for the company discovering another Eskay Creek type of high-grade gold and silver deposit is excellent. If so, the advances in Eskay Mining’s share prices could be stunning.
Still, Eskay Mining remains a speculation. I wouldn’t risk more than 5% to 10% of your portfolio of gold and silver miners on it.
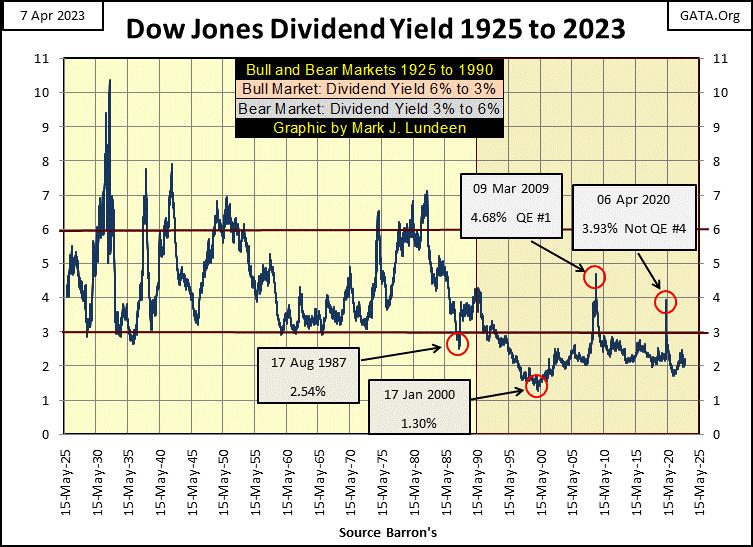
Last week, I covered some Dow Jones history; earnings and dividend payouts going back to the 1920s. I’m going to continue writing about the historical Dow Jones this week, with ninety-eight years of its dividend yields (chart below).
There was an old rule-of-thumb that went with this data, that bull markets topped when the Dow Jones’ dividend yield declined, or approached 3.0%, while bear markets bottomed after the Dow Jones’ dividend yield increased to something above 6.0%.
This rule proved amazingly accurate. From 1925 to May 1990, for sixty-five years investors who followed this rule (exit at a 3% dividend, return following a 6% dividend), sold at * EVERY * market top, and returned to the stock market following the worst part of the following bear market decline. Sixty-five years is a long time. And for a long time, this simple mechanical buy/sell model, using dividend yields for the Dow Jones for timing bull and bear market’s exit and reentry points, held true for investors.
But in May 1990 something changed; what changed was Alan Greenspan’s “monetary policy.” A “monetary policy” that remains in place to this day, where bear-market declines are to be actively opposed with the full force and might of whoever the Chairman of the Federal Reserve is. Back in May 1990, that was Alan Greenspan. Today in April 2023 it is Jerome Powell. In between we’ve seen Doctor Benjamin Bernanke and Janet Yellen managing Greenspan’s “monetary policy” as per the stock market to the same end; the Dow Jones dividend yield must not rise above 3%.
In effect, Greenspan’s “monetary policy” was one of maintaining a perpetual bubble inflated into the stock market. As much as everyone loves being bailed out when the stock market is in a deep decline. To have created, and maintained a financial bubble in the stock market from May 1990 to today (thirty-three years), ultimately is a “monetary policy” of total disaster for Wall Street, the financial system which includes pension funds and insurance companies, and of course individual investors themselves.
Look at the chart below. When did Doctor Bernanke implement his first Quantitative Easing (QE#1)? In early 2009, when for the first time in nineteen years the Dow Jones was yielding over 3% during the sub-prime mortgage market meltdown. The bear market bottom for the sub-prime mortgages was the second deepest percentage decline (53.78%) for the Dow Jones since February 1885, exceeded only by the 89% bear market decline of the Great Depression.
But the Great Depression bear market bottom fully expressed itself when the Dow Jones was yielding over 10%. The sub-prime mortgage market bear market’s 54% decline bottomed with a Dow Jones dividend yield of only 4.68%, far from the traditional 6% for past bear market bottoms.
Why the difference? Since Alan Greenspan was Chairman of the Federal Reserve, the idiots at the FOMC have been practicing bear-market interruptus, preventing bear markets from fully expressing themselves – no Dow Jones dividend yields over 6% (see dividend chart below).
Chairman Powell’s Not QE#4 took place during the Flash Crash of March 2020. Since 1993, this was the second time the Dow Jones’ dividend yield increased to something over 3.00%, in the spring of 2020.
To see the impact on “monetary policy” of having the Dow Jones’ dividend yield increase to something over 3.00%, one need only to look at the history of quantitative easings by the FOMC in the chart below.
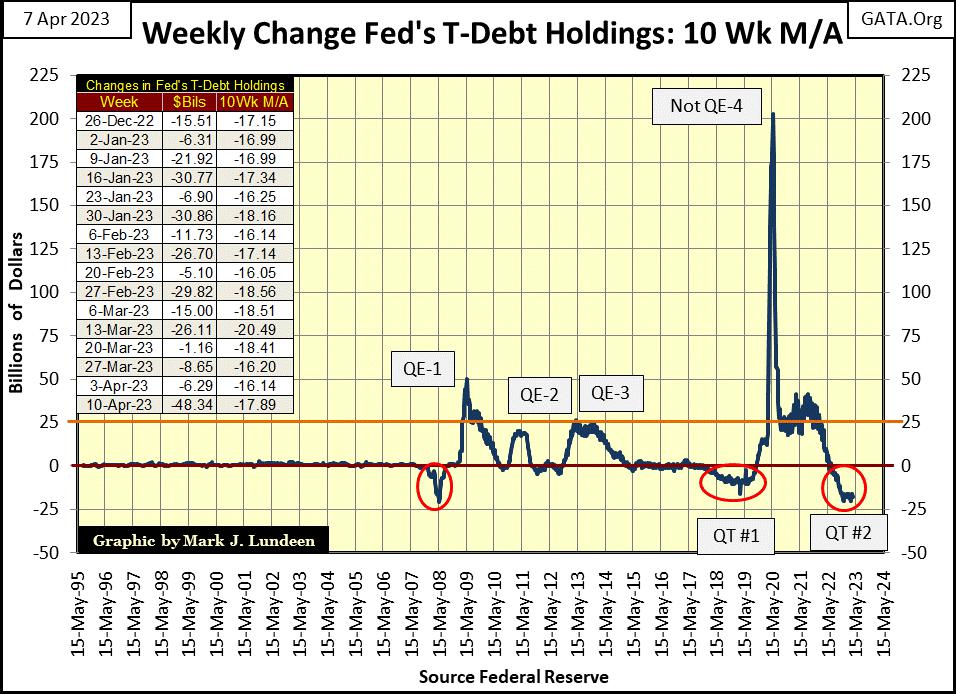
So, looking at this history of dividend yields for the Dow Jones below, when do the idiots at the FOMC implement their QEs? Post May 1990; anytime the Dow Jones dividend is yielding something over 3.00%.
What happens next time the Dow Jones’ dividend yield exceeds 3%? Will the idiots implement their QE#5? Maybe, and then maybe not if they decide to allow the financial system to crash with a bear-market bottom not seen since the depressing 1930s.
Look at this from the perspective of Klaus Schwab’s World Economic Forum; there is no better way to force “consumers” to stop consuming Earth’s precious resources, than to drive the world into grinding poverty with a devasting market crash.
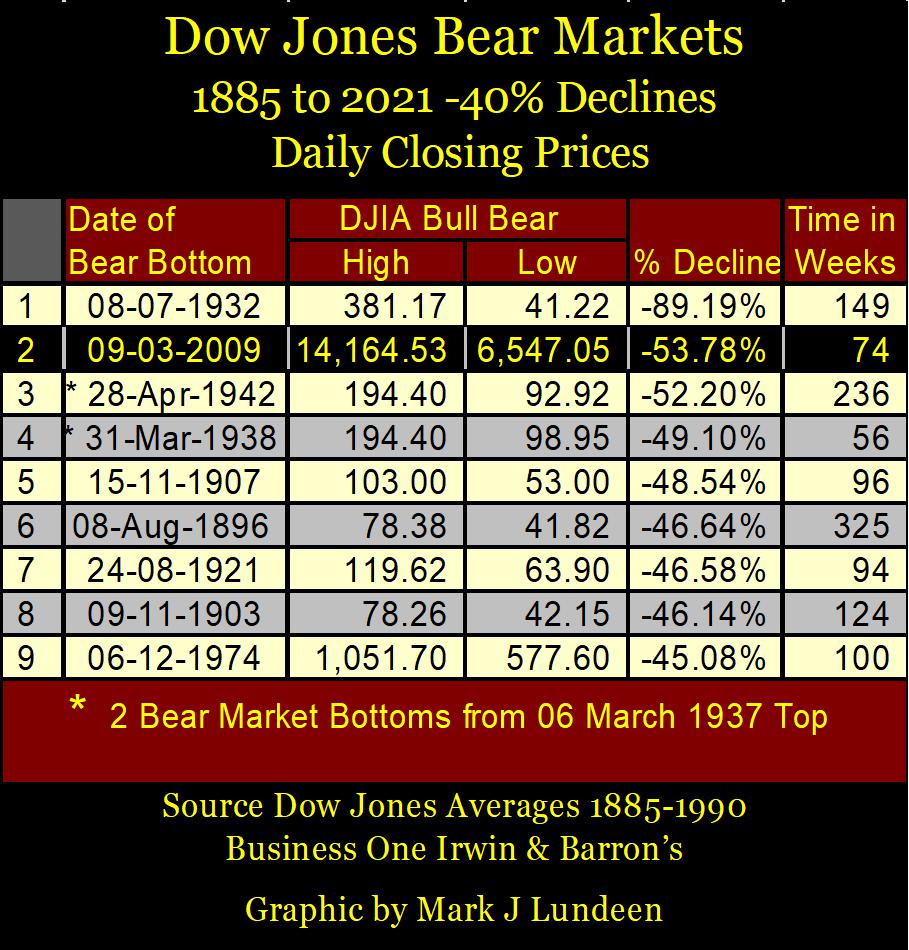
How bad could that crash be? Let’s look at two examples in the table below. First, for the sub-prime mortgage bear market, which bottomed (53.78% decline) with a Dow Jones dividend yield of 4.74% on 09 March 2009, as per the table below. Had the market been allowed to deflate, as it would have before Alan Greenspan’s “monetary policy”, the Dow Jones would have eventually seen a 6% dividend yield. In 2009, that would have resulted in a 63.47% market decline, a huge difference from its actual 53.78% bear-market bottom.
However, before Greenspan, bear markets frequently bottomed with a Dow Jones dividend yield of 7%. A 7% dividend yield would have resulted in a 68.69% bear market bottom in 2009.
As the Great Depression crash saw a Dow Jones dividend yield of over 10%, I included a row in the table to see what a 10% dividend yield in the Dow Jones would have done in 2009; a 78.08% bear-market bottom.
Note; all these market declines in the table were based on a Dow Jones dividend payout of $310.43. But during big-bear market declines, dividend payouts are typically reduced due to declining economic conditions. Companies find they have to shift funds intended for dividend payouts, towards servicing their bond obligations.
If the “policy makers” had allowed nature to take its course in 2009, a 25% reduction in dividend payout would be quite reasonable ($233). To see the effects of such a reduction in payouts, divide the dividend payout by the dividend yield to compute the resulting Dow Jones’ valuation. The impact of declining dividend payouts during a bear market are significant!
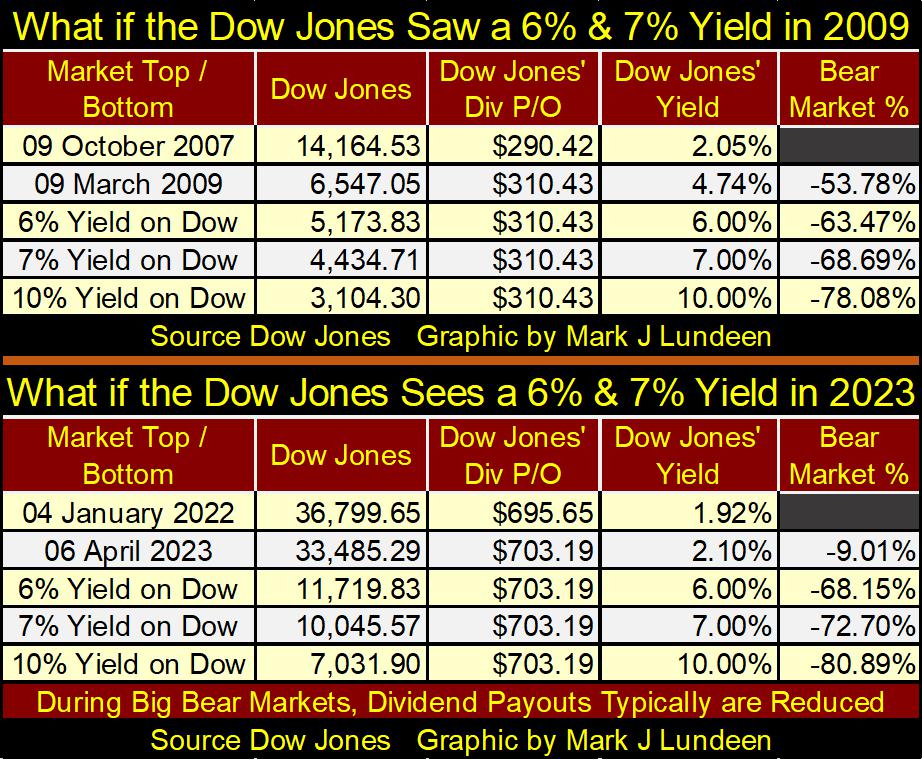
The table above is for our current market. Assuming a payout of $703.19, a dividend yield of 6% would result in a 68% reduction in the valuation for the Dow Jones. As I said, assuming dividend paying-blue-chip stocks can maintain their dividend payouts during a massive bear market is a big assumption.
To better see the potential for devastating market declines from current market levels, I’ve created the table below, which uses dividend yields and payouts to calculate valuation for the Dow Jones. This is a simple calculation, of just dividing the payout by the yield. Exactly what yields and payouts the Dow Jones will have in the future, no one today can say with certainty. But the table below is useful as it allows us to see the possibilities as Mr Bear goes to work on Wall Street.
Assuming a 6% yield, and a reduction in the Dow Jones payout to $350, takes the Dow Jones down to 5,833 in the table below. Both these assumptions are well within the historical parameters for the Dow Jones’ dividend, and they result in an 84.15% bear-market decline from the Dow Jones last all-time high of 36,799.65, seen on 04 January 2022.
Can the Dow Jones dividend yield rise up to 6%? If you believe the bond market is in a massive bear market, that ultimately leads to double-digit bond yields, why would the dividend yield for the Dow Jones * NOT * exceed 6%?
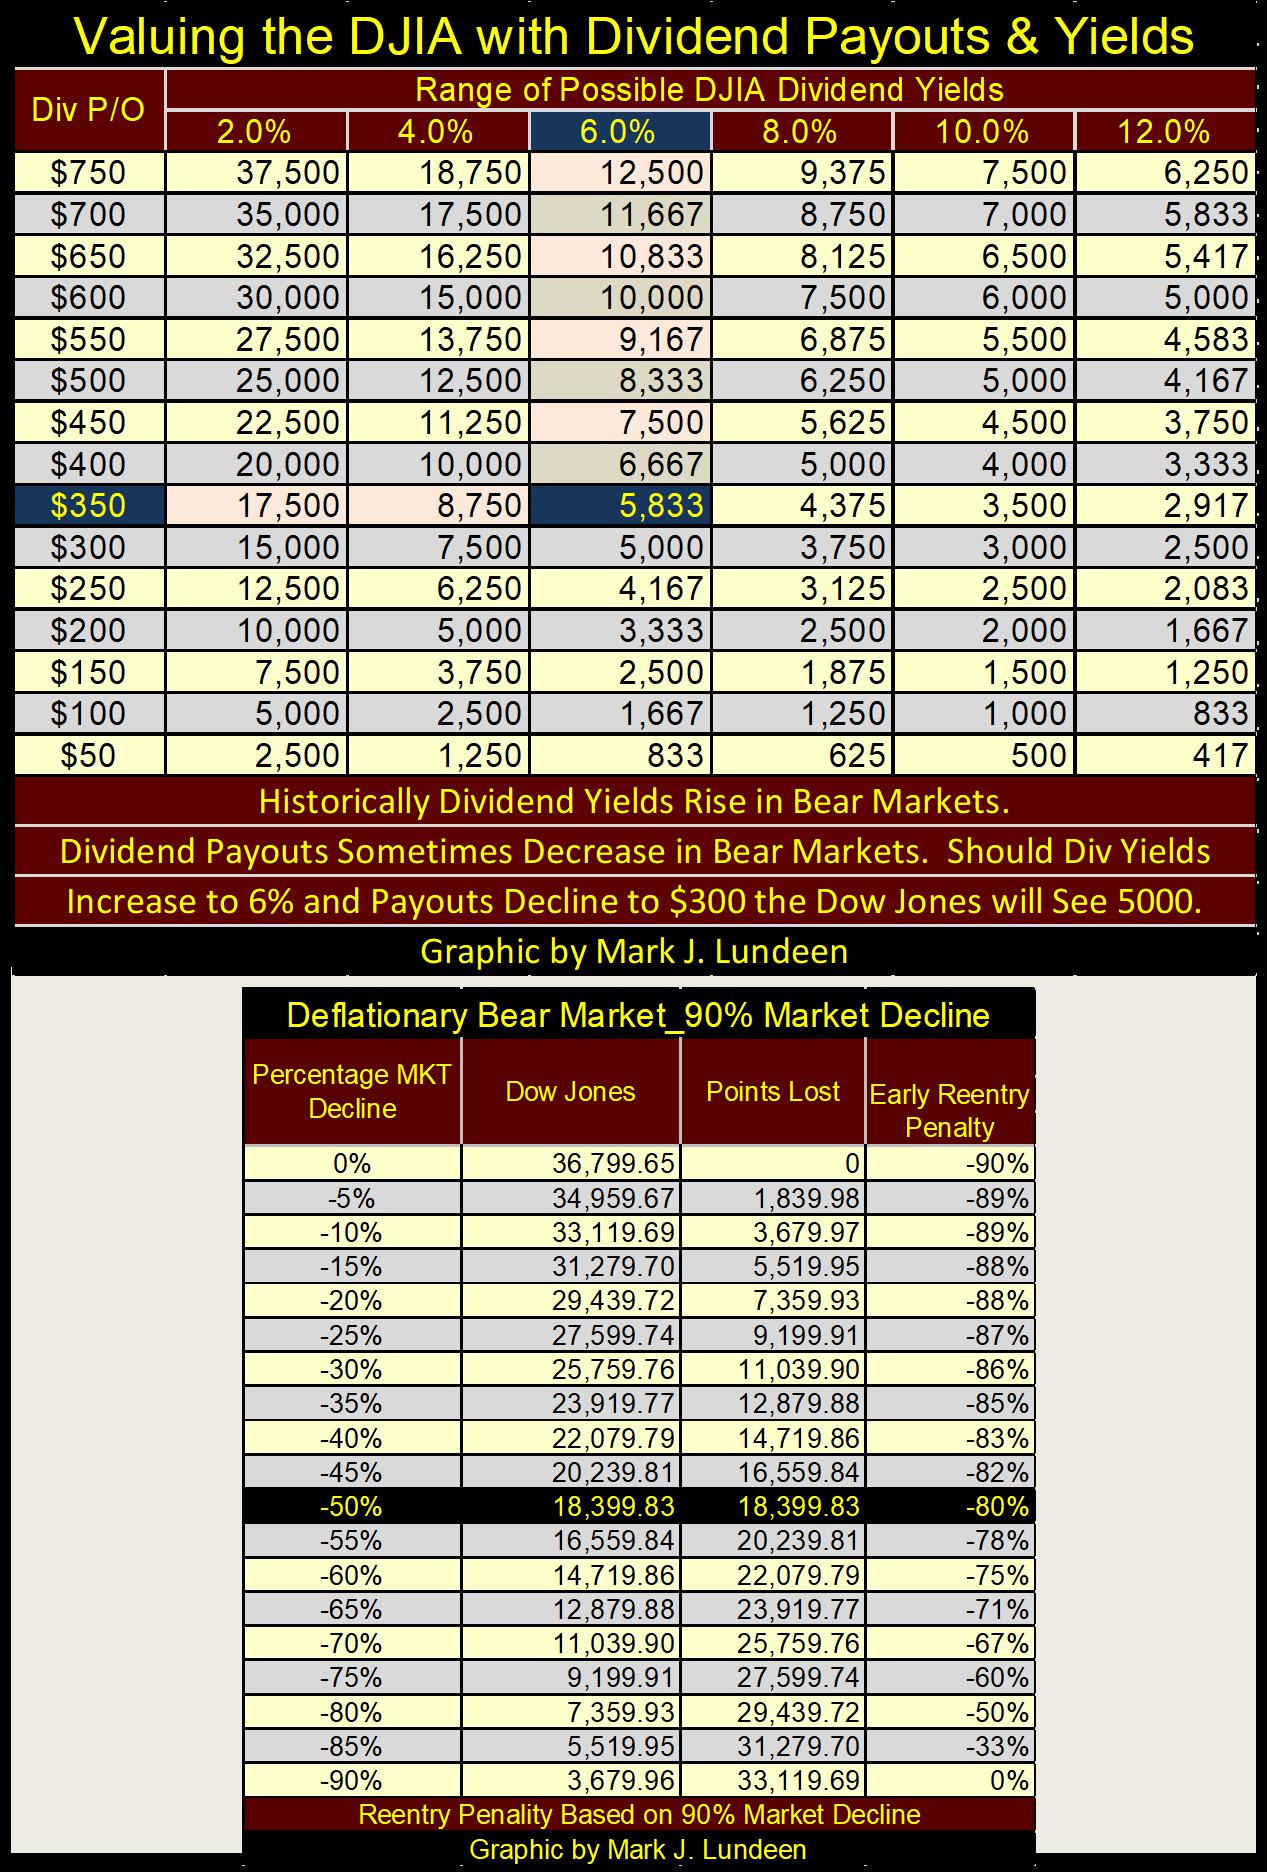
The table above provides a cautionary warning of returning to the stock market too early in a massive deflationary bear market. Should the Dow Jones’ valuation deflate by 50% from its last all-time high, on its journey to a 90% bear market bottom, buying at that point will result in an 80% loss of invested funds at the bottom of the bear market. Even returning to the market following an 85% market decline, would result in a 33% loss of invested funds at the bottom of a 90% bear market.
Seeing the stock market turn into quicksand that swallowed all wealth invested in it, was why the Great-Depression Crash was such a horror show, a horror show that remains burned into the memory of people today. My personal fear for the market, is we are going to live through a Greater-Depression Crash, made manifest by Alan Greenspan’s “monetary policy” of refusing to allow the dividend yield for the Dow Jones to rise above 3% for the past thirty-three years.
In a world where corporate credit is deteriorating, as the global-banking system is on the brink of insolvency, plus the continuing tale-of-woe called the American dollar, bond and dividend yields are going to rise significantly. As seen above, that is not good for the bulls.
You have been warned.
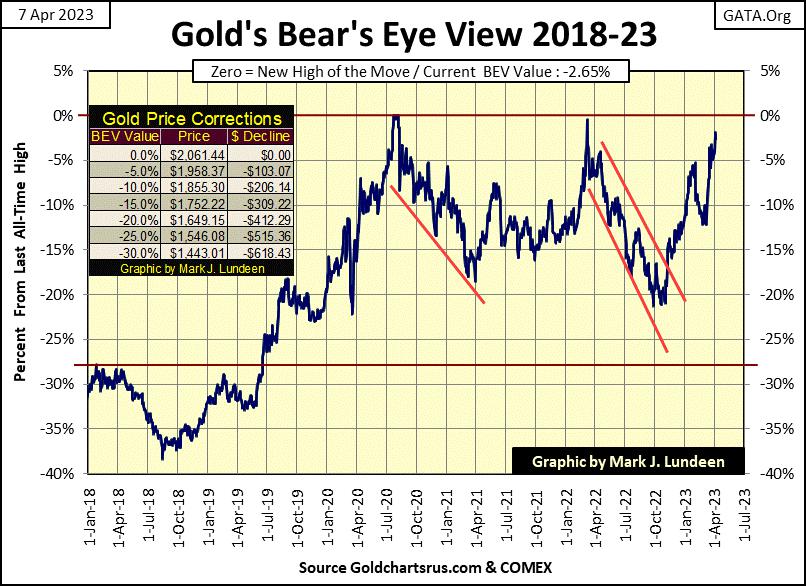
On that cheery thought, let’s take a look at gold’s BEV chart below. Gold closed the week only 2.65% from its last all-time high from August 2011. Isn’t that good? It should be. Then why do I keep looking at gold’s BEV -10% line, as if it’s the next BEV line for gold to cross? I know why; I’m still suffering from Battered Bull Syndrome (BBS), thanks to all the shenanigans the COMEX goons have inflicted on the gold market for the past few decades.
As for most investors, they too suffer from BBS as far as things gold and silver goes. Because of it, they remain hopeful on yesterday’s NASDAQ glamor issues, while shunning out of favor precious metal assets. There are times when success in investing is dependent on leaving one’s comfort zone, and taking a position that may result in some loss of sleep. Today, that would be selling the broad market and buying gold, silver and the precious metal miners.
Ignoring my emotional trauma, I have to say gold’s BEV chart below looks great. At week’s close, gold is only $60 away from making a new all-time high (0%). When gold once again makes market history, that will be big news even in the mainstream financial media.
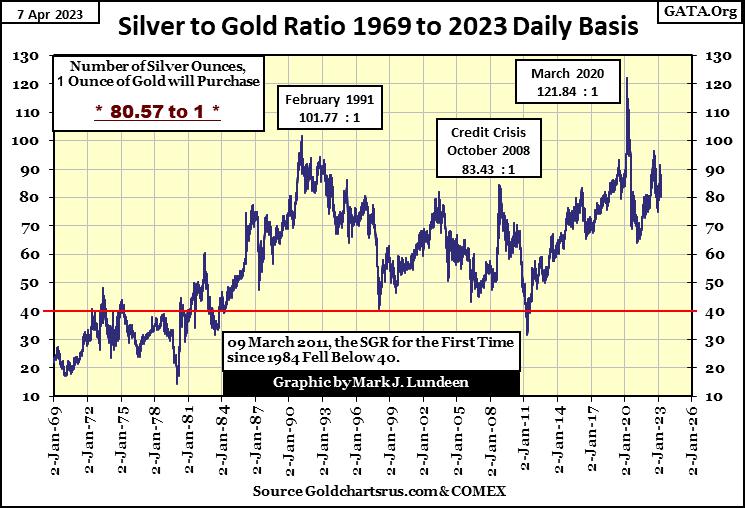
The silver to gold ratio (SGR) closed the week at 80.57 ounces of silver for 1 ounce of gold. This is a historically high ratio, placing it in the 90 row (90 to 80.01) in the table below. Since 1969, only 1,224, or 8.97% of daily closings have seen the SGR in this range. There is good reason expecting this ratio to decrease as 2023 progresses, and if it does, that is typically what the SGR does in precious metal bull markets.
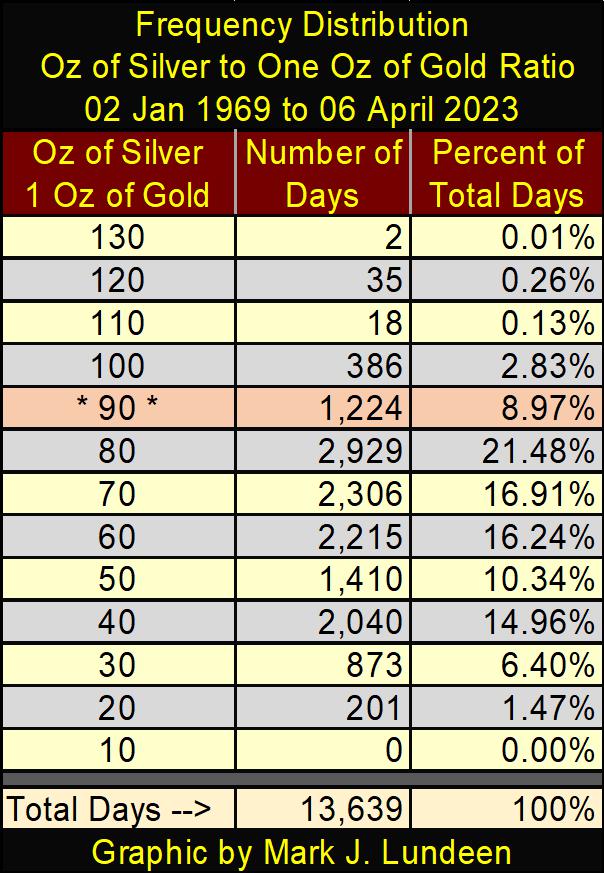
In a bull market for gold and silver, this ratio will again break below its 40 line. When it does, the world around us will be totally transformed, but not in a good way. What a mess the “policy makers” have made of our world.
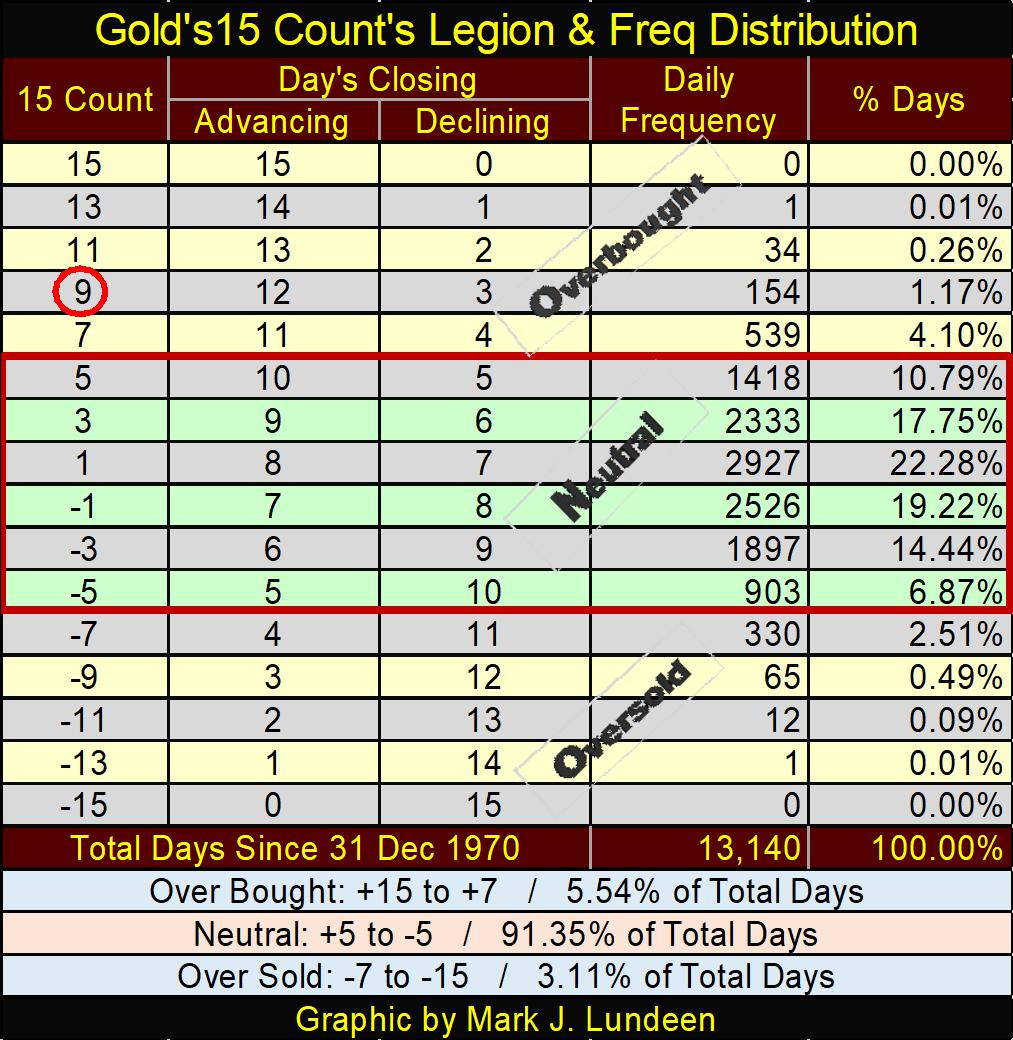
I’ve been studying gold’s step sum table below, and my BBS has eased greatly from what I see. Check this out. On March 17th, gold’s 15-count was a very overbought +9. Since December 1970, gold has closed with a 15-count of +9 for only 154 daily closings. A +9 is a true market extreme. As markets don’t like being very overbought, they tend to sell off from them.
Which gold did, as seen by its 15-count of -1 on this week’s close. Look at all those daily declines in the table below from March 17th to this week’s close on April 6th.
But what happened to the price of gold since March 17th? It went up, now closing above $2000 an ounce. This doesn’t happen very often; seeing the price of gold rise as its 15-count corrects from a very overbought +9. This indicates, to me anyway, that demand for gold is now overwhelming the naked short-selling goons at the COMEX.
This could be history in the making. All we need now is for gold to close above its last all-time high: $2061.44. Let’s see if the COMEX goons can do anything about that in the weeks to come. If they can’t, we may see an explosive advance in the price of gold and silver in the not to distance future.
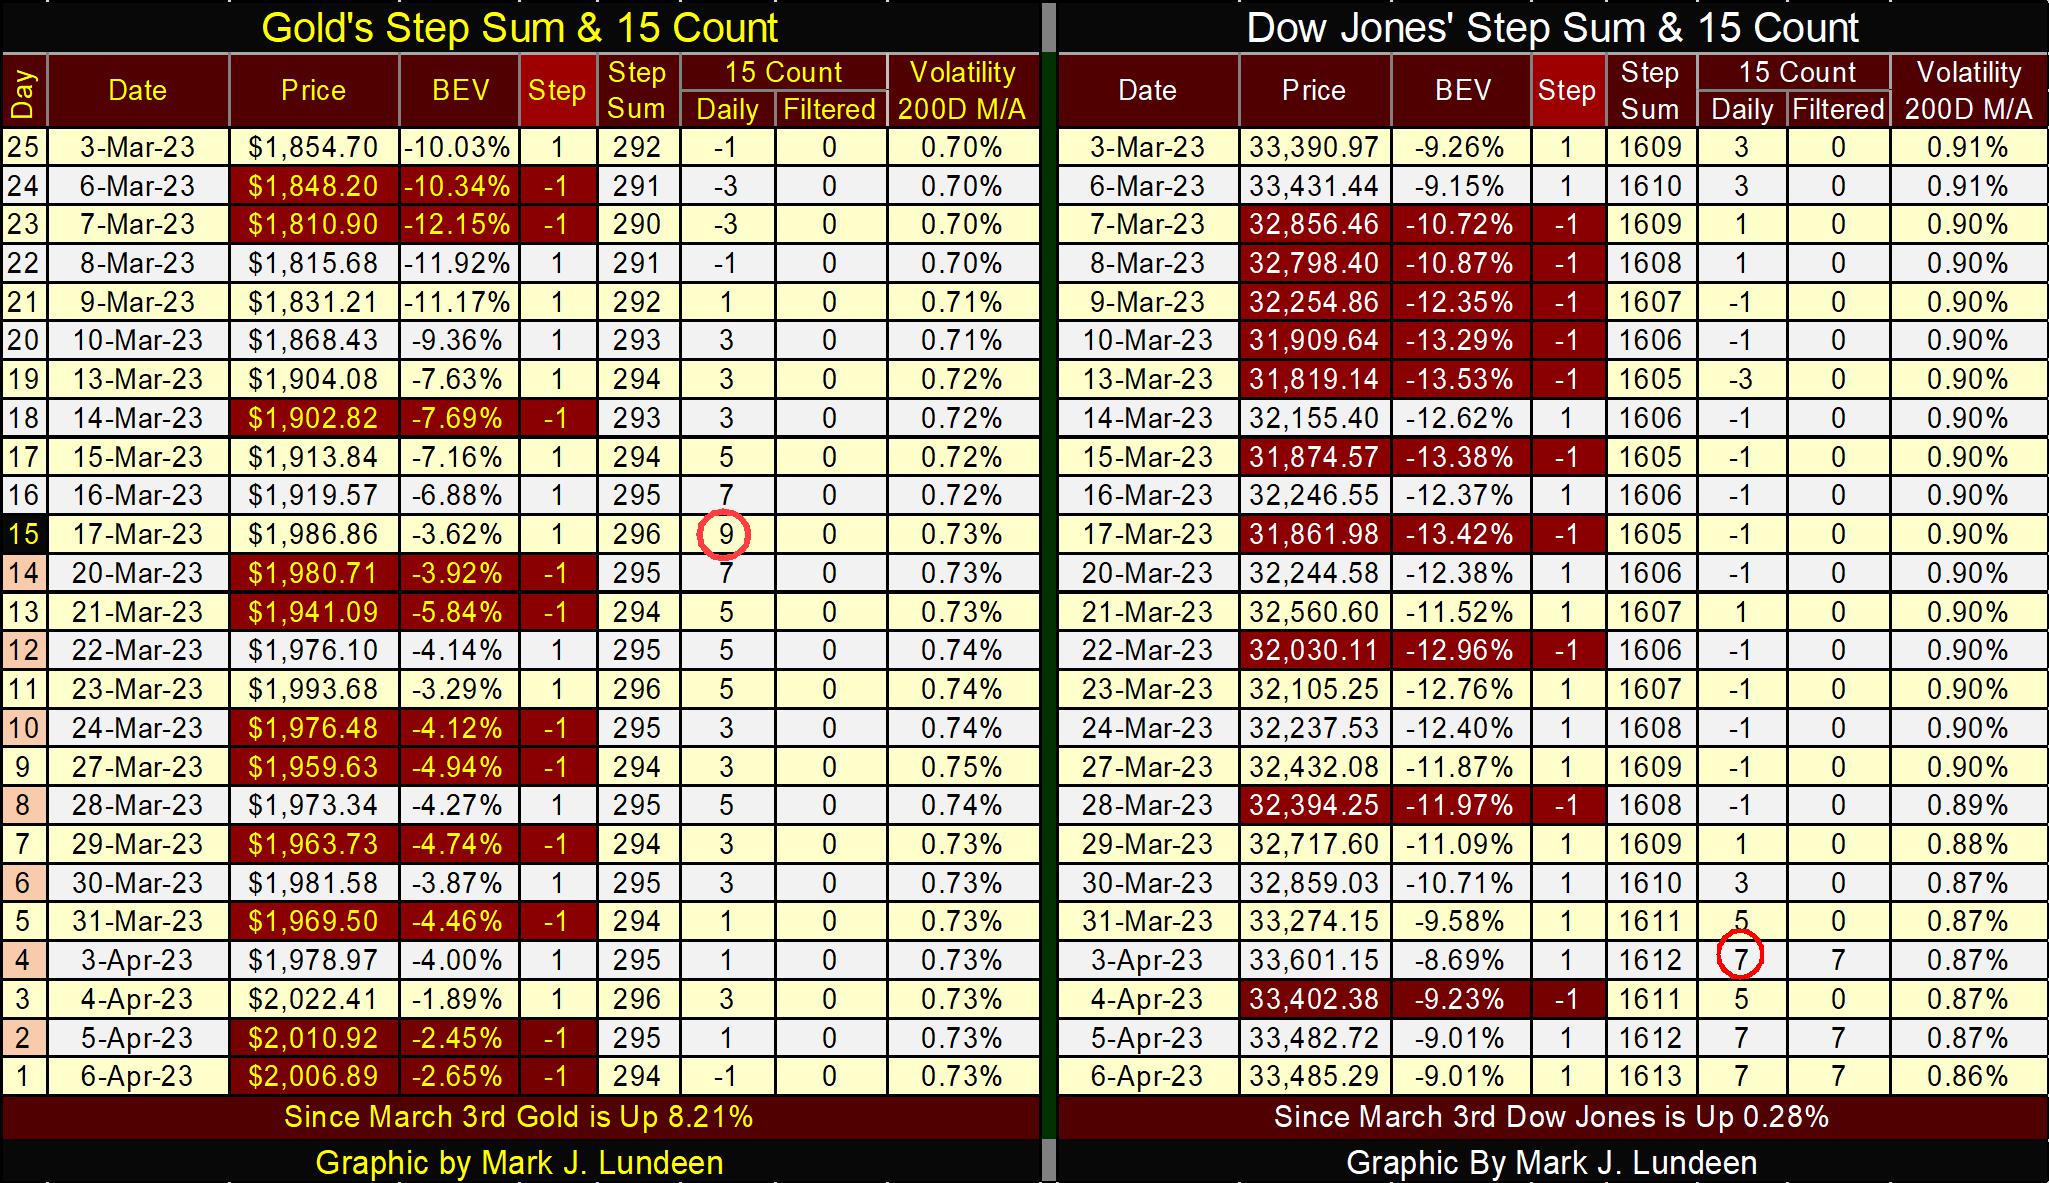
On the Dow Jones’ side of the table, we see that the Dow Jones became overbought with a +7 on April 3rd. Will it now sell off, or become even more overbought with a +9? In any event, as the Dow Jones is now overbought, as gold was, we should now expect an increase in daily declines for the Dow Jones. But will the valuation for the Dow Jones rise with the increases in daily declines, as gold did? Not likely!
Daily volatility continues decreasing, closing the week with a 0.86%. That is a big plus for the stock market. But it will take a lot more than just that for me to become excited about buying what Wall Street is selling.
Seeing the Dow Jones’ dividend payout reduced by 50% as its yield increases to something over 6% seems like a good base line for becoming bullish on the market again. The only thing between that and now, is enough time to see that happen. Patience is a virtue in this market.
Mark J. Lundeen
*********


