How to Gauge the Equities Market


Over the years I have found an indicator/trading tool which I find help spot intermediate trend reversals. I am going to quickly cover in this report. As most of you know the 20 simple moving average is a great gauge for telling you if you should be looking to buy the dips or sell the bounces. It's an indicator I keep on the broad market charts like the SP500, Dow and NASDAQ.
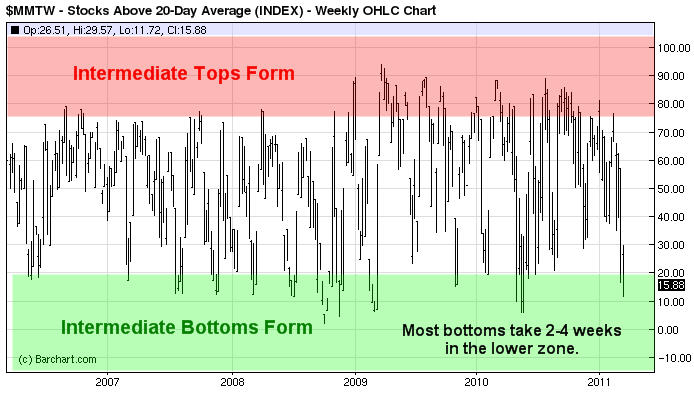
The chart below shows the percentage of stocks trading above the 20 moving average. When this indicator falls below 20%, I make sure I start to protect my short positions with more aggressive protective stops and keep an eye on short term sentiment, volume ratios, options and price action as a bottom can take place at any time and very quickly. Bottoms tend to be more of an event happening quickly with a washout/panic selling day followed by a sharp rally, while intermediate market tops drag out taking weeks if not months to roll over and are very difficult to trade which is what we have been experiencing so far this year.
As you can see this indicator is currently trading in the lower reversal zone and I feel a bottom will form before March is over.
SP500 Daily Chart
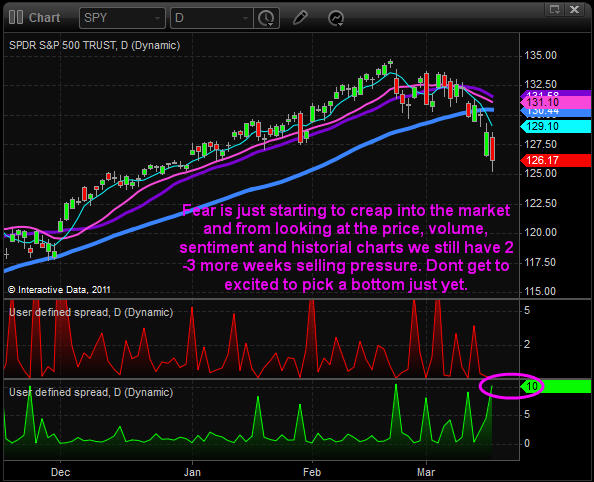
The SP500 continued lower today, which is what I mentioned, would most likely take place in my pre-market video this morning. The trading session was a roller coaster with news on Japans reactors causing large waves of buy and selling throughout the day. I have not seen traders follow the news so close like this in some time… Everyone has their fingers hovering over the buy and sell button these days.
Looking at the bottom indicator which is my gauge of panic selling within the market, it has yet to close above 15 which is the minimum number I typically look for before I start zooming into the intraday charts for a long entry (market bottom). We still could see much lower prices before we see that.
Gold 4 Hour Chart
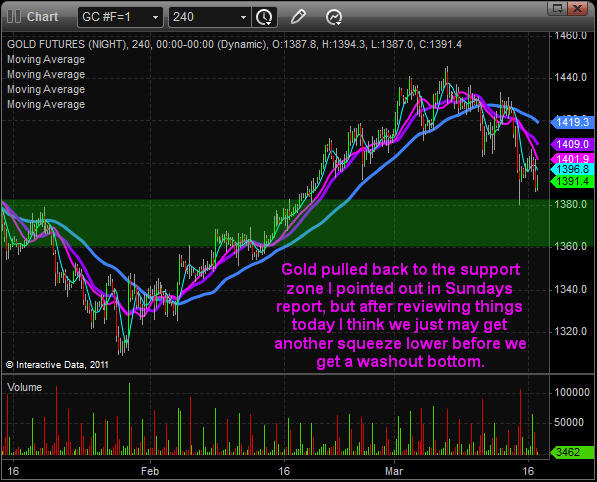
This chart is the same one I showed in my Sunday night report, which explained why gold should test the $1380-90 level in the coming days. We did see that unfold this week but now the chart is pointing to possibly even lower prices with a support range between $1360 -1380 taking place this week. Keep an eye on it as it should be swift if it does occur.
Mid-Week Trend Report
In short, we are finally getting the correction everyone has been waiting for and now that it's started and we are short, we must start watching closely for a bottom because they can take place very quickly.
My focus is still on playing the short side but I have my antennas up just in case signs of a bottom start showing up.
If you would like to get my free weekly reports please visit my website: www.thegoldandoilguy.com/trade-money-emotions.php
Chris Vermeulen

Chris Vermeulen has been involved in the markets since 1997 and is the founder of Technical Traders Ltd. He is an internationally recognized technical analyst, trader, and is the author of the book: 7 Steps to Win With Logic
Through years of research, trading and helping individual traders around the world. He learned that many traders have great trading ideas, but they lack one thing, they struggle to execute trades in a systematic way for consistent results. Chris helps educate traders with a three-hour video course that can change your trading results for the better.
His mission is to help his clients boost their trading performance while reducing market exposure and portfolio volatility.
He is a regular speaker on HoweStreet.com, and the FinancialSurvivorNetwork radio shows. Chris was also featured on the cover of AmalgaTrader Magazine, and contributes articles to several financial hubs like MoneyShow.com.


