How Soon $2,000+ Gold -- And $100+ Silver?


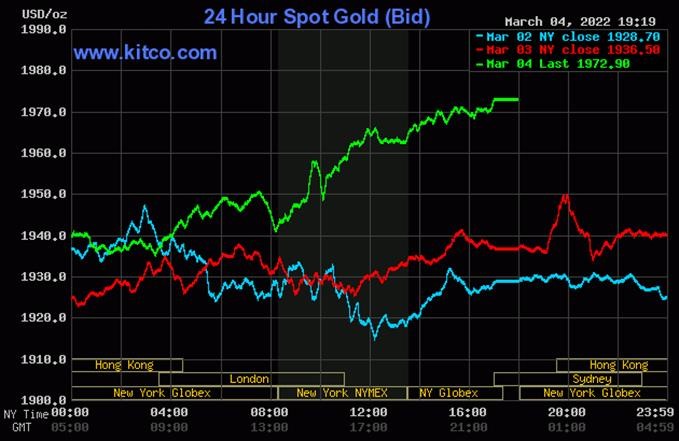
The gold price traded quietly sideways for an hour once trading commenced at 6:00 p.m. EST on Thursday evening -- and at 8 a.m. China Standard Time on their Friday morning, it took off higher, only to run into the short sellers of last resort a bit under an hour later -- and an hour after that they'd sold it back below unchanged by a few dollars. It recovered a bit in short order -- and then didn't do much until around 8:20 a.m. in London. It began to head unevenly higher from there, but was tapped a bit lower until around 12:35 p.m. GMT -- and that lasted until about ten minutes before the COMEX open in New York. From that juncture it rallied quietly and a bit unevenly higher until the market closed at 5:00 p.m. EST.
The low and high ticks in gold were reported as $1,931.50 and $1,974.90 in the April contract. The April/June price spread differential in gold was $3.30...June/August was $3.70 -- and August/October was $4.00 an ounce.
Gold finished the Friday trading session at $1,972.90 spot, up $36.40 on the day. Net volume was very heavy at 227,000 contracts -- and there was a bit under 16,500 contracts worth of roll-over/switch volume on top of that...Mostly into June, with a bit into August.
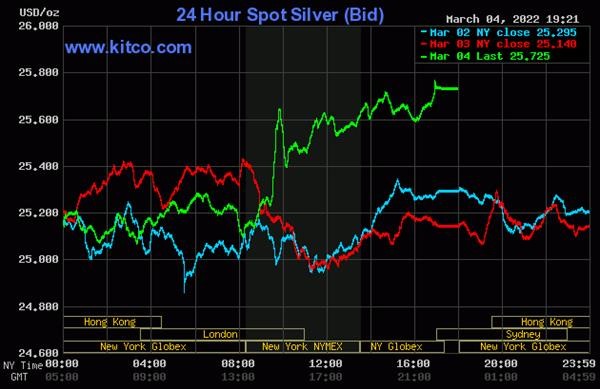
Every rally attempt by silver in Far East trading was turned lower, but it was well bid at just below $25.10 spot the whole time. Like gold, it too began to head higher around 8:20 a.m. in London -- and its moon-shot rally starting at 9 a.m. in New York was capped and turned down hard in short order. But from there it continued its rally in a more subdued fashion. It ran into 'something' once again at 2:45 p.m. in after-hours trading, but shrugged that off in the last hour of trading.
The low and high ticks in silver were recorded by the CME Group as $25.155 and $25.92 in the May contract. The March/May price spread differential at the close in New York yesterday afternoon was the same tiny 0.7 cents an ounce -- May/July was 4.2 cents -- and July/September was 5.4 cents an ounce.
As Ted pointed out on the phone yesterday, the price spread differentials in the future months in silver have tightened up decent amounts since Thursday, an indication that the physical tightness in good delivery bars is getting even worse.
Silver finished the Friday trading session in New York at $25.725 spot, up 58.5 cents from Thursday. Net volume was a bit on the heavier side, but nothing really spectacular, at about 59,500 contracts -- and there was just about 12,800 contracts worth of roll-over/switch volume in this precious metal...mostly into July, with a bit into both September and December.
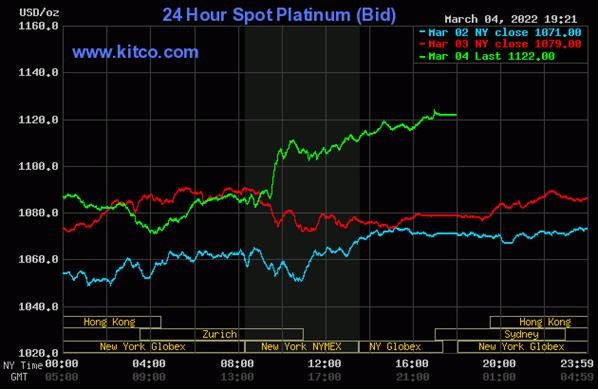
The platinum price rallied quietly until around 11:15 a.m. China Standard Time on their Friday morning -- and from that point it wandered quietly lower until its low tick was set very shortly after 10 a.m. in Zurich. It proceeded to crawl quietly higher from there until, like silver, it shot higher at the 9:30 a.m. equity market opens in New York. That was dealt with in short order -- and from shortly after the 11 a.m. EST Zurich close, it crept higher until the market closed at 5:00 p.m. EST. Platinum finished the Friday trading session in New York at $1,122 spot, up 43 dollars on the day.
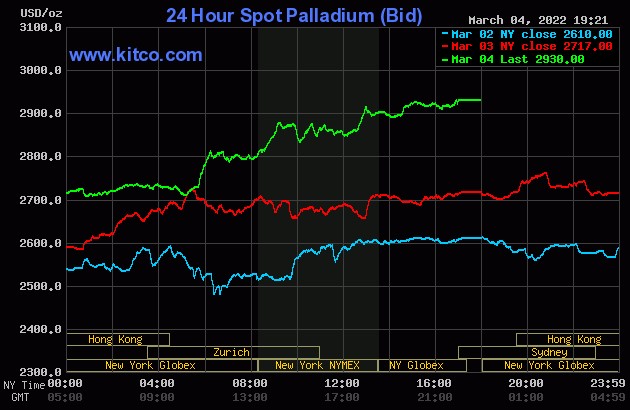
Palladium's rally in early morning trading in the Far East on their Friday was capped and turned lower very shortly before 10 a.m. China Standard Time -- and that lasted for about two hours. From there it didn't do a whole heck of a lot until around 11:15 a.m. in Zurich. From that point it stair-stepped its way quietly and aggressively higher until the market closed at 5:00 p.m. in New York. Platinum finished the day at $2,930 spot, up 213 bucks.
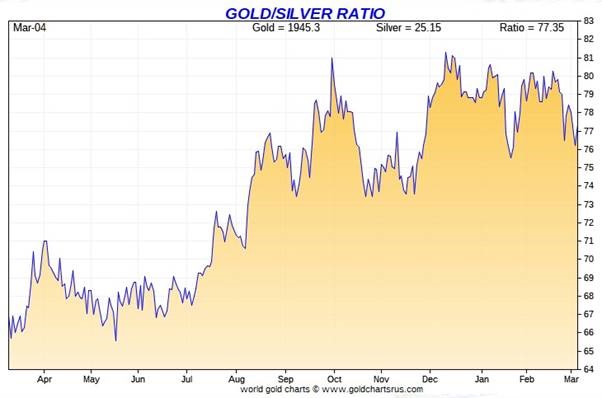
Based on the kitco.com spot closing prices in silver and gold posted above, the gold/silver ratio worked out to 76.7 on Friday...compared to 77.0 to 1 on Thursday.
Here's Nick Laird's 1-year Gold/Silver Ratio chart, updated with the last five trading days worth of data. Click to enlarge.
--------
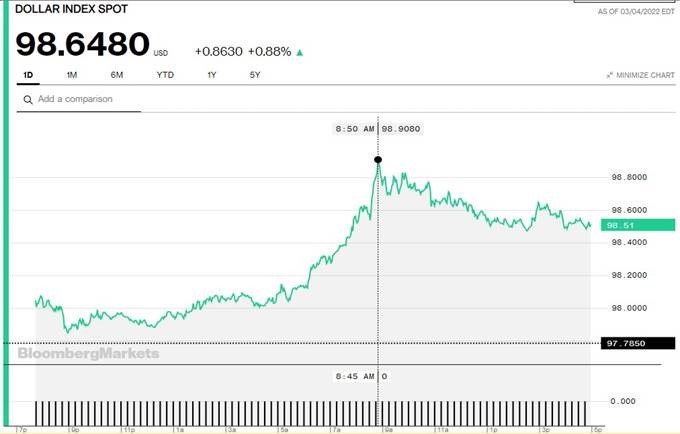
The dollar index closed very late on Thursday afternoon in New York at 97.785 -- and then gapped higher by 27.5 basis points once trading commenced around 7:45 p.m. EST on Thursday evening, which was 8:45 a.m. China Standard Time on their Friday morning. It had a very quiet up/down move to its low tick of the day, which was set a couple of minutes before 10 a.m. CST. From that juncture it wandered very quietly higher until the 'rally' became far more serious starting around 11:08 a.m. in London. The high tick was set at 8:50 a.m. in New York -- and it was all down hill from there until around 2:32 p.m. EST. A tiny rally at that point ended a couple of minutes before 3 p.m. -- and it then continued to chop quietly lower until the market closed at 5:00 p.m. EST.
The dollar index finished the Friday trading session in New York at 98.648...up 86.3 basis points from its close on Thursday -- and about 14 basis points above it indicated spot close on the DXY chart below.
Here's the DXY chart for Friday, thanks to Bloomberg as always -- and the above-mentioned discrepancy should be noted. Click to enlarge.
And here's the 5-year U.S. dollar index chart that appears in this spot in every Saturday column, courtesy of stockcharts.com as always. The delta between its close...98.67...and the close on the DXY chart above, was about 2 basis points above its spot close on Friday. Click to enlarge.
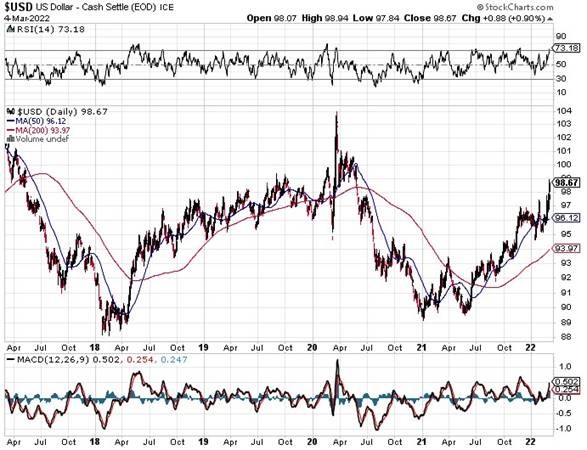
It's now obvious, that unless the powers-that-be wish it, the DXY has now become totally disconnected from what's happening in the precious metals...as both are rising at the same time.
U.S. 10-Year Treasury: 1.7240%...down 0.1200 (-6.51%)...as of 02:59 p.m. EST
Here's the 5-year 10-year U.S. Treasury chart from the yahoo.com Internet site -- and it puts the yield curve into a somewhat longer-term perspective. Click to enlarge.
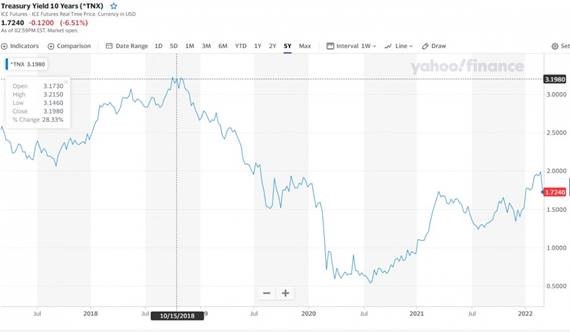
As you are more than aware, the only reason that yields are where they are, is because the central banks of the world continue to buy up almost all of the sovereign debt being issued. That isn't about to stop anytime soon, despite their preaching about higher interest rates -- and tapering. There isn't any tapering as far as the Fed is concerned, as their bond buying continues unabated...as it does at most of the rest of the world's major central banks.
-------
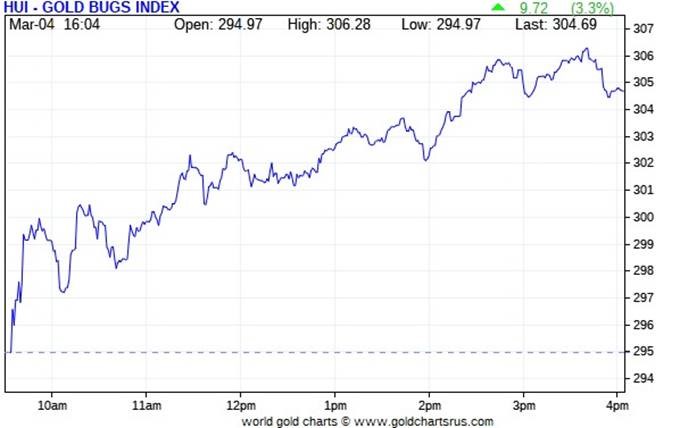
The gold stocks were in rally mode right from the 9:30 a.m. opens in New York on Friday morning -- and that continued until around 3:40 p.m. when there were sold a bit lower into the 4:00 p.m. close. The only reason that happened was because gold was tapped a few dollars lower at that time. The HUI finished the Friday session higher by 3.30 percent.
Computed manually, Nick Laird's Intraday Silver Sentiment/Silver 7 Index closed up a very unimpressive 1.99 percent...not helped at all by Peñoles or Hecla Mining.
And here's Nick's 3-year Silver Sentiment/Silver 7 Index chart, updated with Friday's candle. Click to enlarge.
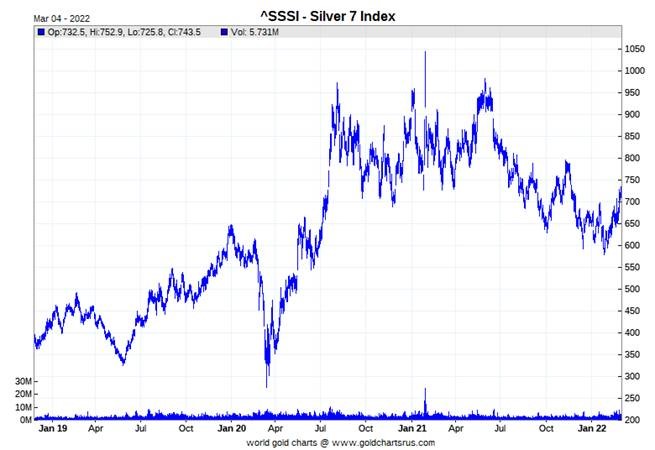
The absolute star was Pan American Silver, as it closed higher by 4.15 percent. The two pooches were lead by Peñoles, as it actually closed down on the day by 0.35 percent -- and Hecla Mining only closed up by 0.43 percent. I was underwhelmed, as were you I'm sure.
In the interest of full disclosure, I added to my position in Ninepoint Silver Equities Fund yesterday, a mutual fund only available in Canada.
The latest silver eye candy from the reddit.com/Wallstreetsilver crowd is linked here.
-----
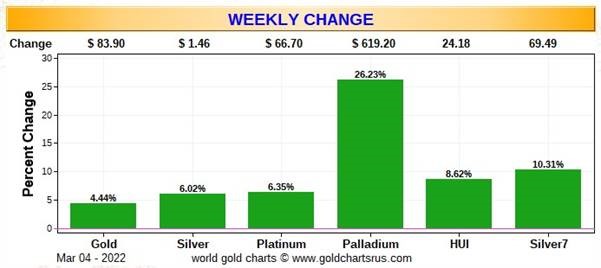
Here are two of the three usual charts that show up in every weekend missive. They show the changes in gold, silver, platinum and palladium in both percent and dollar and cents terms, as of their Friday closes in New York — along with the changes in the HUI and the Silver 7 Index.
Here's the weekly chart...which is all green for the second week in a row -- and the standout feature is the monster gain in palladium, as it closed higher by almost 600 bucks over the last five trading sessions. Silver and its equities outperformed their golden cousins this week, but not by a meaningful amount. Click to enlarge.
There's no month-to-date chart this week, as it's only four days long. It will reappear in this spot in next week's column.
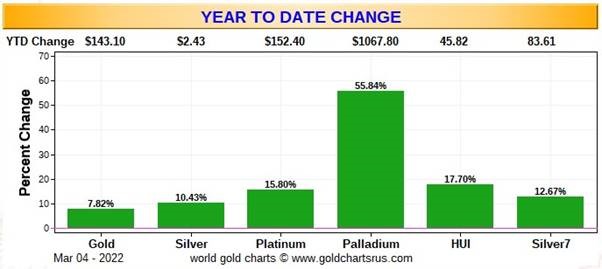
Here's the year-to-date chart -- and the big gains of late has turned this chart all green as well...with the silver stocks being the underperformers vs. its underlying precious metal so far this year. That will change at some point. Palladium's gain year-to-date is nothing short of spectacular...but all it's doing, like the other three precious metals, is attempting to seek it's intrinsic/free-market value. Click to enlarge.
Of course how much longer these gains will be allowed to continue is in the hands of the commercial traders of whatever stripe, as they alone control everything precious metals-related...until the time that they don't.
-------
The CME Daily Delivery Report showed that 420 gold and a 563 silver contracts were posted for delivery within the COMEX-approved depositories on Tuesday.
In gold, the sole short/issuer was Barclays out of its client account. The largest of the ten long/stoppers was BofA Securities, as they picked up 228 contracts for their house account. Next was the 53 contracts stopped by Australia's Macquarie Futures, followed by JPMorgan picking up 48 contracts. Both amounts were for their respective client accounts.
In silver, the sole short/issuer was JPMorgan out of its house account -- and I know Ted won't be happy to see that. There were five long/stoppers in total, the biggest being Wells Fargo Securities, stopping 195 contracts for its own account...followed by JPMorgan, as they picked up 162 contracts for clients.
This is the second time this week that JPMorgan has been forced to step in as a short/issuer, as someone who had gone long against them demanded delivery -- and they had to pony up. Or it could have been a situation where they had to step in order to prevent what might have been another potential COMEX delivery default.
I'm sure that Ted will have something to say about all this in his weekly review later this afternoon.
In palladium, there were 2 contracts issued and stopped.
The link to yesterday's Issuers and Stoppers Report is here.
Month-to-date there have been 4,101 gold contracts issued/reissued and stopped -- and that number in silver is 8,081 COMEX contracts. In platinum and palladium there have been 69 and 156 contracts stopped respectively.
The CME Preliminary Report for the Friday trading session showed that gold open interest in March increased by 17 contracts, leaving 1,936 contracts still open, minus the 420 contracts mentioned a few paragraphs ago. Thursday's Daily Delivery Report showed that zero gold contracts were posted for delivery on Monday, so that obviously means that 17 more gold contracts were added to March deliveries. Silver o.i. in March fell by 2,605 COMEX contracts, leaving 1,108 still around, minus the 563 contracts mentioned a few paragraphs ago. Thursday's Daily Delivery Report showed that 3,062 contracts were actually posted for delivery on Monday, so that means that 3,062-2,605=457 more silver contracts just got added to the March delivery month. That's a lot!
Total gold open interest at the close on Friday rose by an eye-watering 17,351 COMEX contracts -- and total silver o.i. increased by 4,760 contracts...with both numbers subject to some slight revisions, usually downwards, once the final number are posted on the CME's website later on Monday morning CST.
--------
There was a fairly decent deposit into GLD and GLDM yesterday, as one or more authorized participants added 130,426 troy ounces of gold to the former -- and 79,193 troy ounces to the latter. There were no reported changes in SLV...which Ted feels is now owed something in the order of 20-25 million troy ounces.
And judging by the rate of deposits into SLV recently, along with the ongoing conversion of shares for physical, one would have to suspect that the authorized participants are shorting the shares in lieu of depositing physical metal. It's a near certainty that Ted will have something to say about this in his weekly review for his paying subscribers this afternoon.
The new short report comes out on Wednesday -- and it's most unfortunate that all of the activity in SLV since the February 28th cut-off, won't be in it.
And on a housekeeping note, Ted and I had a discussion about GLD vs. GLDM on the phone yesterday -- and after an e-mail exchange with Nick, I've discovered that I haven't been reporting their inventory additions and declines in my daily column, which I will start doing immediately...starting today if you noticed above.
Because of this comment from Ted yesterday, I inadvertently under-reported the amount of gold that was deposited in GLD and GLDM in my Friday column. I reported zero ounces for GLD, but 79,476 troy ounces was added to GLDM. I shall not overlook this data point again.
In other gold and silver ETFs and mutual funds on Planet Earth on Friday, net of any changes in COMEX, GLD/GLDM & SLV inventories, there was a net 199,772 troy ounces of gold added -- but a net 2,059,234 troy ounces of silver was taken out, with the lion's share of that coming from Deutsche Bank...1,869,598 troy ounces.
And because I overlooked that deposit in GLDM in yesterday's column, there was actually a net 152,166 troy ounces of gold added to those 'other gold and silver ETFs and mutual funds' on Thursday -- and not the 72,690 that I had reported.
There was no sales report from the U.S. Mint yesterday, so the month-to-date sales are only the ones that were reported on Thursday...8,500 troy ounces of gold eagles -- 5,000 one-ounce 24K gold buffaloes -- and 4,700 platinum eagles -- and zero silver eagles.
As I said in this space last Saturday, these numbers are far below what the mint is capable of producing, so it couldn't be more obvious that the mint is dragging its feet -- and not producing enough to meet demand as the law requires.
If they were producing enough silver eagles to meet demand, then premiums wouldn't be as outrageous as they are. So it's equally obvious that they're holding back production in order not to exacerbate the increasingly squeaky-tight physical market in good delivery bars.
And there's still no Q4/2021 Annual Report from the Royal Canadian Mint.
 .........
There was only a small of activity in gold over at the COMEX-approved depositories on the U.S. east coast on Thursday. They reported receiving 13,305 troy ounces...all of which went into Brink's, Inc. There was 321.510 troy ounces/10 kilobars shipped out -- and that left the International Depository Services of Delaware.
There was some paper activity, as 36,422 troy ounces was transferred from the Registered category and back into Eligible. There were four depositories involved -- and the two largest were lead by the 25,648 troy ounces that departed Brink's, Inc. -- and the second biggest transfer was the 9,716 troy ounces that made that same trip over at Manfra, Tordella & Brookes, Inc. The link to all of Thursday's COMEX gold activity is here.
There was pretty decent activity in silver, as there always is. There was 922,883 troy ounces received -- and 73,598 troy ounces shipped out.
In the 'in' category, by far the largest amount was the 629,435 troy ounces/one truckload that arrived at CNT -- and the next biggest was the 286,461 troy ounces that was dropped off at Brink's, Inc. There remaining 6,986 troy ounces found a new home over at the Delaware Depository.
In the 'out' department, there was 70,829 troy ounces that departed CNT -- and the remaining 2,768 troy ounces left Brink's, Inc. There was no paper activity -- and the link to Thursday's COMEX silver activity is here.
It was also pretty busy over at the COMEX-approved gold kilobar depositories in Hong Kong on their Thursday. They reported receiving 600 kilobars...but shipped out 4,580 of them. Except for the 27 kilobars that departed Loomis International, the remaining in/out activity took place over at Brink's, Inc. as always. The link to that, in troy ounces, is here.
------
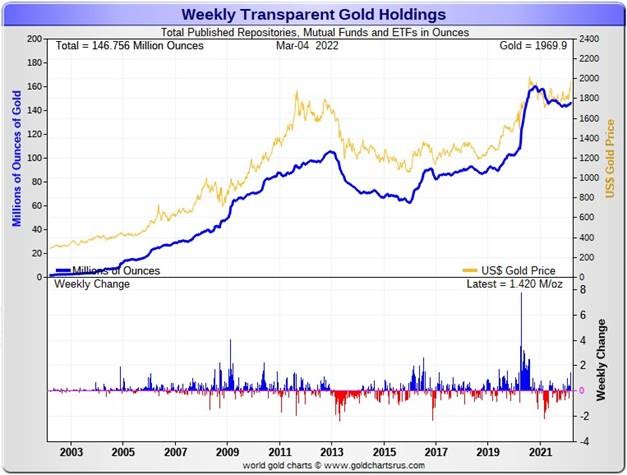
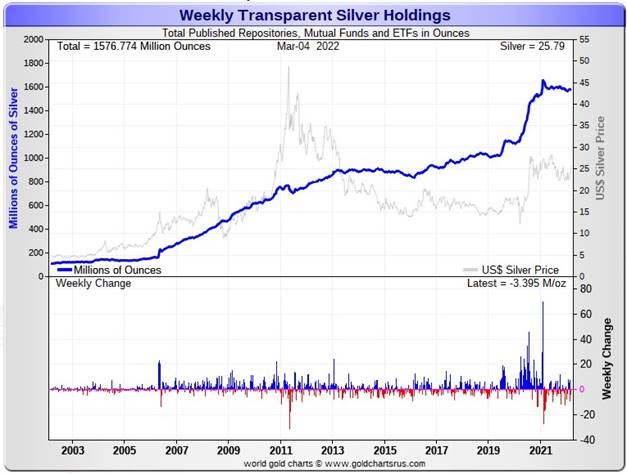
Here are the usual two 20-year charts that show up in this space every Saturday. They show the total amount of physical gold and silver held in all know depositories, ETFs and mutual funds as of the close of business on Friday.
During the week just past, there was a net 1,420,000 troy ounces of gold added -- but a net 3,395,000 troy ounces of silver was removed...with all of that amount, plus more, being conversions of SLV shares for physical...along with the big withdrawal from Deutsche Bank yesterday, that I mentioned above. Click to enlarge.
But in the overall, far more silver has been added to these various ETFs and mutual funds in last month, than has been withdrawn -- and even the withdrawals/exchange for physical in SLV are bullish as well.
And not to be forgotten is the fact that 20-25 million troy ounces of physical silver is owed to SLV, according to Ted.
The physical shortage situation in silver continues to creep along -- and the shrinking price spread differentials in silver since First Notice day is further proof that the physical silver noose is drawing ever tighter in the wholesale market.
Now that silver has broken above its 200-day moving average, ETF and mutual fund demand has exploded -- and retail demand continues to be incandescent.
Something's gotta give sooner or later.
-------
The Commitment of Traders Report for positions held at the close of COMEX trading on Tuesday showed the expected increases in the commercial net short positions in both gold and silver.
And also as expected, it was a Big 4/raptor affair in both...especially in silver, as is most always the case.
In silver, the Commercial net short position increased by a pretty hefty 13,430 COMEX contracts, or 67.2 million troy ounces.
They arrived at that number by decreasing their long position by 4,307 contracts -- and also increased their short position by 9,123 COMEX contracts. It's the sum of those two numbers that represents their change for the reporting week.
Under the hood in the Disaggregated COT Report, it was all Managed Money traders, plus a bunch more, as the increased their net long position by 16,646 COMEX contracts. The other two categories of reporting traders...the Other Reportables and the Nonreportable/small traders went in the opposite direction, as both reduced their net long positions during the reporting week, the former by 2,000 contracts -- and the latter groups by 1,216 contracts.
Doing the math: 16,646 minus 2,000 minus 1,216 equals 13,430 COMEX contracts, the change in the Commercial net short position.
The Commercial net short position in silver now sits at 285.8 million troy ounces...up 67.2 million troy ounces from the 218.6 million troy ounces that they were short in last Friday's COT Report...which is obviously the headline number change mentioned further up.
The Big 8 are short 334.5 million troy ounces in this week's COT Report, up 7.0 million troy ounces from the 327.5 million troy ounces they were short in last Friday's COT Report and, like last week, that all came courtesy of the Big 4 shorts, as the Big '5 through 8' did hardly anything.
The headline change in the Commercial net short position above showed an increase of 67.2 million troy ounces. So it was Ted's raptors once again, the small commercial traders other than the Big 8 shorts that made up the difference during the reporting week...to the tune of 67.2-7.0=60.2 million troy ounces...12,040 COMEX contracts...as they decreased their long position by that amount.
It was their selling of long positions that had the mathematical effect of increasing the commercial net short position.
Don't forget that despite their small size, Ted's raptors are still commercial traders in the commercial category.
The Big 8 are short 334.5/285.8 equals about 117 percent of the Commercial net short position in silver, down from the 150 percent they were short in last week's COT Report -- and all because of all the longs sold by Ted's raptors.
Here's the 3-year COT chart for silver, courtesy of Nick Laird as always. Click to enlarge.
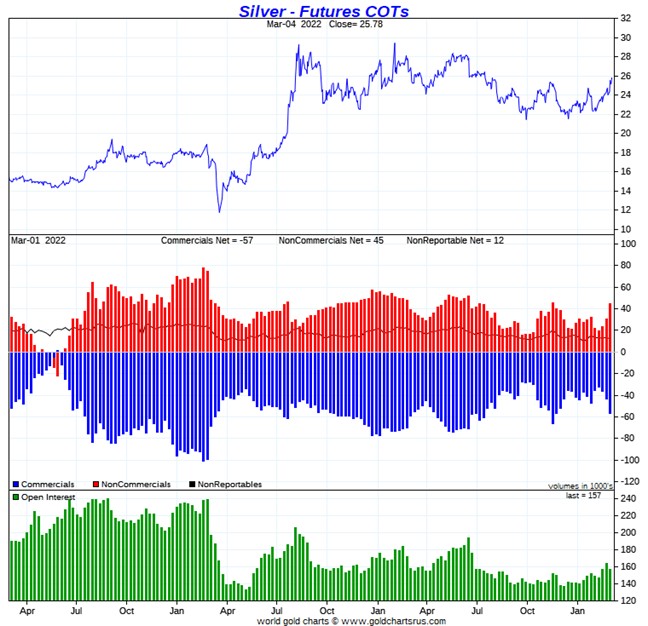
Ho hum...it was yet another raptor/small commercial trader affair during the reporting week -- and that's been the case for many, many months now. The Big 4 shorts increased their net short position, but only by 7.0 million ounces...a drop in the bucket compared to the 334.5 million troy ounces that the Big 8 are currently short in total.
Ted's still of the opinion that there's a commercial trader that's long at least 15,000 COMEX contracts -- and they're hiding out in the Swap Dealer category. He's been mentioning that for a while now, as he's been watching their gross long position in that category creep up by that amount over time -- and it hasn't changed much, despite the price swings. Whoever that might be, it only adds to the bullish case for silver.
And from talking to Ted yesterday, nothing has changed regarding the above.
As you already know, the Big 4 shorts only added to their short position by a small amount during the reporting week -- and he thinks that they're being very cautious about increasing it, because they have been warned by the CFTC not to do so.
But his raptors are getting down to the point where they don't have all that many longs left to sell...9,740 contracts as of Tuesday's cut-off...and even less now. They rarely go on the short side -- and when they do, it's only by a few thousand contracts according to Ted.
So when they run out of long contracts to sell -- and if the Big 4 shorts don't want the silver price to rise further, then they'll have to step in on the short side in a major way. The question at that point will become...will they, or won't they? If they do, we're back to the "same old, same old". But if they don't...we'll have a 3-digit silver price in no time.
Silver is in rally mode now, but obviously being very carefully managed. How high it's allowed to go is entirely up to the commercial traders of whatever stripe...something you know all too well -- and that was on full display on Friday between 9:30 and 10 a.m. in New York...plus earlier in the day in morning trading in the Far East.
The current set-up in the COMEX futures market is still bullish, but obviously not quite as bullish as it was a week ago -- and the commercial net short position is up even more since the Tuesday cut-off...with two more trading days left in the next reporting week.
-----
In gold, the commercial net short position rose by 16,087 contracts, or 1.61 million troy ounces of gold.
They arrived at that number by decreasing their long position by 2,451 contracts -- and also added 13,636 short contracts. It's the sum of those two numbers that represents their change for the reporting week.
Under the hood in the Disaggregated COT Report, the Managed Money traders only made up for part of the buying during the reporting week, as they increased their net long position by 9,645 COMEX contracts. The traders in the Other Reportables category also increased their net long position, them by 4,829 contracts...mostly by covering 4,607 short positions. The traders in the Nonreportable/small trader category followed the script as well, increasing their net long position by a further 1,613 contracts.
Doing the math: 9,645 plus 4,829 plus 1,613 equals 16,087 COMEX contracts, the change in the commercial net short position.
The commercial net short position in gold now sits at 28.58 million troy ounces, up 1.61 million troy ounces from the 26.97 million troy ounces they were short in last Friday's COT Report...which is obviously the change in the headline number further up.
The short position of the Big 8 traders is now 26.41 million troy ounces, up 850,000 troy ounces from the 25.56 million troy ounces they were short in last week's COT Report. As expected -- and for the third week in a row, it was the Big 4 that increased their net short position, while the Big '5 through 8' didn't do much.
The headline change in the commercial net short position showed an increased of 1.61 million troy ounces, so that means that Ted's raptors, the small commercial traders other than the Big 8, had to have sold 1.61-0.85=760,000 troy ounces/7,600 COMEX long contracts to make up the difference -- and that's what they did.
Their selling of long positions had the mathematical effect of increasing the commercial net short position by that amount. So it was 52% raptor/48% Big 8 commercial selling that accounted for this week's change.
And don't forget that despite their small size, Ted's raptors are still commercial traders in the commercial category.
From the above numbers, the Big 8 traders are short 26.41/28.58 equals about 92 percent of the commercial net short position in gold...down about 3 percentage points from the approximately 95 percent they were short in last Friday's COT Report.
This means that Ted's raptors, the small commercial traders other than the Big 8, are short the remaining 8 percent of the commercial net short position in gold.
It's for this very reason that I've been "all in" in the precious metals for as long as I have -- and under the present circumstances we find ourselves in, I'm quite content to be so.
*********


